| Param | Original file | Final file |
|---|---|---|
| Filename | modeM0/AS1G05_245T01_9000000460_03475cztM0_level2.evt | modeM0/AS1G05_245T01_9000000460_03475cztM0_level2_quad_clean.evt |
| Size (bytes) | 100,200,960 | 21,729,600 |
| Size | 95.6 MB | 20.7 MB |
| Events in quadrant A | 1,077,683 | 133,077 |
| Events in quadrant B | 668,688 | 142,476 |
| Events in quadrant C | 633,857 | 144,578 |
| Events in quadrant D | 564,676 | 141,536 |
| Mode M0 | |||
|---|---|---|---|
| Quadrant | BADHDUFLAG | Total packets | Discarded packets |
| A | 0 | 4096 | 2 |
| B | 0 | 2792 | 1 |
| C | 0 | 2738 | 1 |
| D | 0 | 2606 | 1 |
| Mode SS | |||
|---|---|---|---|
| Quadrant | BADHDUFLAG | Total packets | Discarded packets |
| A | 0 | 26 | 0 |
| B | 0 | 26 | 0 |
| C | 0 | 26 | 0 |
| D | 0 | 26 | 0 |
| Mode M9 | |||
|---|---|---|---|
| Quadrant | BADHDUFLAG | Total packets | Discarded packets |
| A | 0 | 3 | 0 |
| B | 0 | 3 | 0 |
| C | 0 | 3 | 0 |
| D | 0 | 3 | 0 |
| Quadrant | Total seconds | Saturated seconds | Saturation percentage |
|---|---|---|---|
| A | 1275 | 141 | 11.058824% |
| B | 1275 | 2 | 0.156863% |
| C | 1275 | 3 | 0.235294% |
| D | 1275 | 1 | 0.078431% |
Noise dominated data is calculated using 1-second bins in cleaned event files. If a bin has >2000 counts, and if more than 50% of those come from <1% of pixels, then it is considered to be noise-dominated and hence unusable.
| Quadrant | # 1 sec bins | Bins with >0 counts | Bins with >2000 counts | High rate bins dominated by noise | Noise dominated (total time) | Noise dominated (detector-on time) | Marked lightcurve |
|---|---|---|---|---|---|---|---|
| A | 1275 | 1275 | 79 | 79 | 6.20% | 6.20% | 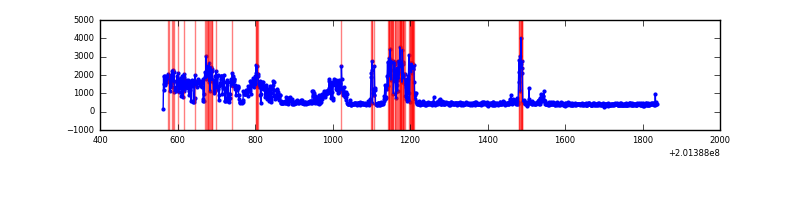 |
| B | 1275 | 1275 | 0 | 0 | 0.00% | 0.00% | 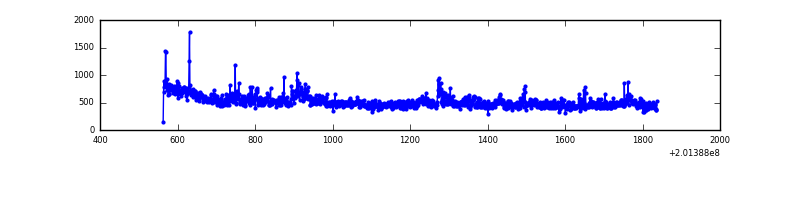 |
| C | 1275 | 1275 | 2 | 2 | 0.16% | 0.16% | 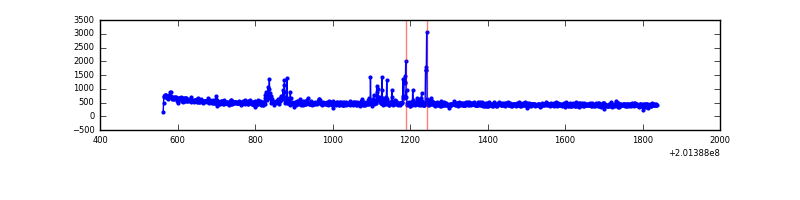 |
| D | 1275 | 1275 | 0 | 0 | 0.00% | 0.00% | 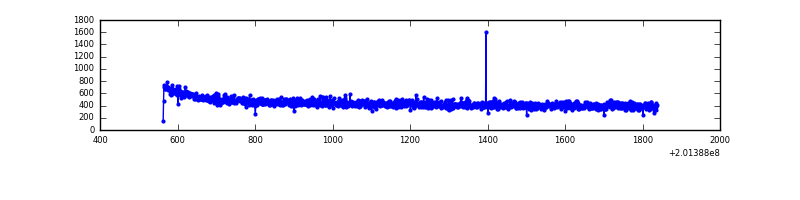 |
Top three noisy pixels from each quadrant. If the there are fewer than three noisy pixels in the level2.evt file, extra rows are filled as -1
| Pixel properties | Quadrant properties | ||||||
|---|---|---|---|---|---|---|---|
| Quadrant | DetID | PixID | Counts | Sigma | Mean | Median | Sigma |
| A | 0 | 118 | 331913 | 10719.6 | 143 | 140 | 31.0 |
| A | 0 | 50 | 144418 | 4661.63 | 143 | 140 | 31.0 |
| A | 0 | 226 | 31676 | 1018.93 | 143 | 140 | 31.0 |
| B | 15 | 204 | 60314 | 1960.66 | 150 | 147 | 30.7 |
| B | 14 | 167 | 16406 | 529.83 | 150 | 147 | 30.7 |
| B | 4 | 81 | 5667 | 179.88 | 150 | 147 | 30.7 |
| C | 7 | 220 | 40232 | 1094.62 | 150 | 150 | 36.6 |
| C | 12 | 4 | 3383 | 88.29 | 150 | 150 | 36.6 |
| C | 13 | 61 | 1210 | 28.95 | 150 | 150 | 36.6 |
| D | 14 | 226 | 1707 | 41.86 | 149 | 144 | 37.3 |
| D | 10 | 172 | 1409 | 33.88 | 149 | 144 | 37.3 |
| D | 3 | 254 | 1209 | 28.52 | 149 | 144 | 37.3 |
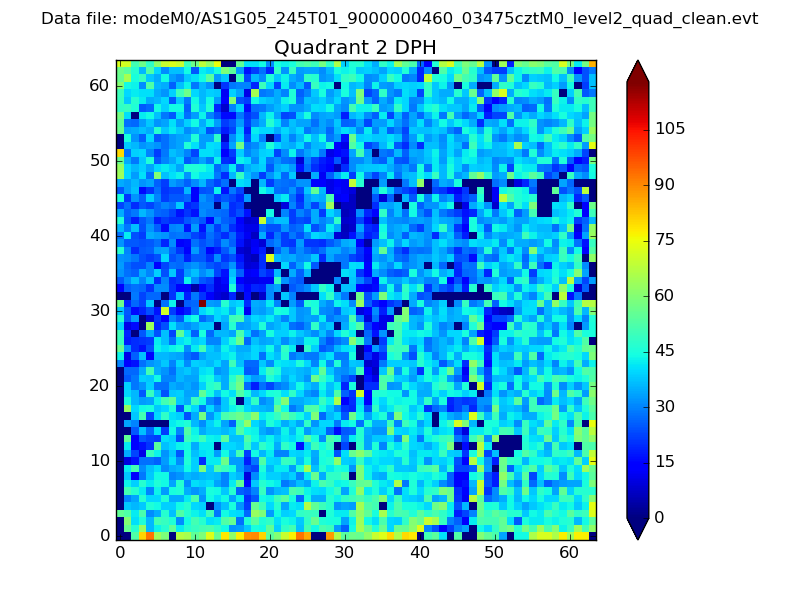
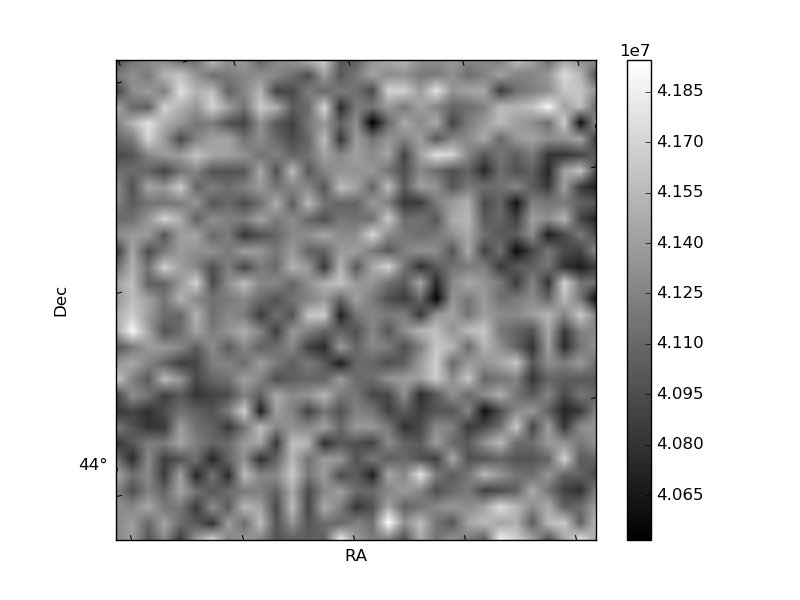
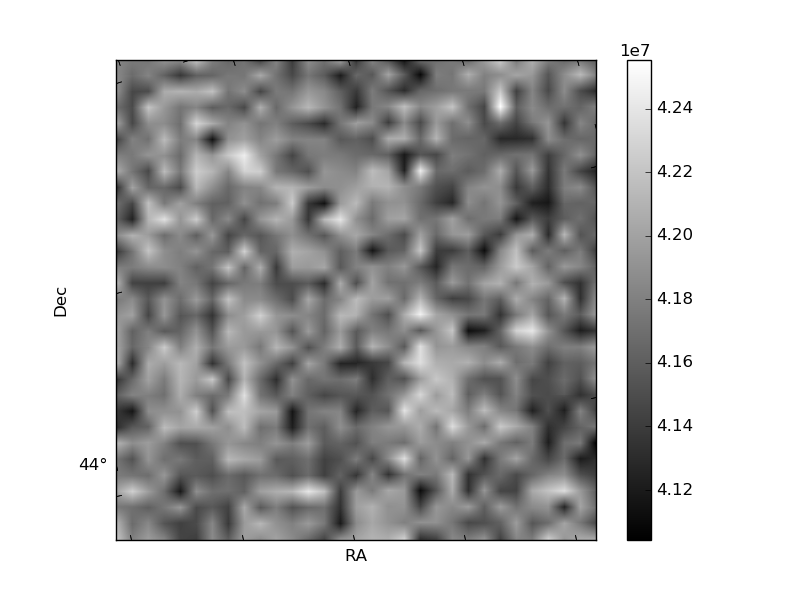
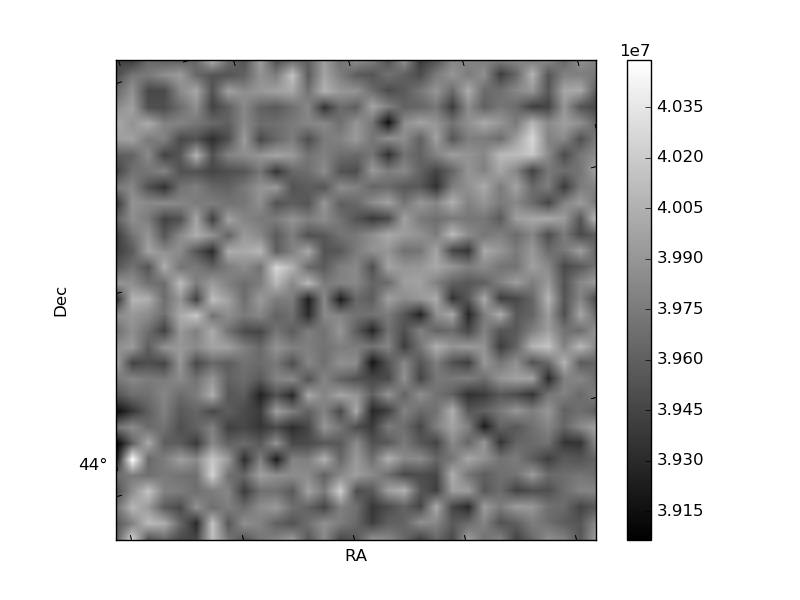
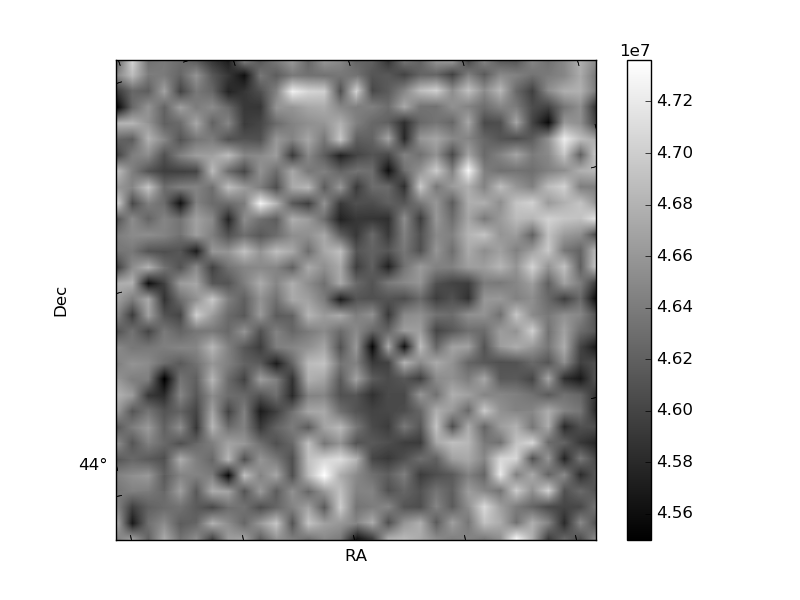
Histogram calculated using DETX and DETY for each event in the final _common_clean file
| Quadrant A | 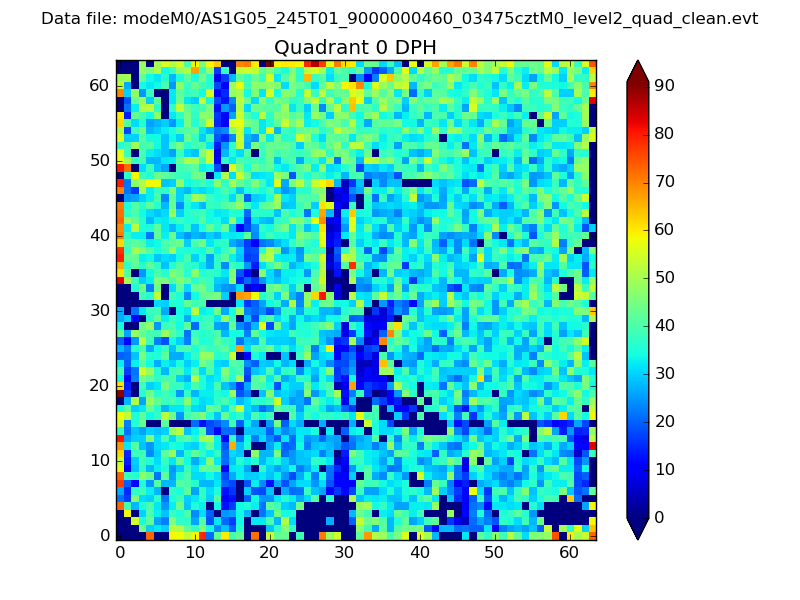 |
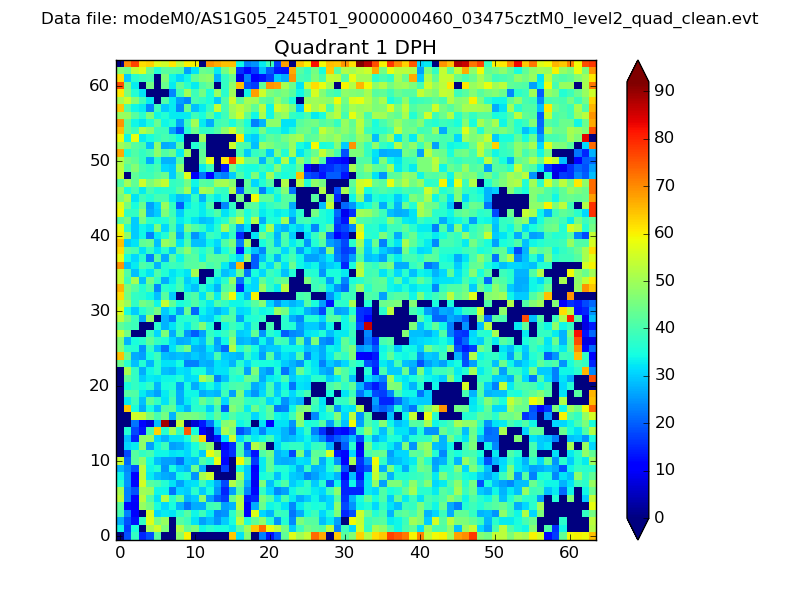 |
Quadrant B |
|---|---|---|---|
| Quadrant D | 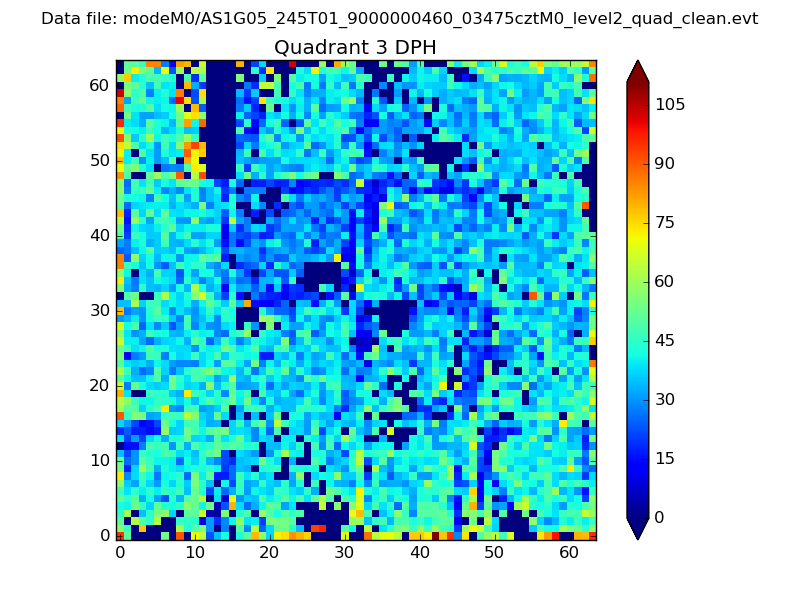 |
 |
Quadrant C |
| Plot type | Count rate plots | Images |
|---|---|---|
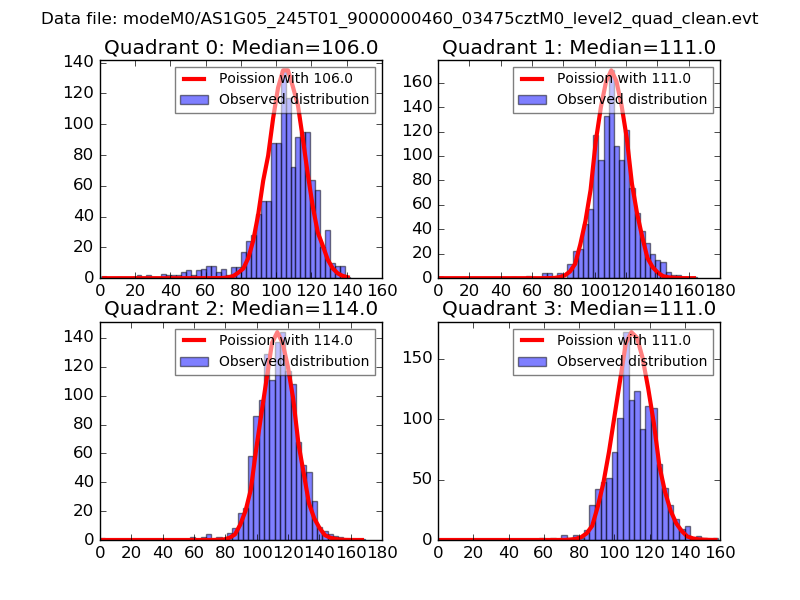
| Comparison with Poisson distribution Blue bars denote a histogram of data divided into 1 sec bins. Red curve is a Poisson curve with rate = median count rate of data. |
 |
 |
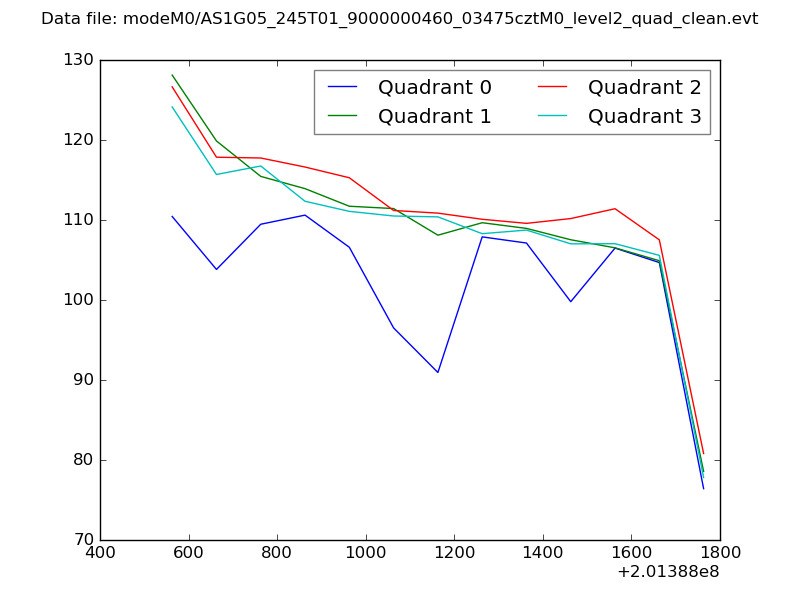
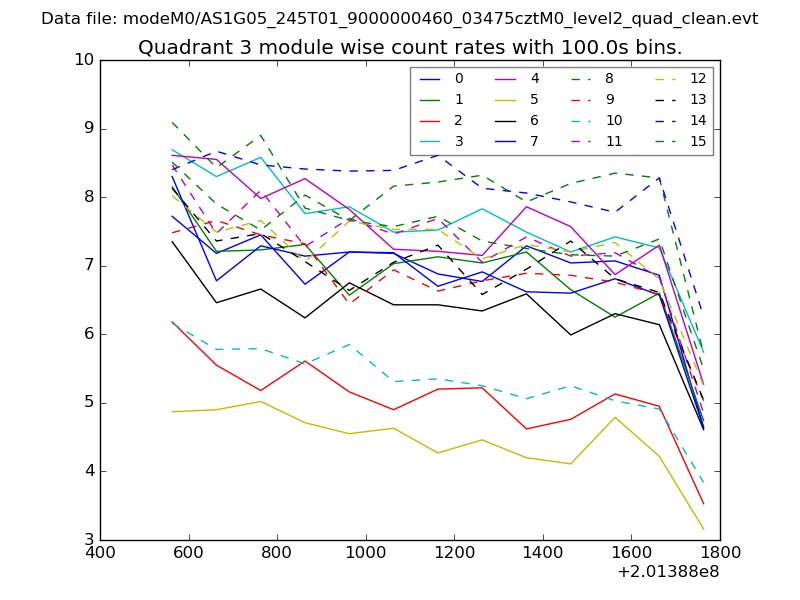
| Quadrant-wise count rates Data is divided into 100 sec bins |
 |
|
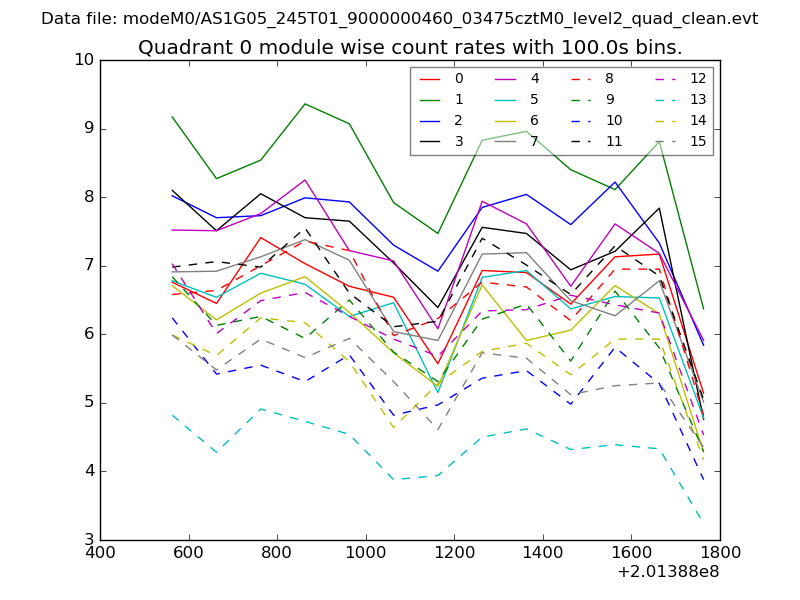
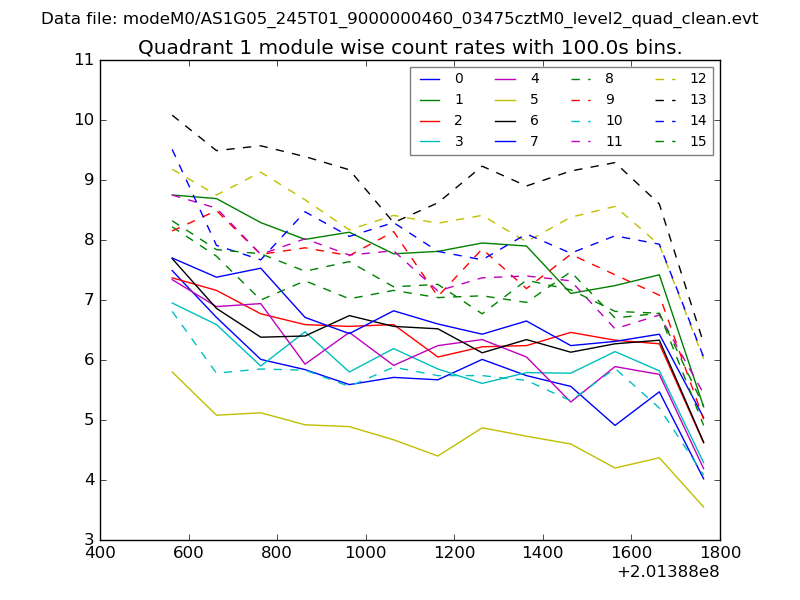
| Module-wise count rates for Quadrant A Data is divided into 100 sec bins |
 |
 |
| Module-wise count rates for Quadrant B Data is divided into 100 sec bins |
 |
 |
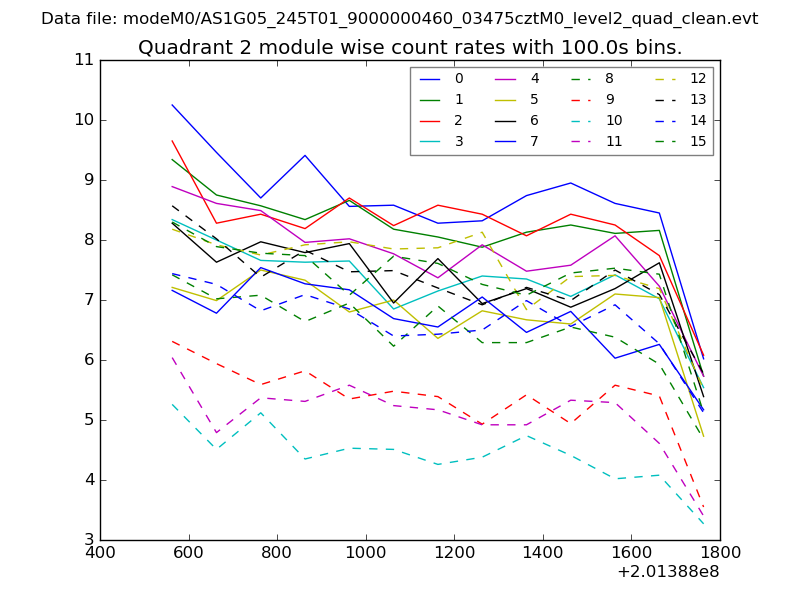
| Module-wise count rates for Quadrant C Data is divided into 100 sec bins |
 |
 |
| Module-wise count rates for Quadrant D Data is divided into 100 sec bins |
 |
 |
| Parameter | Plot |
|---|---|
| CZT HV Monitor | 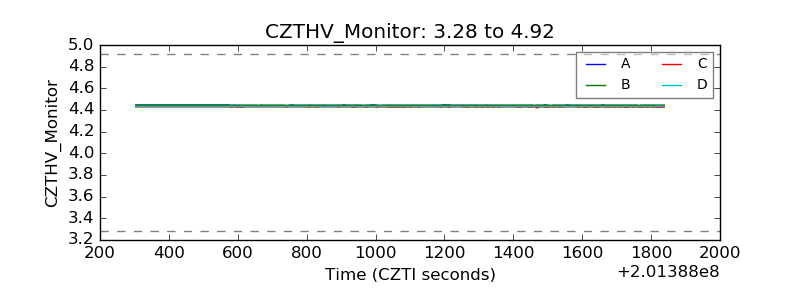 |
| D_VDD | 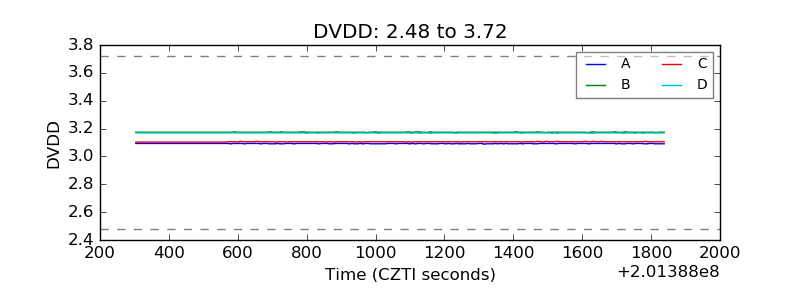 |
| Temperature 1 | 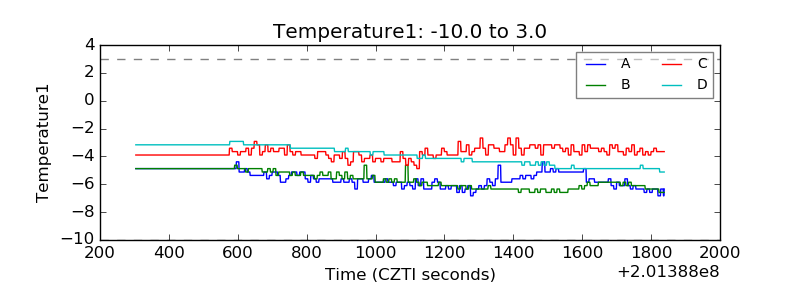 |
| Veto HV Monitor | 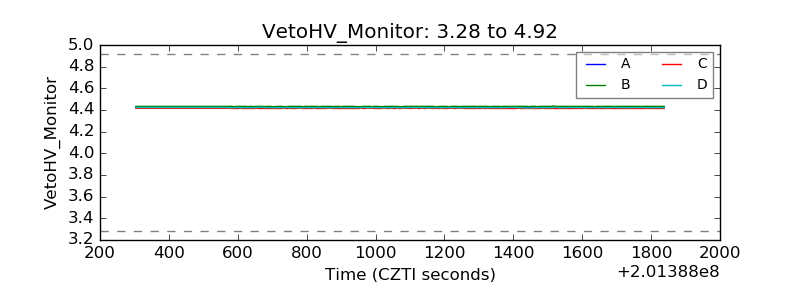 |
| Veto LLD | 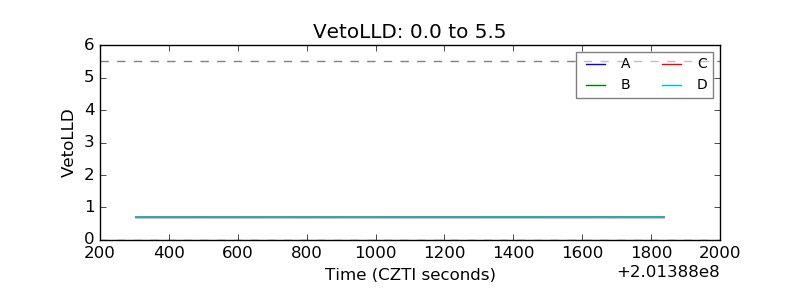 |
| Alpha Counter | 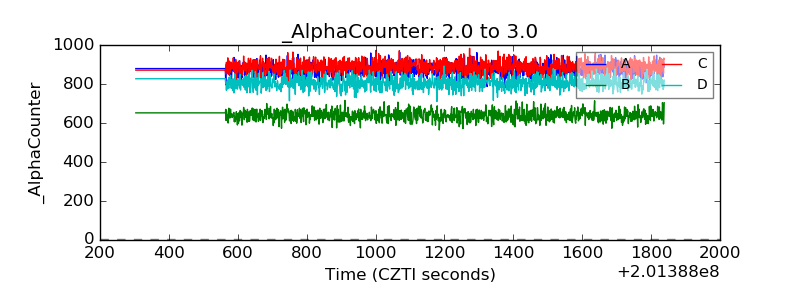 |
| _CPM_Rate | 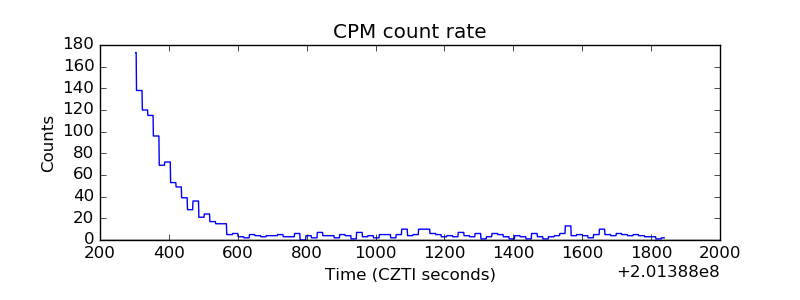 |
| CZT Counter | 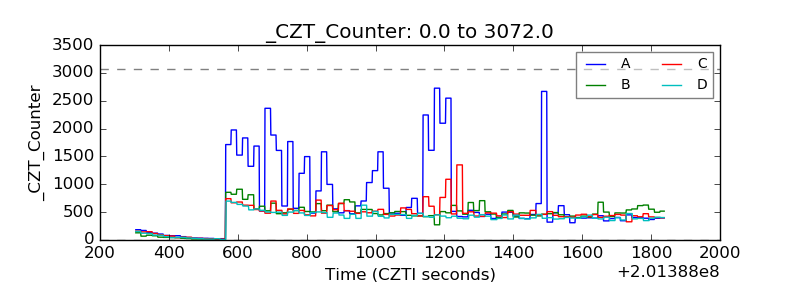 |
| +2.5 Volts monitor |  |
| +5 Volts monitor |  |
| Veto Counter | 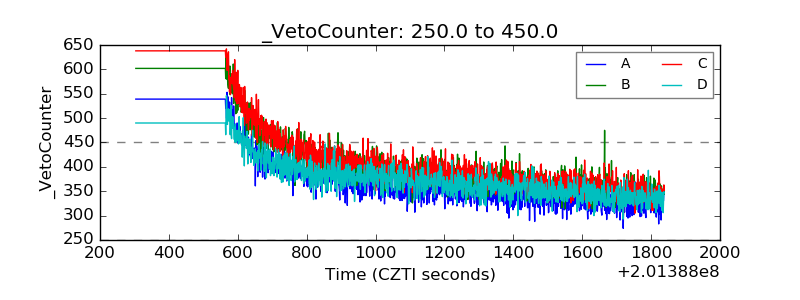 |