| Param | Original file | Final file |
|---|---|---|
| Filename | modeM0/AS1G05_245T01_9000000460_03476cztM0_level2.evt | modeM0/AS1G05_245T01_9000000460_03476cztM0_level2_quad_clean.evt |
| Size (bytes) | 525,867,840 | 81,414,720 |
| Size | 501.5 MB | 77.6 MB |
| Events in quadrant A | 5,339,554 | 475,784 |
| Events in quadrant B | 3,544,344 | 502,706 |
| Events in quadrant C | 3,624,559 | 510,460 |
| Events in quadrant D | 2,951,548 | 497,715 |
| Mode M0 | |||
|---|---|---|---|
| Quadrant | BADHDUFLAG | Total packets | Discarded packets |
| A | 0 | 20713 | 3 |
| B | 0 | 15184 | 2 |
| C | 0 | 15793 | 2 |
| D | 0 | 14164 | 2 |
| Mode SS | |||
|---|---|---|---|
| Quadrant | BADHDUFLAG | Total packets | Discarded packets |
| A | 0 | 140 | 0 |
| B | 0 | 140 | 0 |
| C | 0 | 140 | 0 |
| D | 0 | 140 | 0 |
| Mode M9 | |||
|---|---|---|---|
| Quadrant | BADHDUFLAG | Total packets | Discarded packets |
| A | 0 | 12 | 0 |
| B | 0 | 12 | 0 |
| C | 0 | 12 | 0 |
| D | 0 | 12 | 0 |
| Quadrant | Total seconds | Saturated seconds | Saturation percentage |
|---|---|---|---|
| A | 6864 | 462 | 6.730769% |
| B | 6864 | 41 | 0.597319% |
| C | 6864 | 144 | 2.097902% |
| D | 6864 | 18 | 0.262238% |
Noise dominated data is calculated using 1-second bins in cleaned event files. If a bin has >2000 counts, and if more than 50% of those come from <1% of pixels, then it is considered to be noise-dominated and hence unusable.
| Quadrant | # 1 sec bins | Bins with >0 counts | Bins with >2000 counts | High rate bins dominated by noise | Noise dominated (total time) | Noise dominated (detector-on time) | Marked lightcurve |
|---|---|---|---|---|---|---|---|
| A | 7749 | 6865 | 257 | 257 | 3.32% | 3.74% | 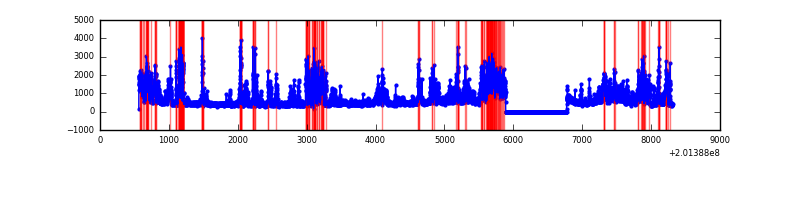 |
| B | 7749 | 6865 | 5 | 5 | 0.06% | 0.07% | 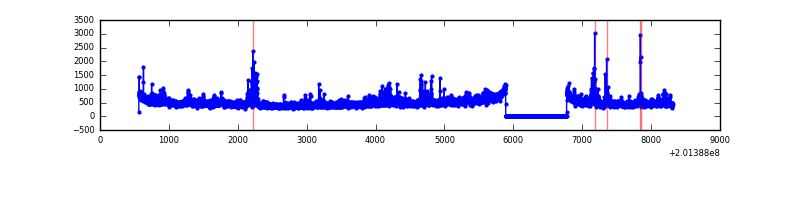 |
| C | 7749 | 6865 | 89 | 89 | 1.15% | 1.30% | 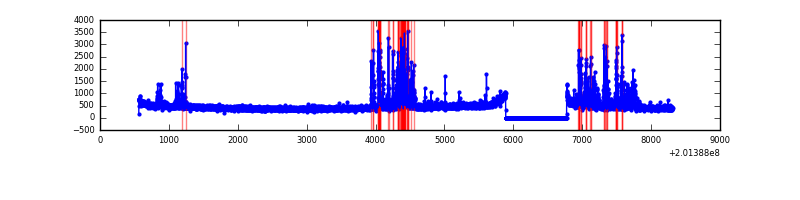 |
| D | 7749 | 6865 | 7 | 7 | 0.09% | 0.10% | 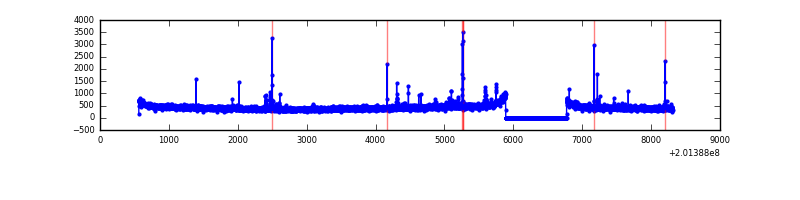 |
Top three noisy pixels from each quadrant. If the there are fewer than three noisy pixels in the level2.evt file, extra rows are filled as -1
| Pixel properties | Quadrant properties | ||||||
|---|---|---|---|---|---|---|---|
| Quadrant | DetID | PixID | Counts | Sigma | Mean | Median | Sigma |
| A | 0 | 118 | 1591568 | 10247.63 | 753 | 736 | 155.2 |
| A | 0 | 50 | 637771 | 4103.58 | 753 | 736 | 155.2 |
| A | 0 | 226 | 152546 | 977.91 | 753 | 736 | 155.2 |
| B | 15 | 204 | 259516 | 1693.99 | 786 | 768 | 152.7 |
| B | 2 | 249 | 133763 | 870.7 | 786 | 768 | 152.7 |
| B | 4 | 200 | 37548 | 240.79 | 786 | 768 | 152.7 |
| C | 7 | 220 | 640670 | 3602.38 | 759 | 763 | 177.6 |
| C | 1 | 192 | 6676 | 33.29 | 759 | 763 | 177.6 |
| C | 13 | 61 | 6369 | 31.56 | 759 | 763 | 177.6 |
| D | 13 | 223 | 22226 | 119.4 | 754 | 733 | 180.0 |
| D | 13 | 239 | 21509 | 115.41 | 754 | 733 | 180.0 |
| D | 8 | 195 | 14098 | 74.24 | 754 | 733 | 180.0 |
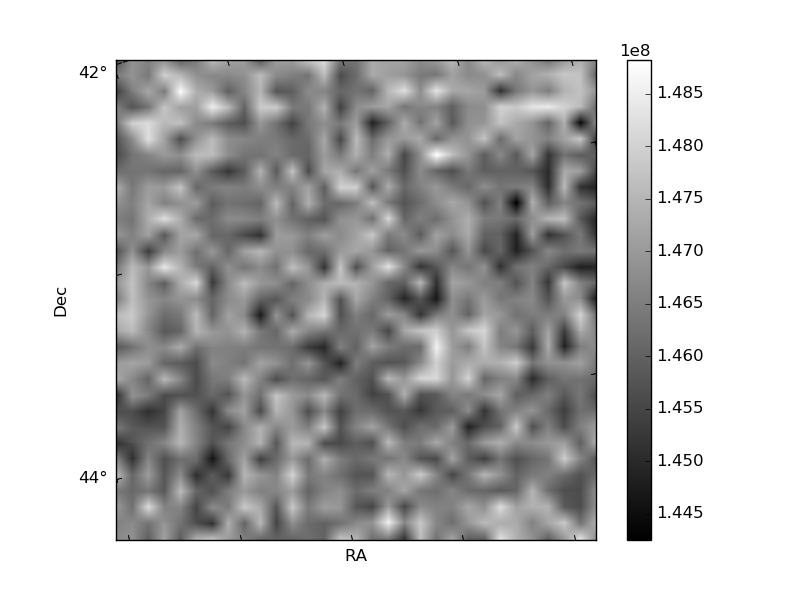
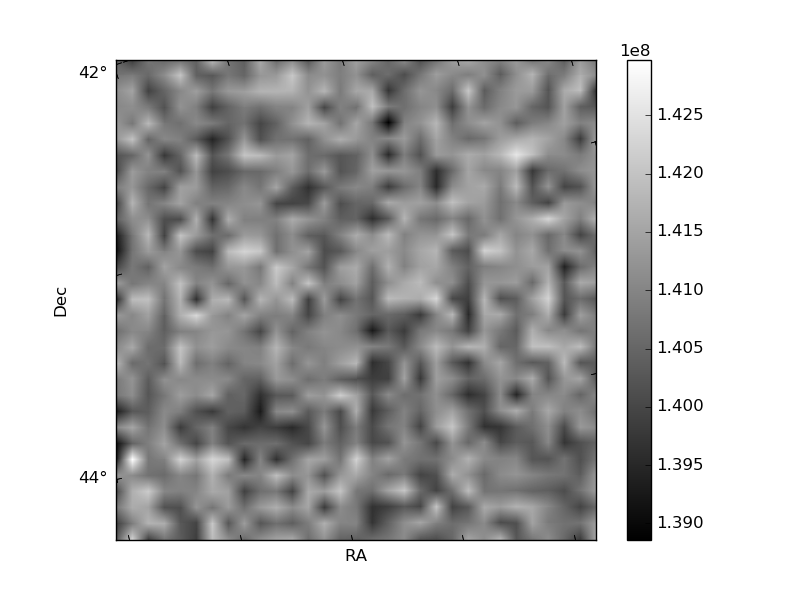
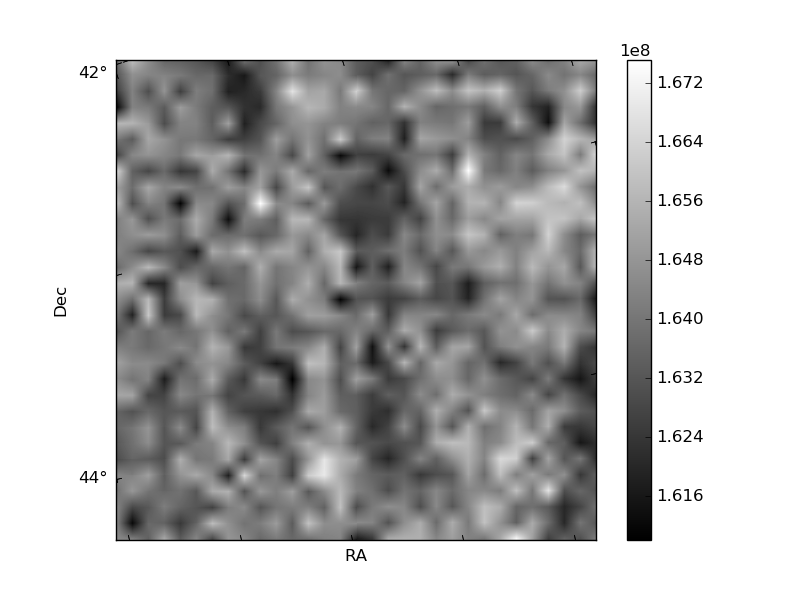
Histogram calculated using DETX and DETY for each event in the final _common_clean file
| Quadrant A | 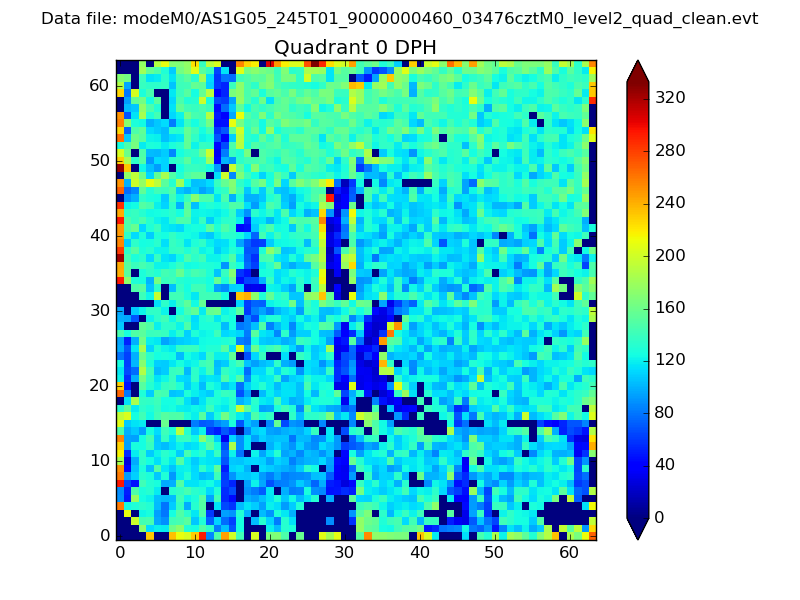 |
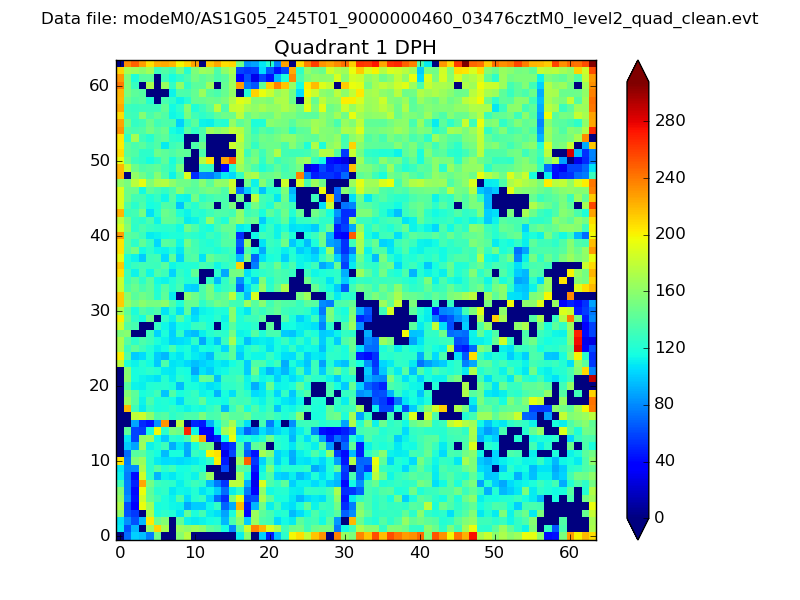 |
Quadrant B |
|---|---|---|---|
| Quadrant D | 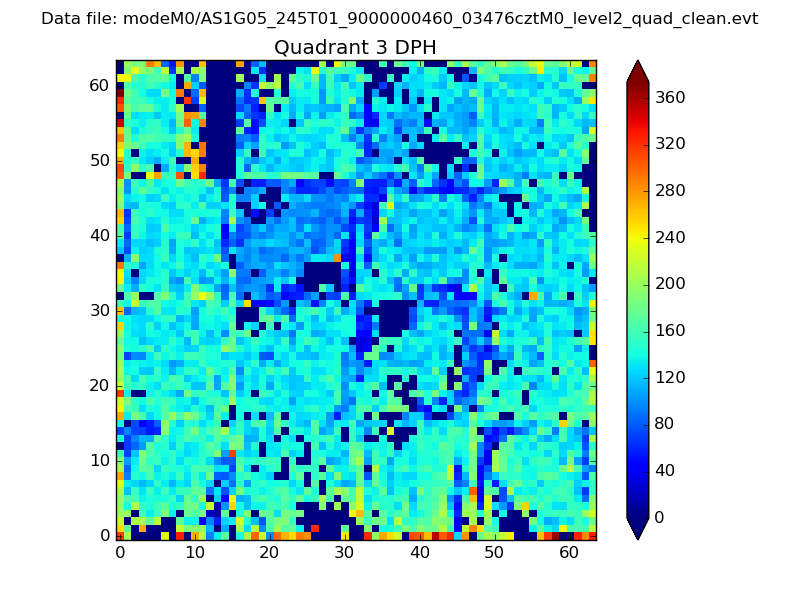 |
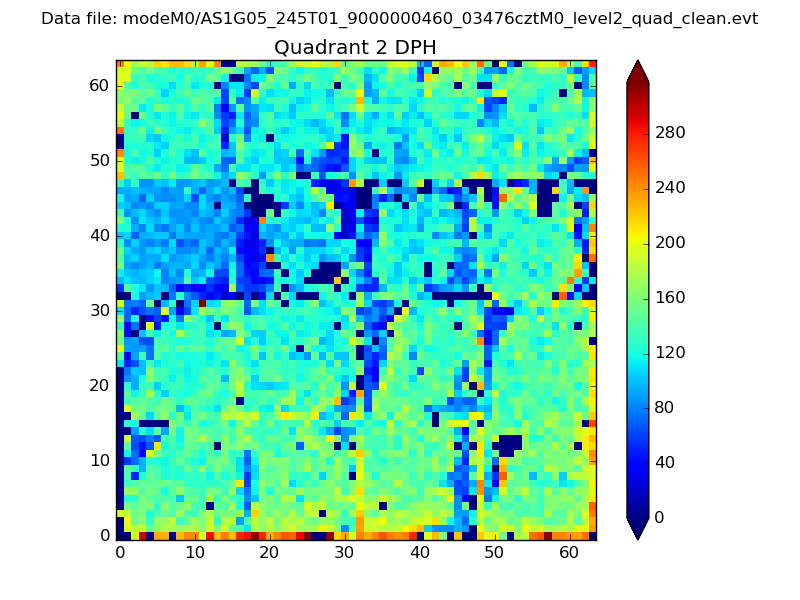 |
Quadrant C |
| Plot type | Count rate plots | Images |
|---|---|---|
| Comparison with Poisson distribution Blue bars denote a histogram of data divided into 1 sec bins. Red curve is a Poisson curve with rate = median count rate of data. |
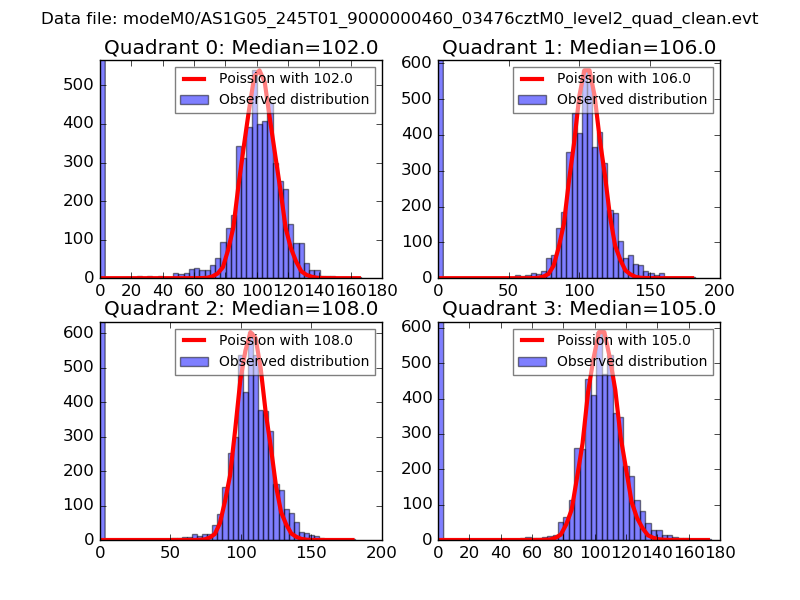 |
 |
| Quadrant-wise count rates Data is divided into 100 sec bins |
 |
|
| Module-wise count rates for Quadrant A Data is divided into 100 sec bins |
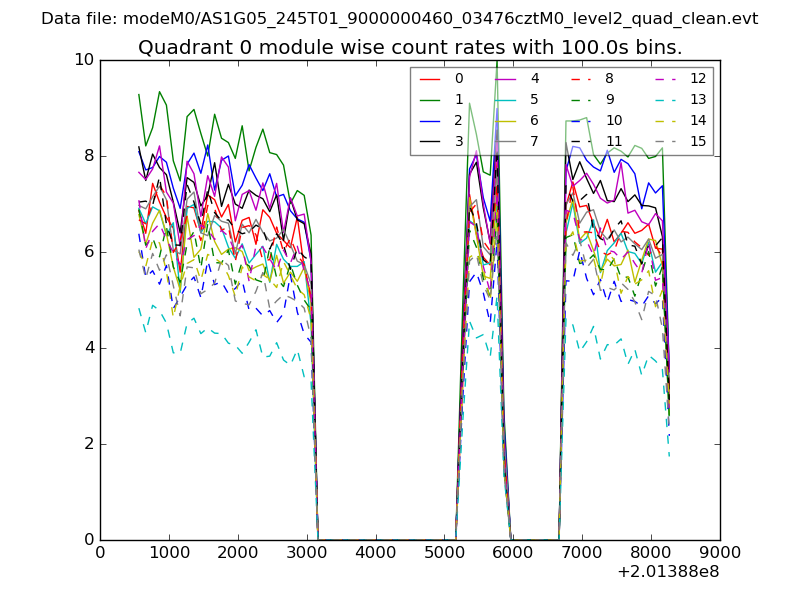 |
 |
| Module-wise count rates for Quadrant B Data is divided into 100 sec bins |
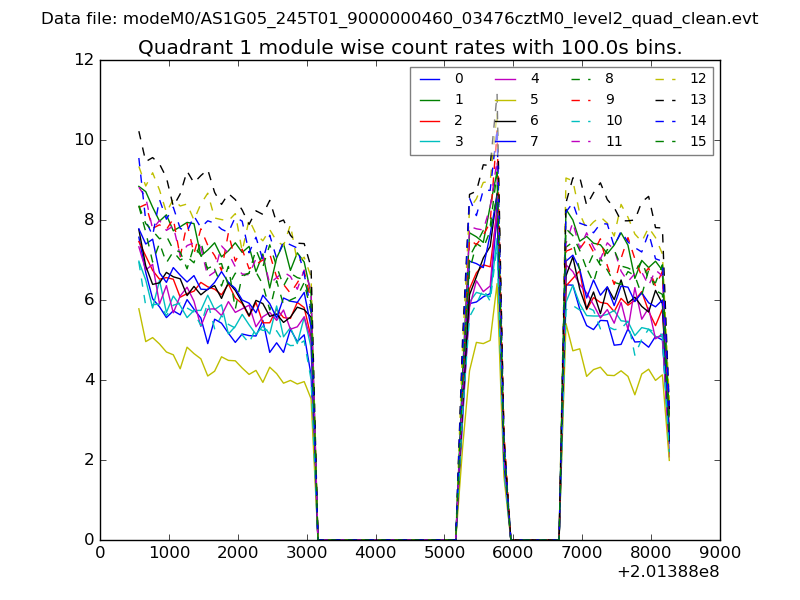 |
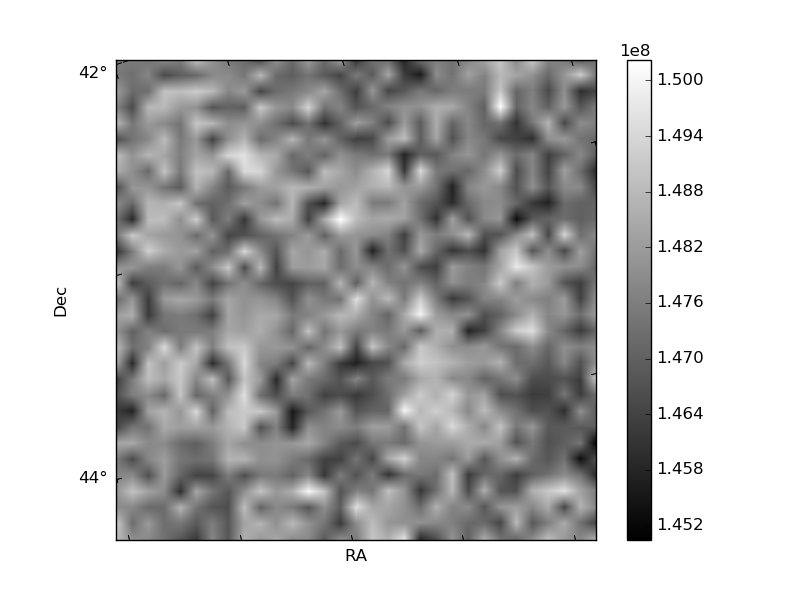 |
| Module-wise count rates for Quadrant C Data is divided into 100 sec bins |
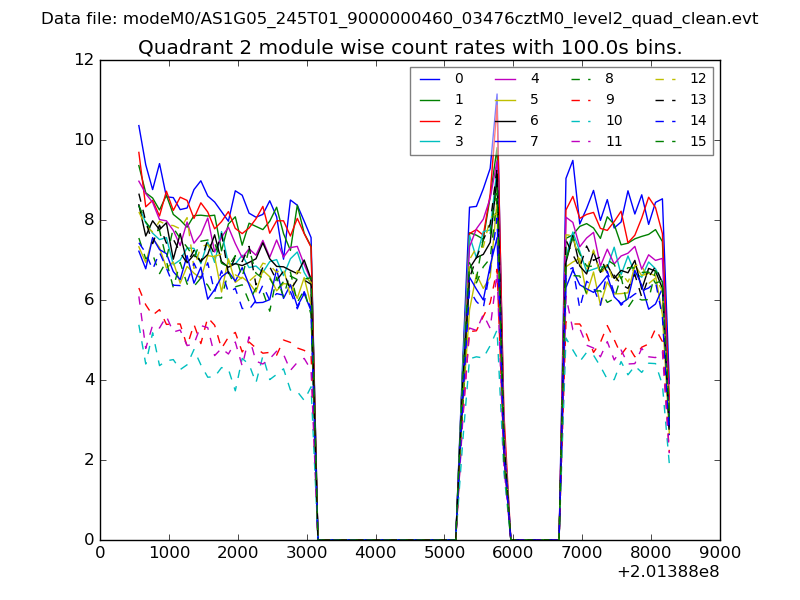 |
 |
| Module-wise count rates for Quadrant D Data is divided into 100 sec bins |
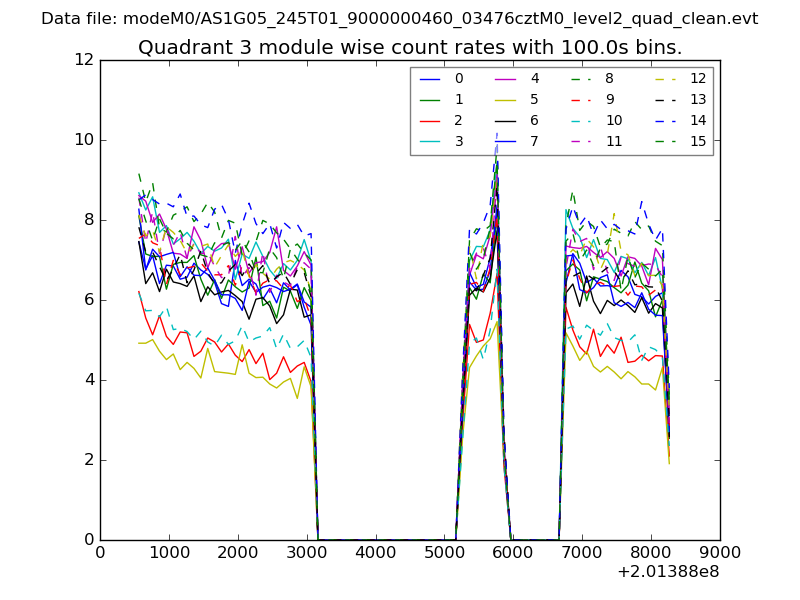 |
 |
| Parameter | Plot |
|---|---|
| CZT HV Monitor | 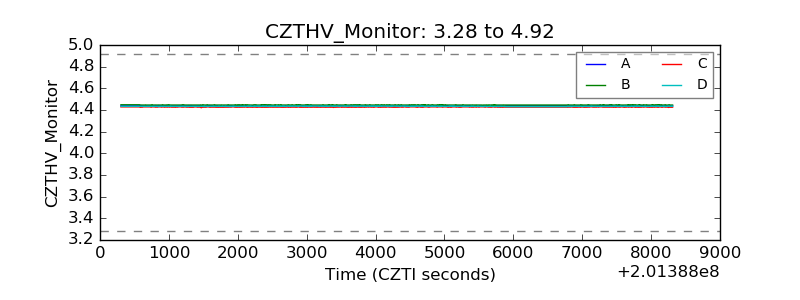 |
| D_VDD |  |
| Temperature 1 | 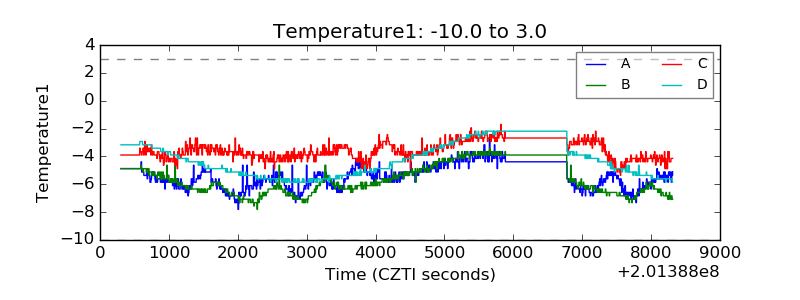 |
| Veto HV Monitor |  |
| Veto LLD | 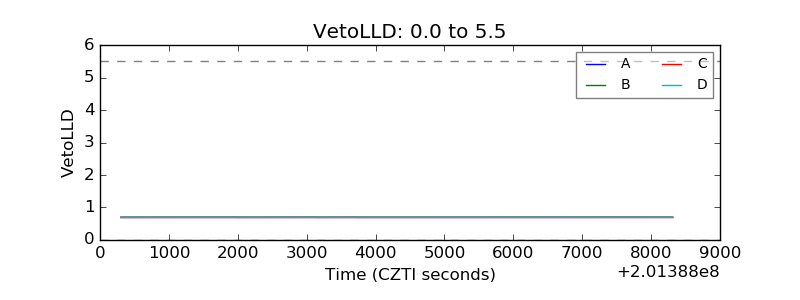 |
| Alpha Counter | 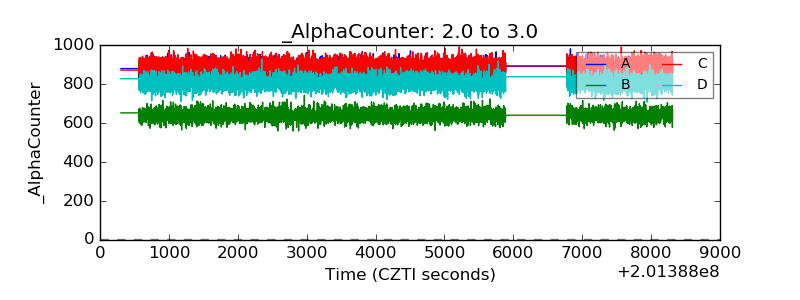 |
| _CPM_Rate | 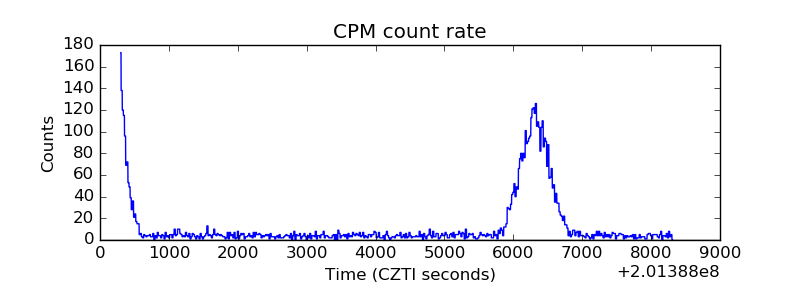 |
| CZT Counter | 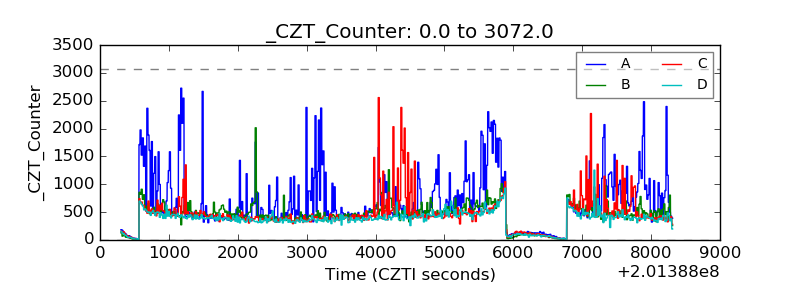 |
| +2.5 Volts monitor |  |
| +5 Volts monitor |  |
| Veto Counter | 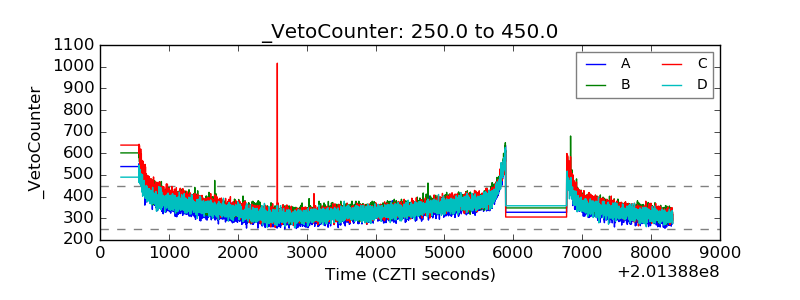 |