| Param | Original file | Final file |
|---|---|---|
| Filename | modeM0/AS1G05_245T01_9000000460_03477cztM0_level2.evt | modeM0/AS1G05_245T01_9000000460_03477cztM0_level2_quad_clean.evt |
| Size (bytes) | 541,512,000 | 83,373,120 |
| Size | 516.4 MB | 79.5 MB |
| Events in quadrant A | 4,560,127 | 499,205 |
| Events in quadrant B | 3,957,456 | 510,107 |
| Events in quadrant C | 4,174,531 | 508,524 |
| Events in quadrant D | 3,211,536 | 497,742 |
| Mode M0 | |||
|---|---|---|---|
| Quadrant | BADHDUFLAG | Total packets | Discarded packets |
| A | 0 | 18652 | 4 |
| B | 0 | 16644 | 3 |
| C | 0 | 17715 | 3 |
| D | 0 | 15258 | 3 |
| Mode SS | |||
|---|---|---|---|
| Quadrant | BADHDUFLAG | Total packets | Discarded packets |
| A | 0 | 150 | 0 |
| B | 0 | 150 | 0 |
| C | 0 | 150 | 0 |
| D | 0 | 150 | 0 |
| Mode M9 | |||
|---|---|---|---|
| Quadrant | BADHDUFLAG | Total packets | Discarded packets |
| A | 0 | 13 | 0 |
| B | 0 | 13 | 0 |
| C | 0 | 13 | 0 |
| D | 0 | 13 | 0 |
| Quadrant | Total seconds | Saturated seconds | Saturation percentage |
|---|---|---|---|
| A | 7312 | 159 | 2.174508% |
| B | 7312 | 115 | 1.572757% |
| C | 7312 | 177 | 2.420678% |
| D | 7312 | 28 | 0.382932% |
Noise dominated data is calculated using 1-second bins in cleaned event files. If a bin has >2000 counts, and if more than 50% of those come from <1% of pixels, then it is considered to be noise-dominated and hence unusable.
| Quadrant | # 1 sec bins | Bins with >0 counts | Bins with >2000 counts | High rate bins dominated by noise | Noise dominated (total time) | Noise dominated (detector-on time) | Marked lightcurve |
|---|---|---|---|---|---|---|---|
| A | 8592 | 7315 | 96 | 96 | 1.12% | 1.31% | 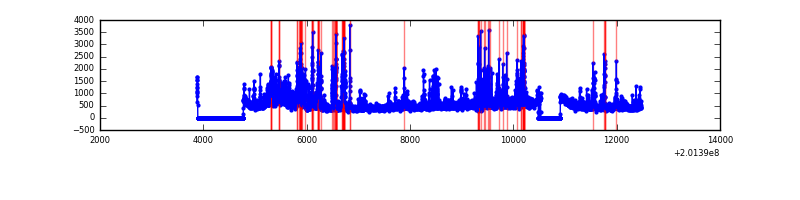 |
| B | 8592 | 7315 | 30 | 30 | 0.35% | 0.41% | 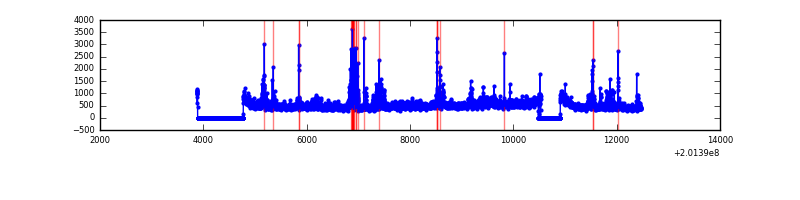 |
| C | 8592 | 7315 | 128 | 128 | 1.49% | 1.75% | 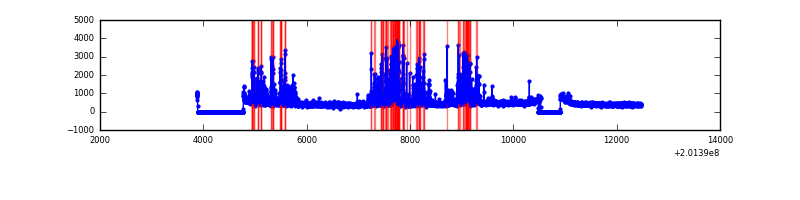 |
| D | 8592 | 7315 | 13 | 13 | 0.15% | 0.18% | 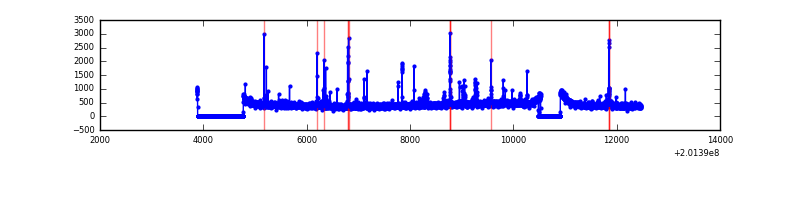 |
Top three noisy pixels from each quadrant. If the there are fewer than three noisy pixels in the level2.evt file, extra rows are filled as -1
| Pixel properties | Quadrant properties | ||||||
|---|---|---|---|---|---|---|---|
| Quadrant | DetID | PixID | Counts | Sigma | Mean | Median | Sigma |
| A | 0 | 118 | 919931 | 5448.22 | 817 | 796 | 168.7 |
| A | 0 | 50 | 315068 | 1862.86 | 817 | 796 | 168.7 |
| A | 0 | 226 | 91140 | 535.52 | 817 | 796 | 168.7 |
| B | 2 | 249 | 271217 | 1661.97 | 836 | 814 | 162.7 |
| B | 15 | 204 | 253098 | 1550.61 | 836 | 814 | 162.7 |
| B | 3 | 0 | 108236 | 660.24 | 836 | 814 | 162.7 |
| C | 7 | 220 | 927162 | 4912.2 | 806 | 811 | 188.6 |
| C | 6 | 80 | 72614 | 380.75 | 806 | 811 | 188.6 |
| C | 1 | 192 | 11696 | 57.72 | 806 | 811 | 188.6 |
| D | 2 | 31 | 34200 | 172.73 | 802 | 778 | 193.5 |
| D | 13 | 223 | 31274 | 157.61 | 802 | 778 | 193.5 |
| D | 13 | 239 | 28190 | 141.67 | 802 | 778 | 193.5 |
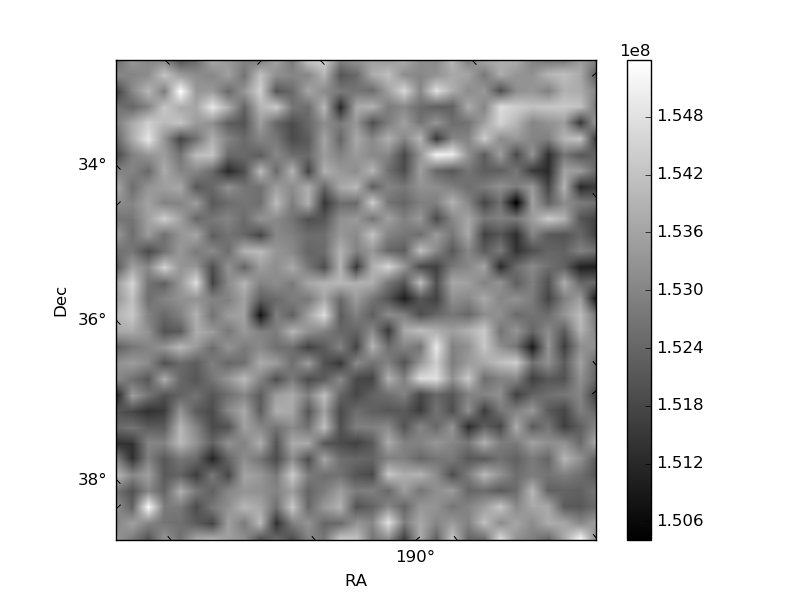
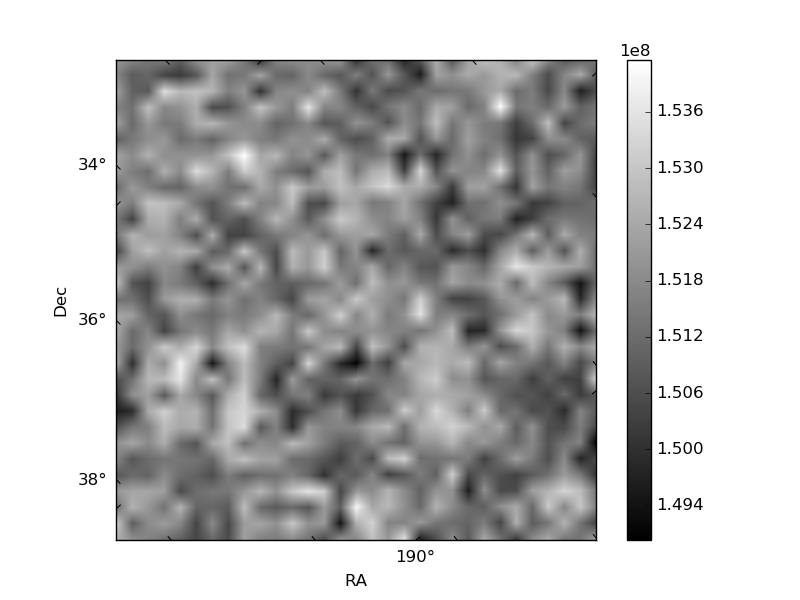
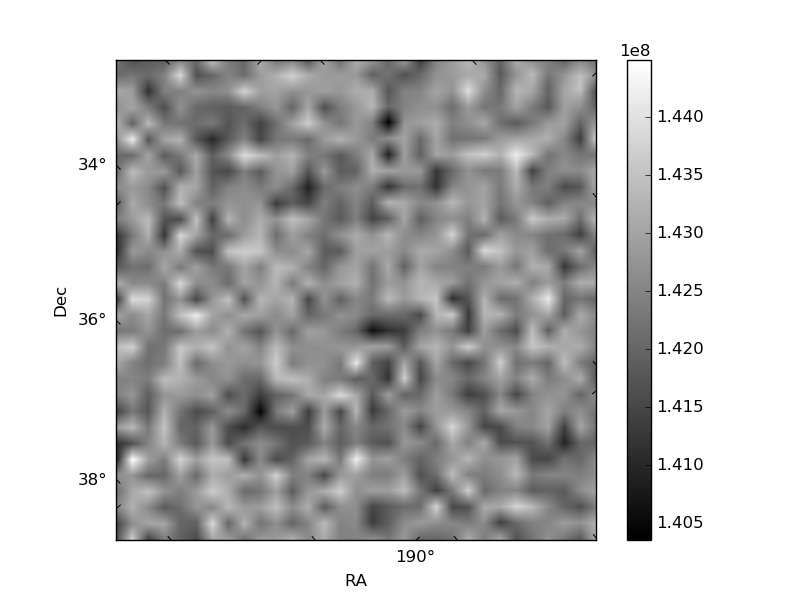
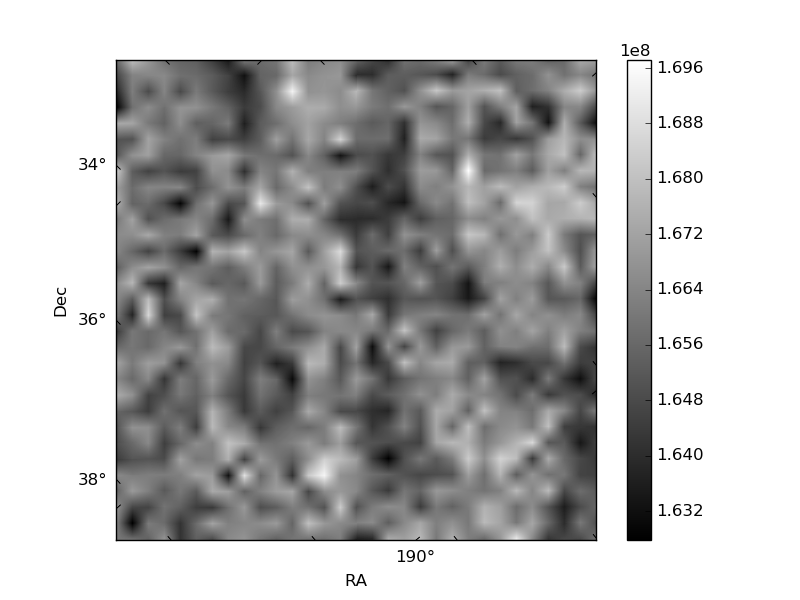
Histogram calculated using DETX and DETY for each event in the final _common_clean file
| Quadrant A | 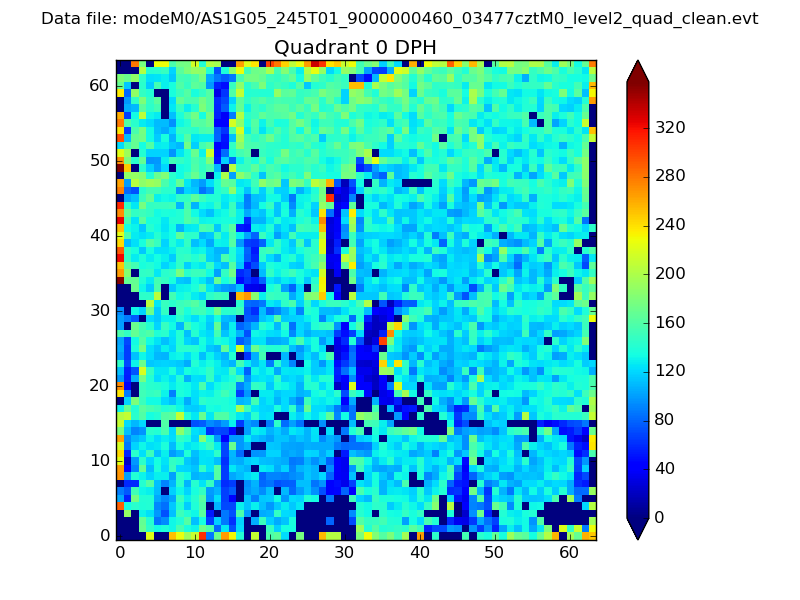 |
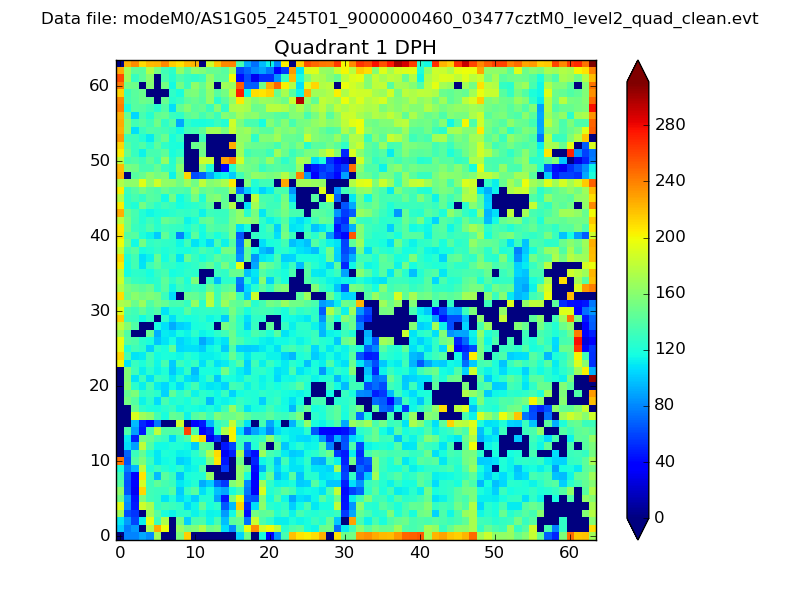 |
Quadrant B |
|---|---|---|---|
| Quadrant D | 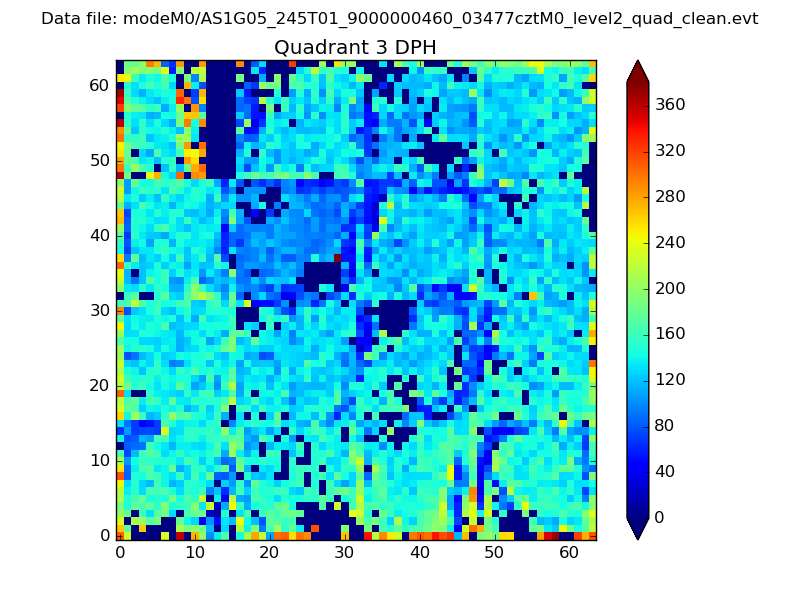 |
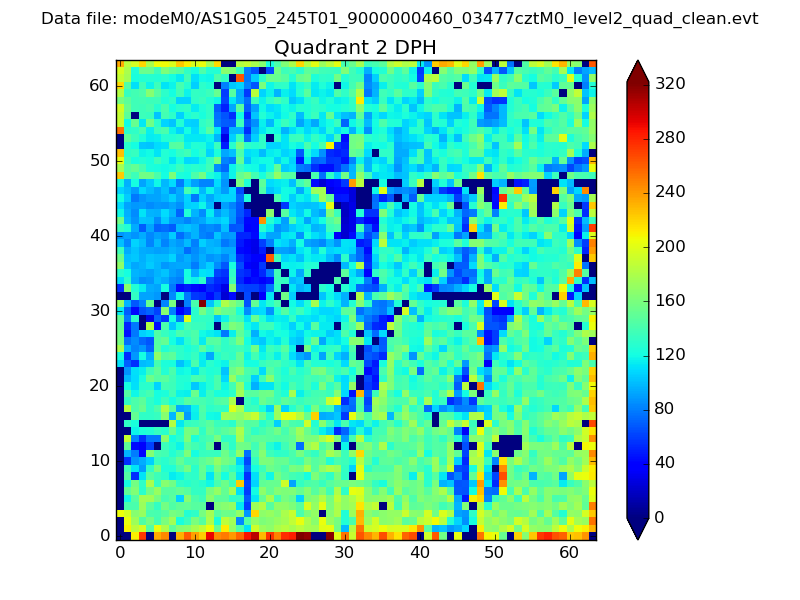 |
Quadrant C |
| Plot type | Count rate plots | Images |
|---|---|---|
| Comparison with Poisson distribution Blue bars denote a histogram of data divided into 1 sec bins. Red curve is a Poisson curve with rate = median count rate of data. |
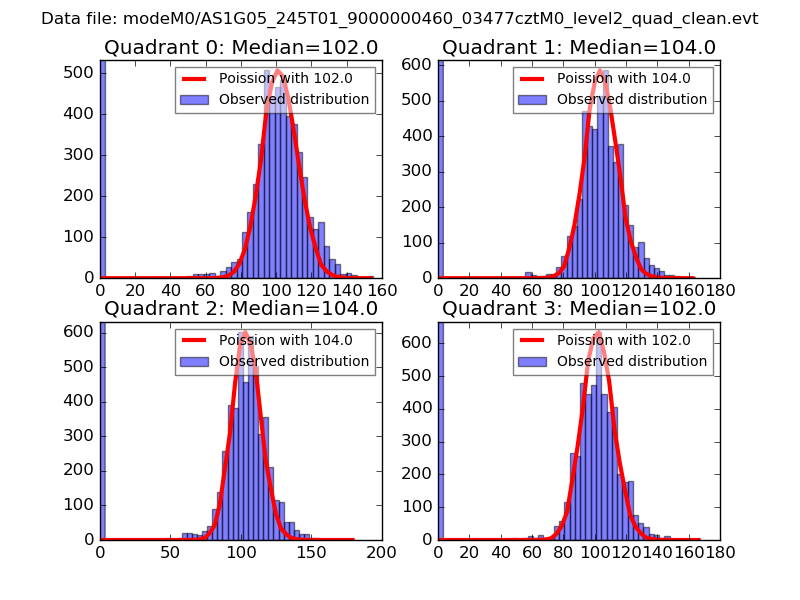 |
 |
| Quadrant-wise count rates Data is divided into 100 sec bins |
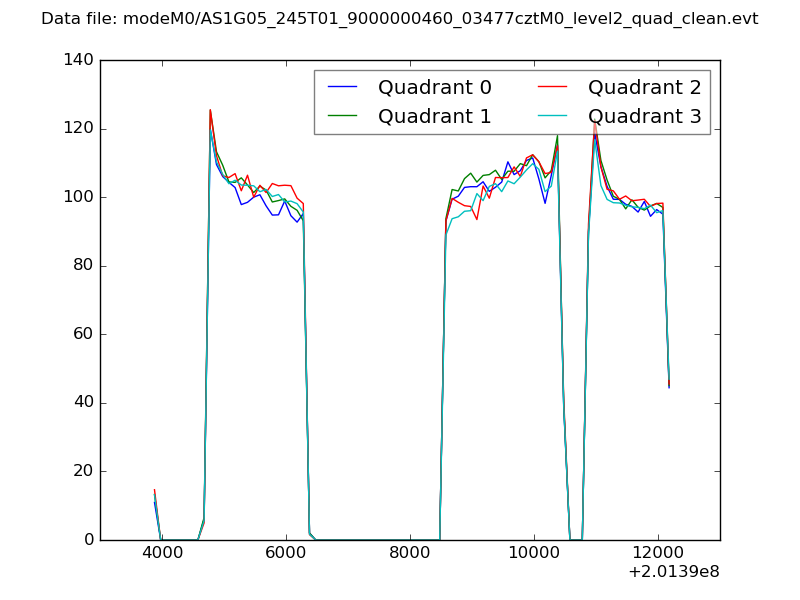 |
|
| Module-wise count rates for Quadrant A Data is divided into 100 sec bins |
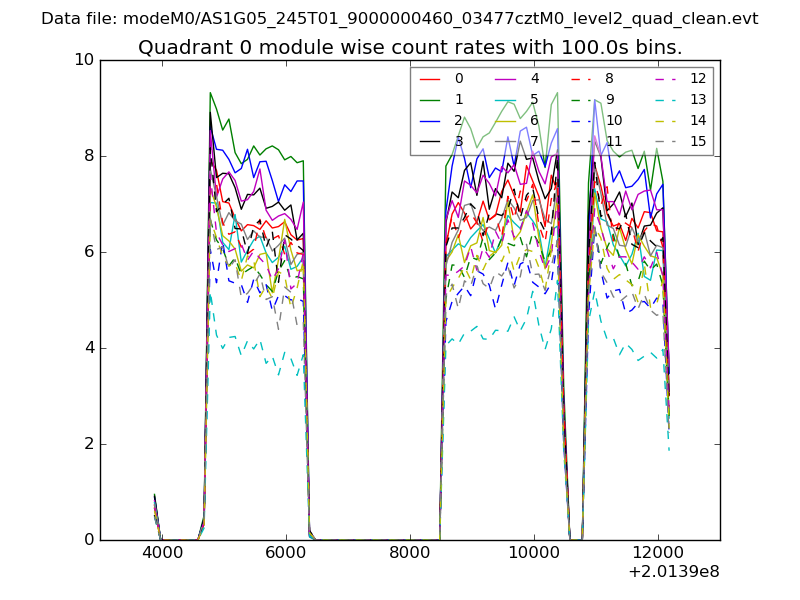 |
 |
| Module-wise count rates for Quadrant B Data is divided into 100 sec bins |
 |
 |
| Module-wise count rates for Quadrant C Data is divided into 100 sec bins |
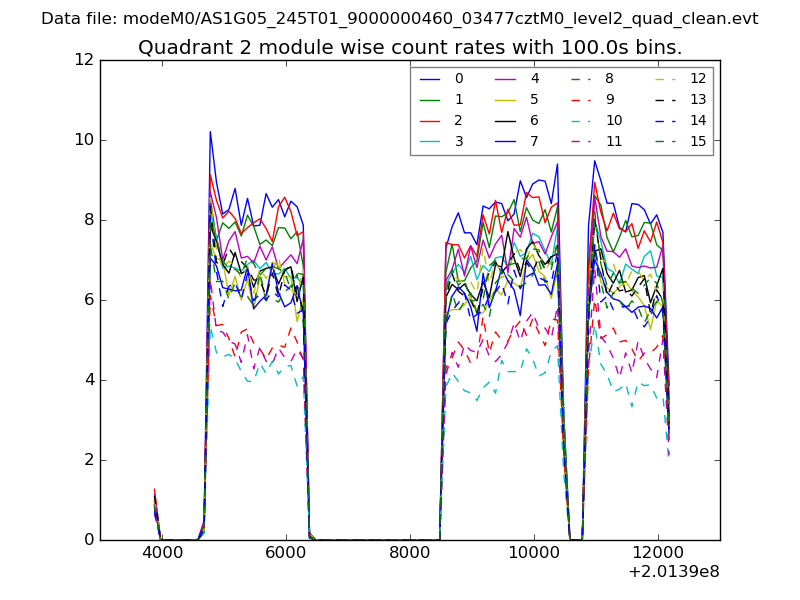 |
 |
| Module-wise count rates for Quadrant D Data is divided into 100 sec bins |
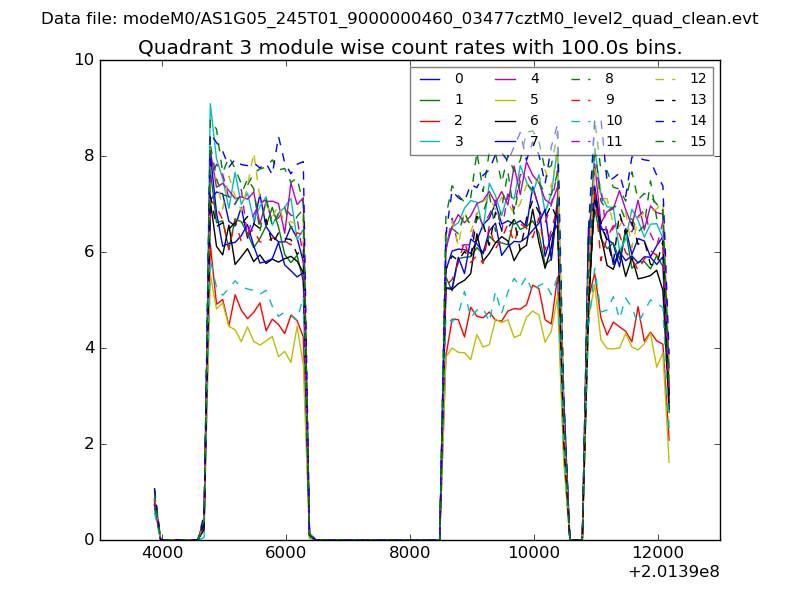 |
 |
| Parameter | Plot |
|---|---|
| CZT HV Monitor | 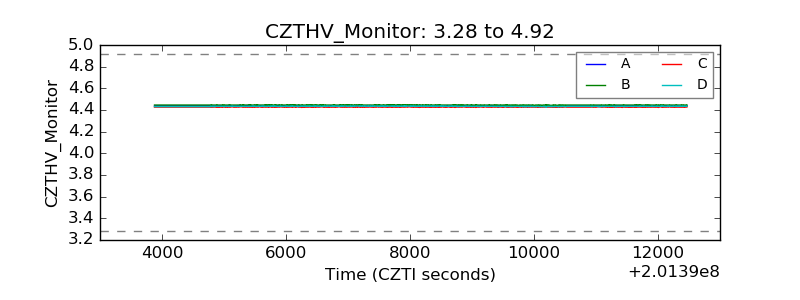 |
| D_VDD | 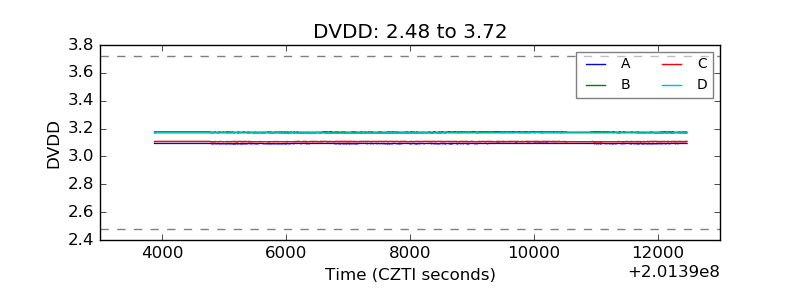 |
| Temperature 1 | 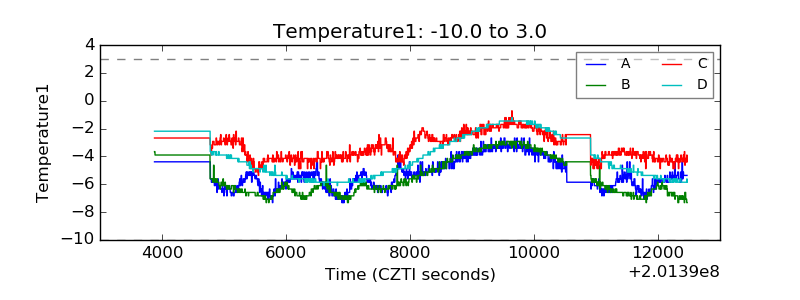 |
| Veto HV Monitor | 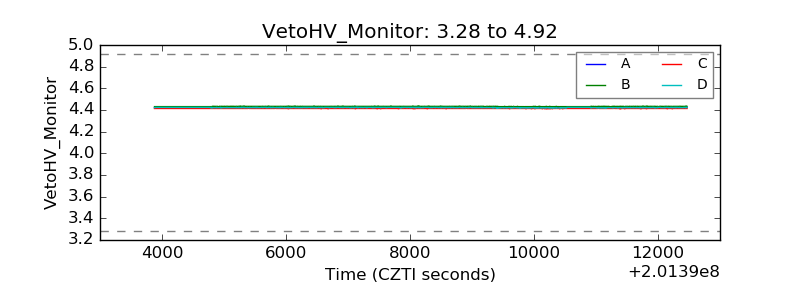 |
| Veto LLD | 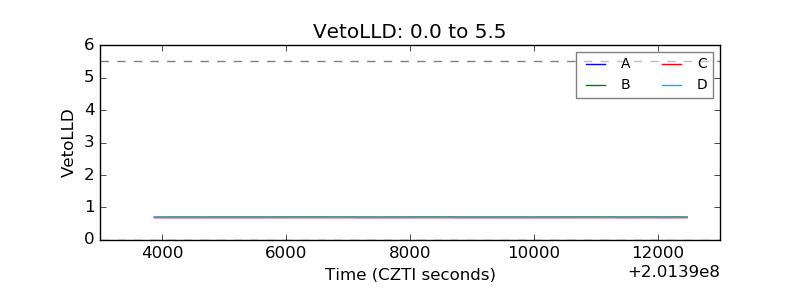 |
| Alpha Counter | 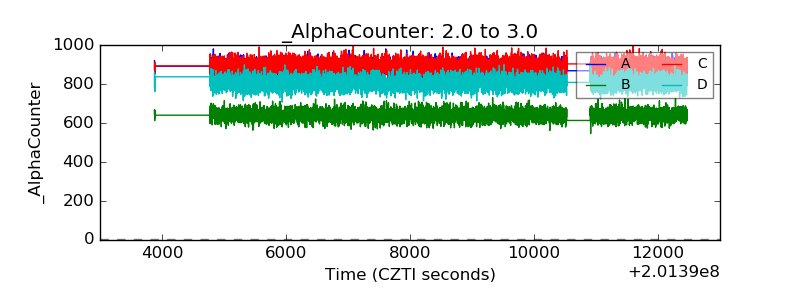 |
| _CPM_Rate | 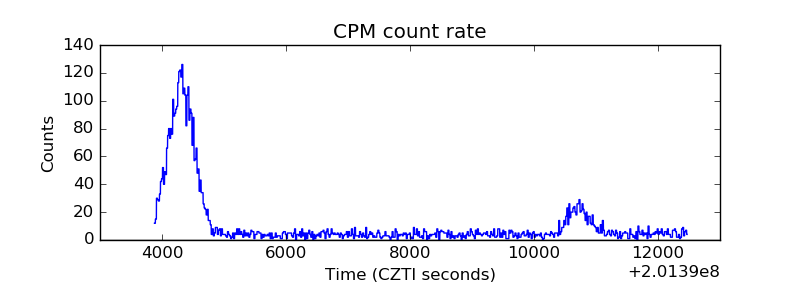 |
| CZT Counter | 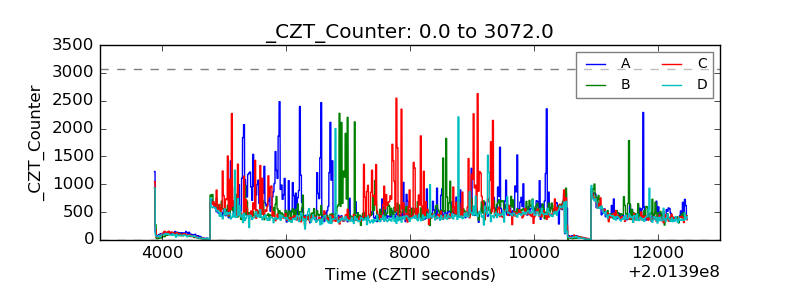 |
| +2.5 Volts monitor |  |
| +5 Volts monitor |  |
| Veto Counter | 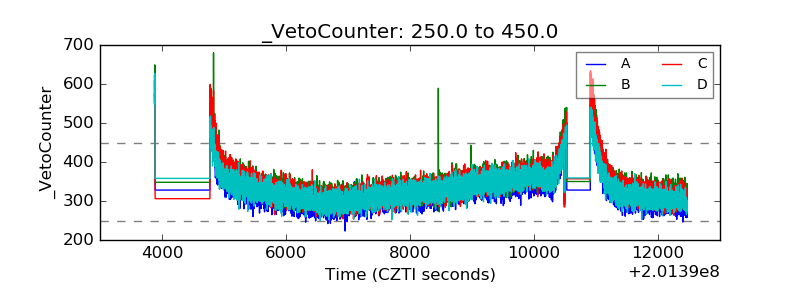 |