| Param | Original file | Final file |
|---|---|---|
| Filename | modeM0/AS1G05_245T01_9000000460_03478cztM0_level2.evt | modeM0/AS1G05_245T01_9000000460_03478cztM0_level2_quad_clean.evt |
| Size (bytes) | 608,803,200 | 102,254,400 |
| Size | 580.6 MB | 97.5 MB |
| Events in quadrant A | 5,028,399 | 619,341 |
| Events in quadrant B | 4,731,055 | 627,070 |
| Events in quadrant C | 4,060,849 | 626,414 |
| Events in quadrant D | 4,015,930 | 608,234 |
| Mode M0 | |||
|---|---|---|---|
| Quadrant | BADHDUFLAG | Total packets | Discarded packets |
| A | 0 | 21082 | 4 |
| B | 0 | 20129 | 3 |
| C | 0 | 18565 | 3 |
| D | 0 | 18796 | 3 |
| Mode SS | |||
|---|---|---|---|
| Quadrant | BADHDUFLAG | Total packets | Discarded packets |
| A | 0 | 180 | 0 |
| B | 0 | 180 | 0 |
| C | 0 | 180 | 0 |
| D | 0 | 180 | 0 |
| Mode M9 | |||
|---|---|---|---|
| Quadrant | BADHDUFLAG | Total packets | Discarded packets |
| A | 0 | 4 | 0 |
| B | 0 | 4 | 0 |
| C | 0 | 4 | 0 |
| D | 0 | 4 | 0 |
| Quadrant | Total seconds | Saturated seconds | Saturation percentage |
|---|---|---|---|
| A | 8862 | 209 | 2.358384% |
| B | 8862 | 171 | 1.929587% |
| C | 8862 | 48 | 0.541638% |
| D | 8862 | 39 | 0.440081% |
Noise dominated data is calculated using 1-second bins in cleaned event files. If a bin has >2000 counts, and if more than 50% of those come from <1% of pixels, then it is considered to be noise-dominated and hence unusable.
| Quadrant | # 1 sec bins | Bins with >0 counts | Bins with >2000 counts | High rate bins dominated by noise | Noise dominated (total time) | Noise dominated (detector-on time) | Marked lightcurve |
|---|---|---|---|---|---|---|---|
| A | 9272 | 8865 | 60 | 60 | 0.65% | 0.68% | 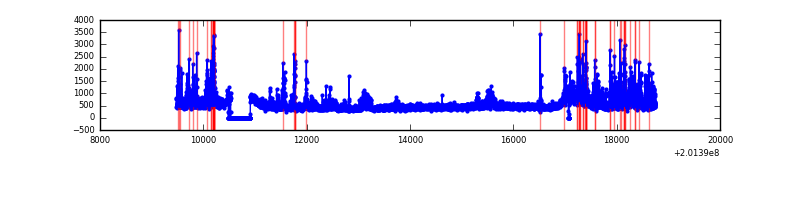 |
| B | 9272 | 8865 | 23 | 23 | 0.25% | 0.26% | 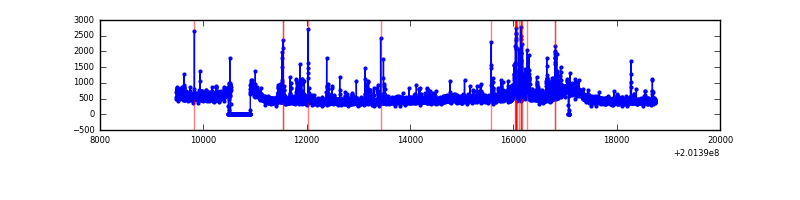 |
| C | 9272 | 8865 | 6 | 6 | 0.06% | 0.07% | 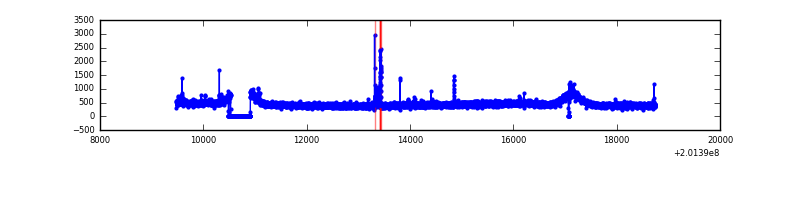 |
| D | 9272 | 8865 | 19 | 19 | 0.20% | 0.21% | 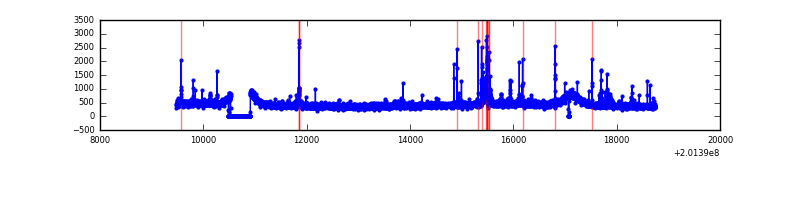 |
Top three noisy pixels from each quadrant. If the there are fewer than three noisy pixels in the level2.evt file, extra rows are filled as -1
| Pixel properties | Quadrant properties | ||||||
|---|---|---|---|---|---|---|---|
| Quadrant | DetID | PixID | Counts | Sigma | Mean | Median | Sigma |
| A | 0 | 118 | 680599 | 3185.81 | 1025 | 1003 | 213.3 |
| A | 0 | 50 | 217041 | 1012.74 | 1025 | 1003 | 213.3 |
| A | 0 | 226 | 71765 | 331.72 | 1025 | 1003 | 213.3 |
| B | 15 | 85 | 236505 | 1144.06 | 1046 | 1018 | 205.8 |
| B | 15 | 204 | 221724 | 1072.25 | 1046 | 1018 | 205.8 |
| B | 2 | 249 | 70665 | 338.36 | 1046 | 1018 | 205.8 |
| C | 7 | 220 | 56851 | 235.33 | 1011 | 1018 | 237.3 |
| C | 1 | 192 | 21611 | 86.8 | 1011 | 1018 | 237.3 |
| C | 13 | 61 | 8517 | 31.61 | 1011 | 1018 | 237.3 |
| D | 13 | 46 | 113746 | 461.61 | 1003 | 971 | 244.3 |
| D | 13 | 239 | 45506 | 182.29 | 1003 | 971 | 244.3 |
| D | 13 | 223 | 21553 | 84.24 | 1003 | 971 | 244.3 |
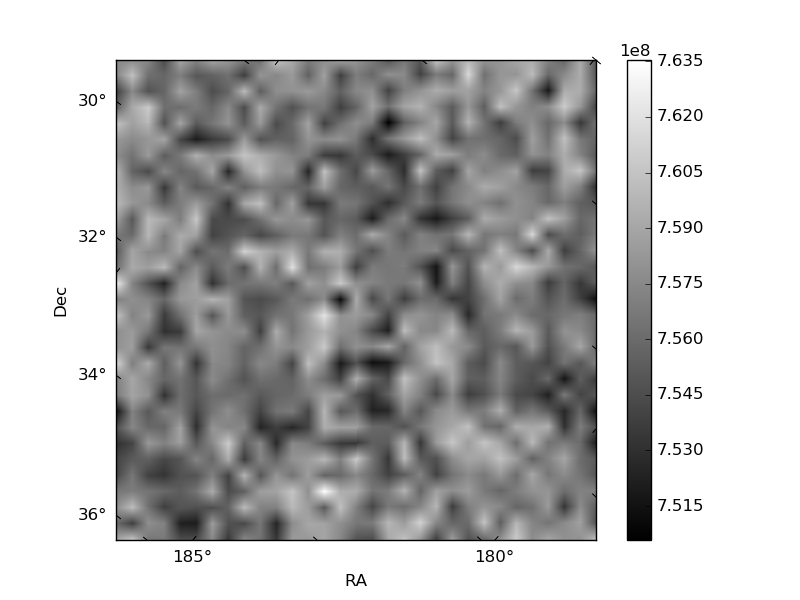
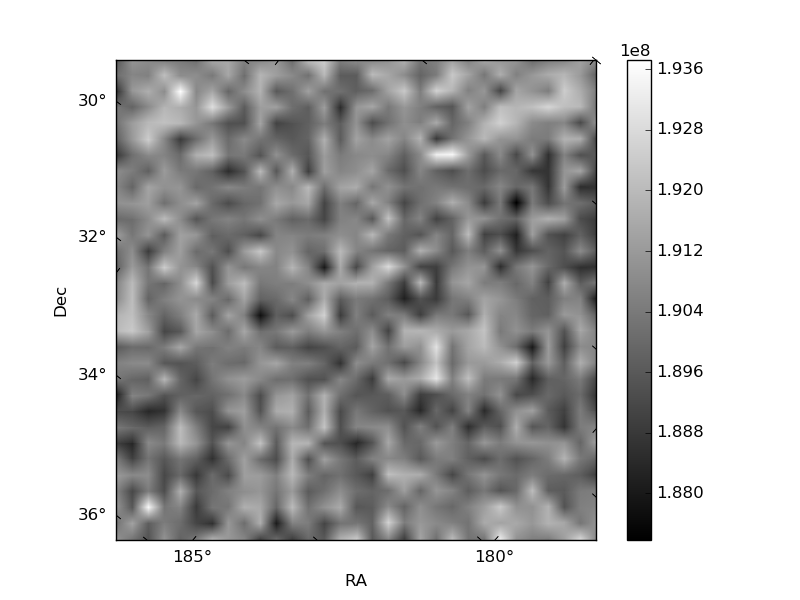
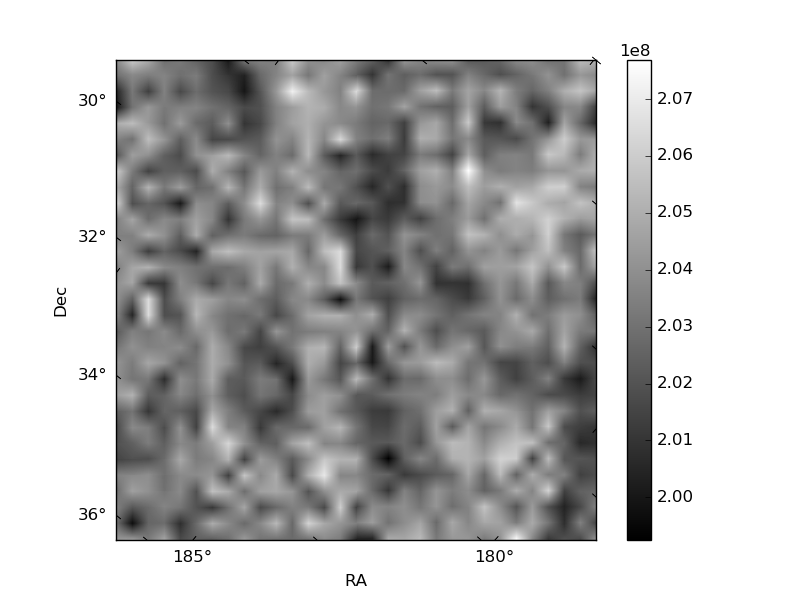
Histogram calculated using DETX and DETY for each event in the final _common_clean file
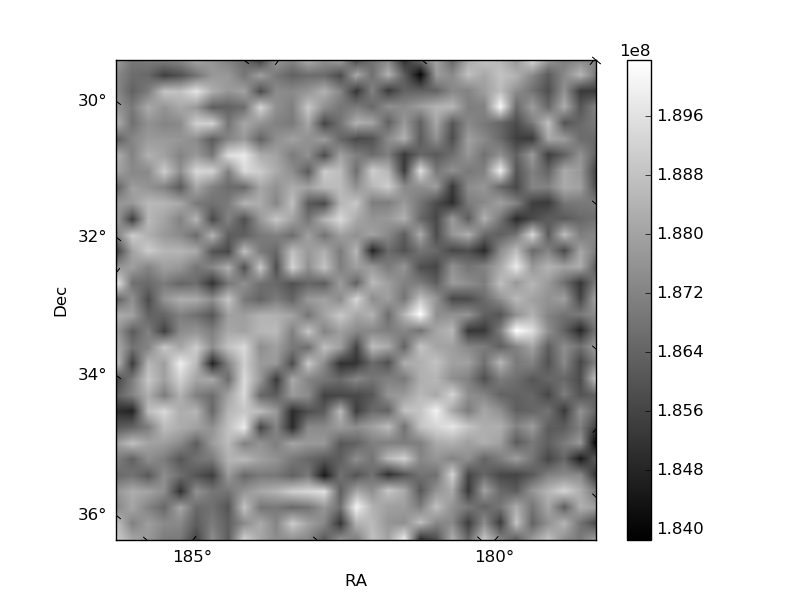
| Quadrant A | 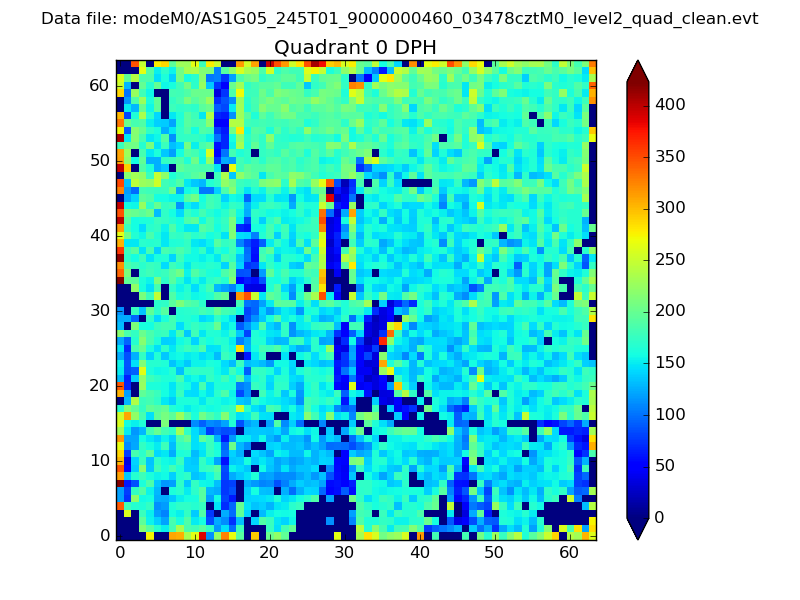 |
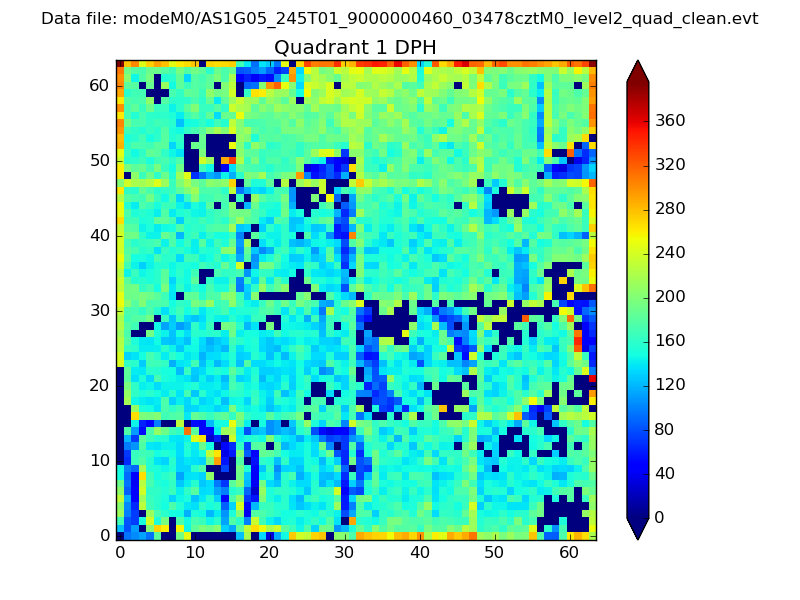 |
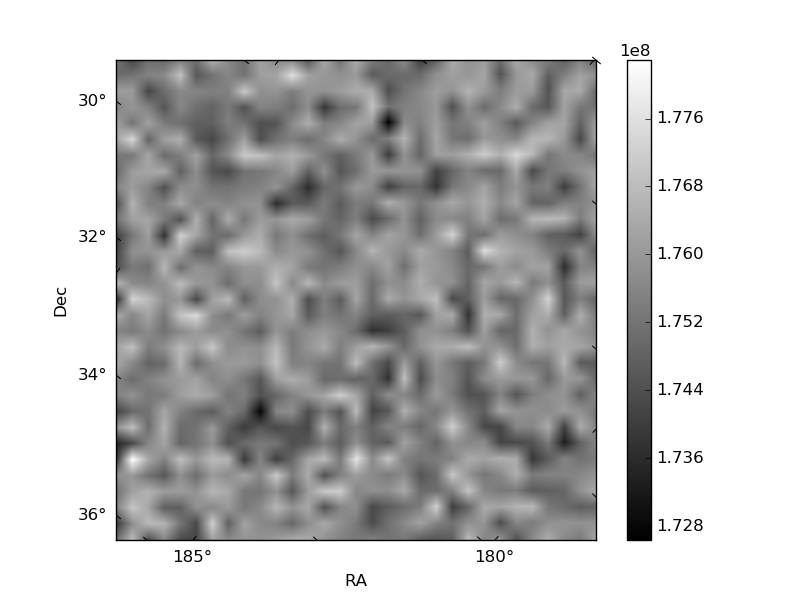
Quadrant B |
|---|---|---|---|
| Quadrant D | 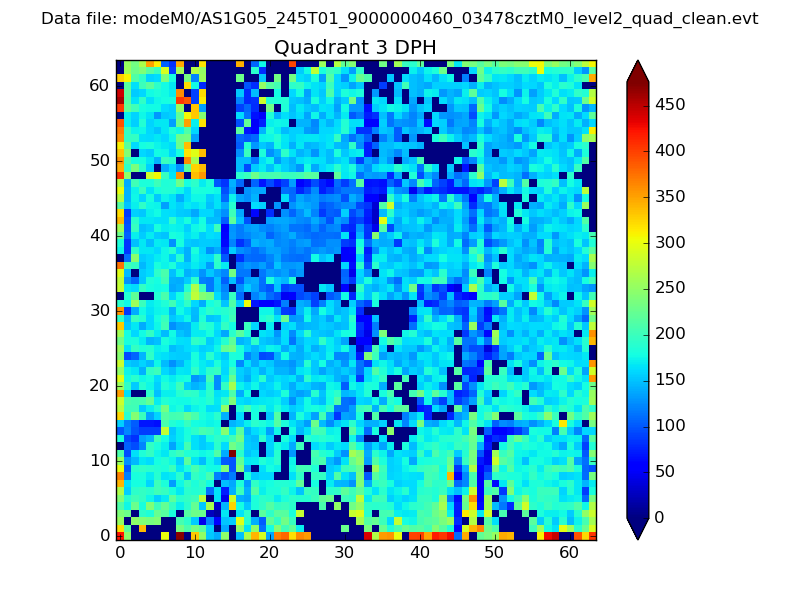 |
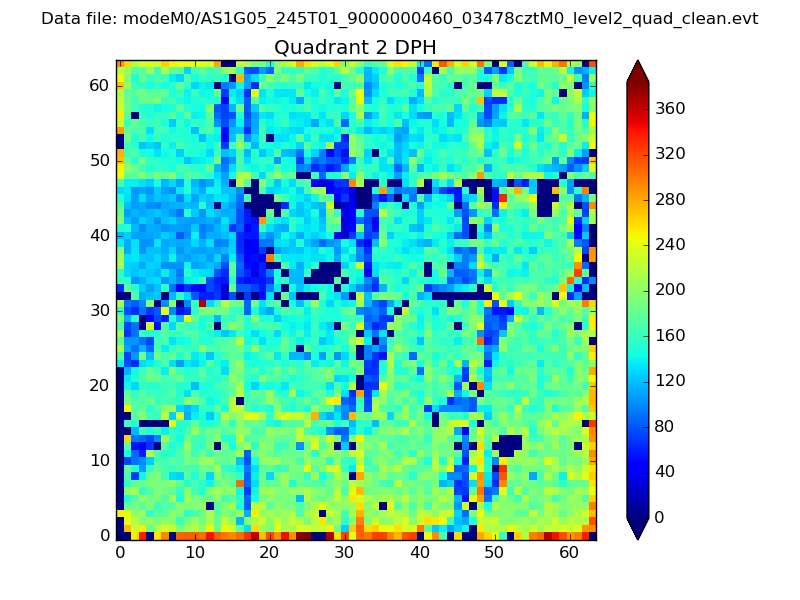 |
Quadrant C |
| Plot type | Count rate plots | Images |
|---|---|---|
| Comparison with Poisson distribution Blue bars denote a histogram of data divided into 1 sec bins. Red curve is a Poisson curve with rate = median count rate of data. |
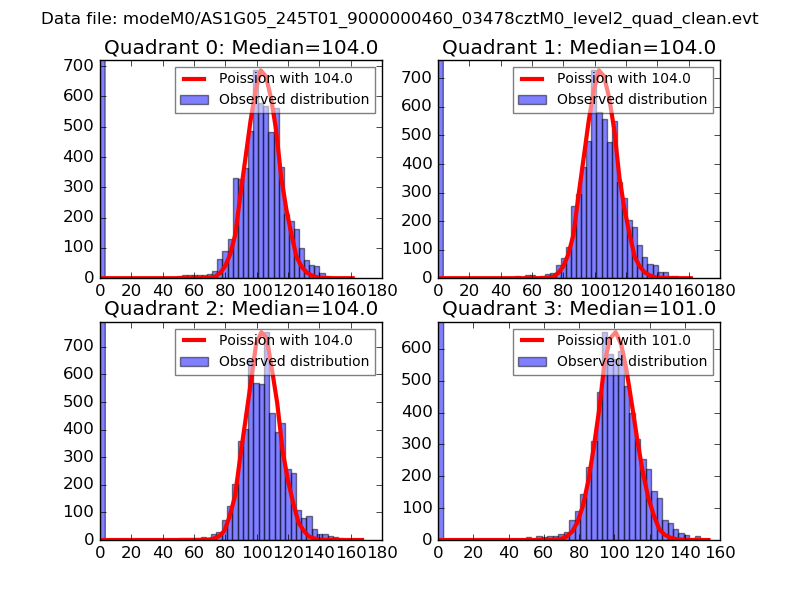 |
 |
| Quadrant-wise count rates Data is divided into 100 sec bins |
 |
|
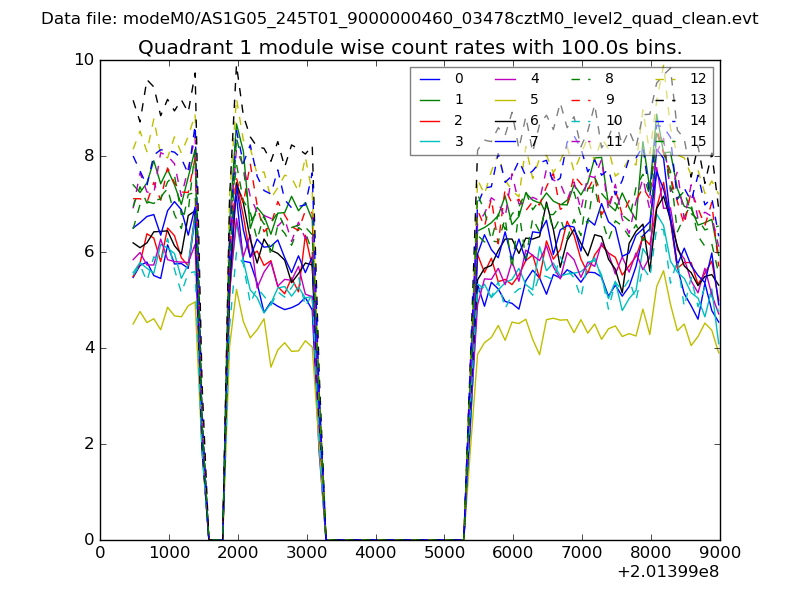
| Module-wise count rates for Quadrant A Data is divided into 100 sec bins |
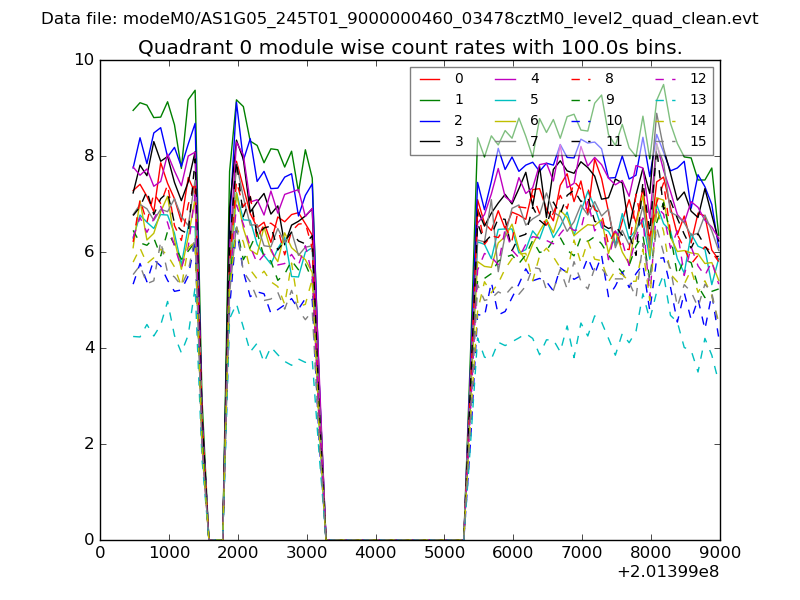 |
 |
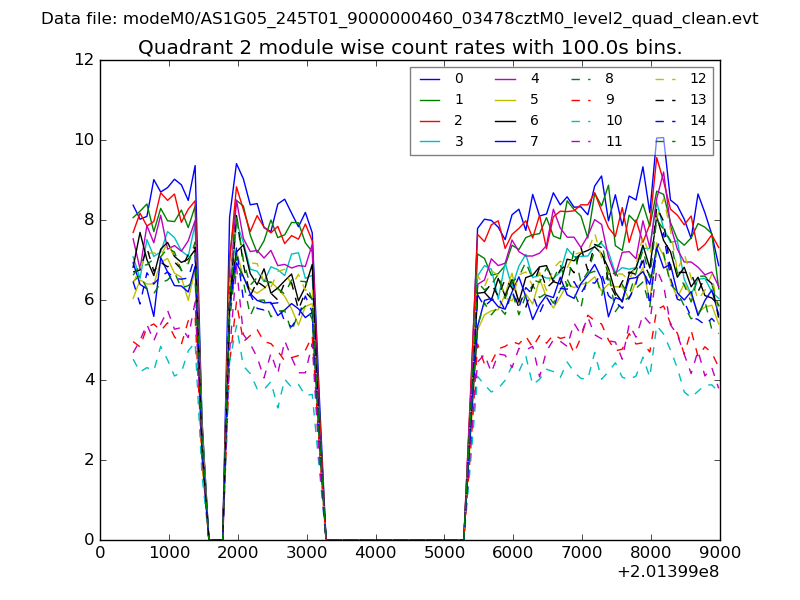
| Module-wise count rates for Quadrant B Data is divided into 100 sec bins |
 |
 |
| Module-wise count rates for Quadrant C Data is divided into 100 sec bins |
 |
 |
| Module-wise count rates for Quadrant D Data is divided into 100 sec bins |
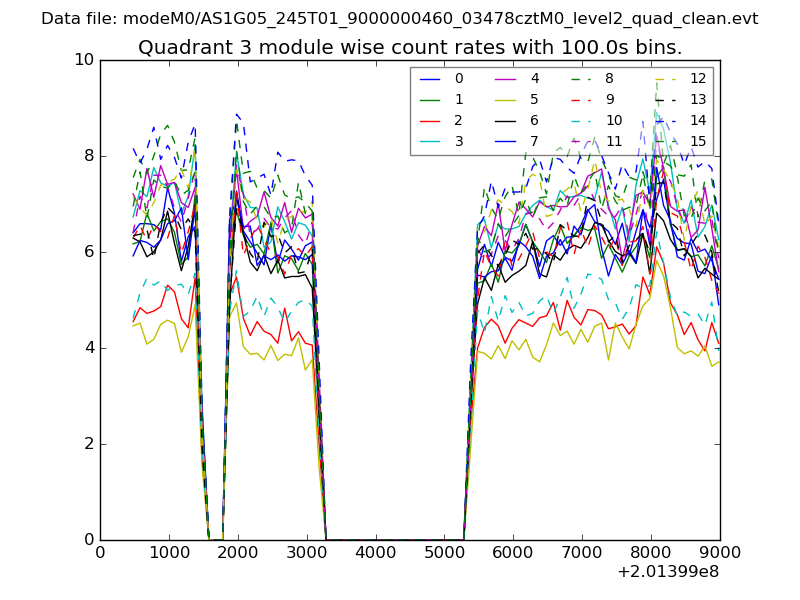 |
 |
| Parameter | Plot |
|---|---|
| CZT HV Monitor | 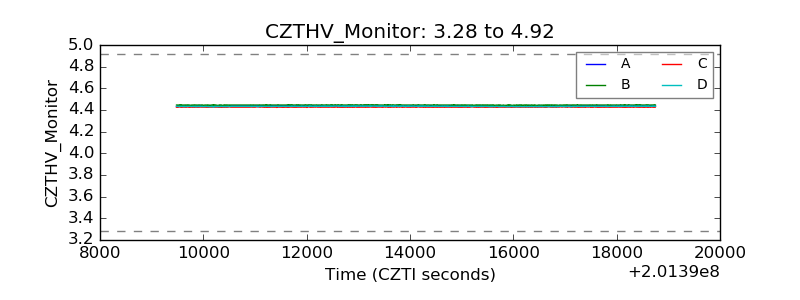 |
| D_VDD | 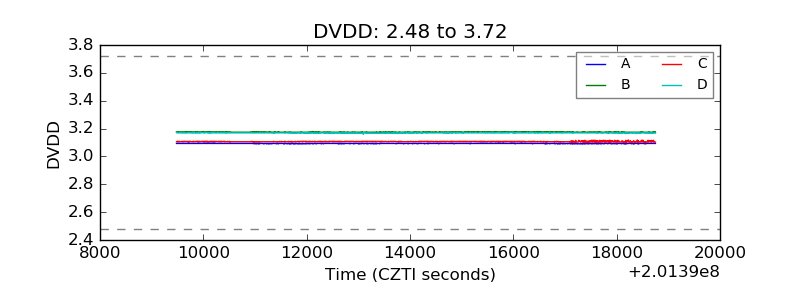 |
| Temperature 1 | 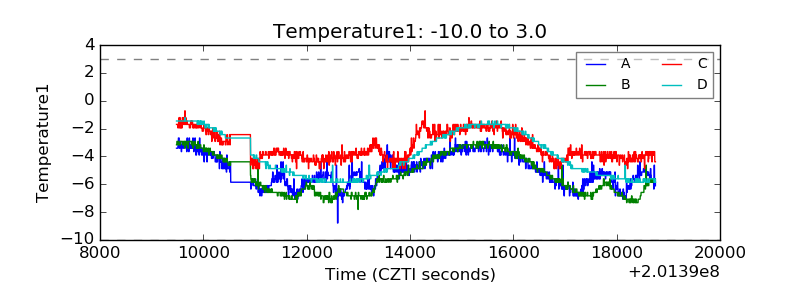 |
| Veto HV Monitor | 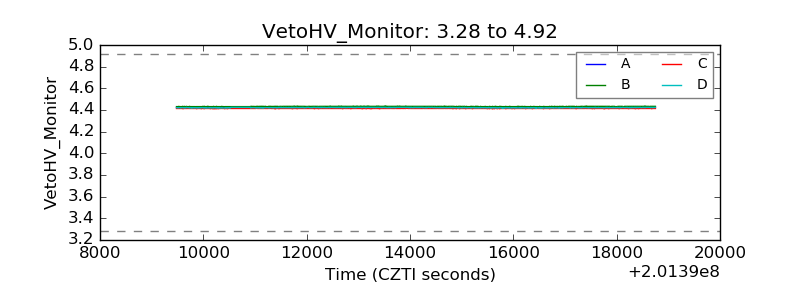 |
| Veto LLD | 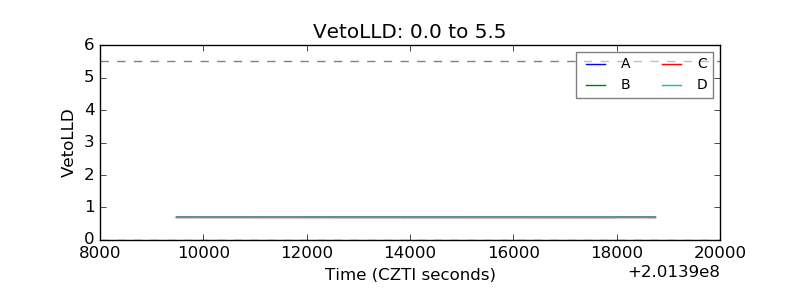 |
| Alpha Counter | 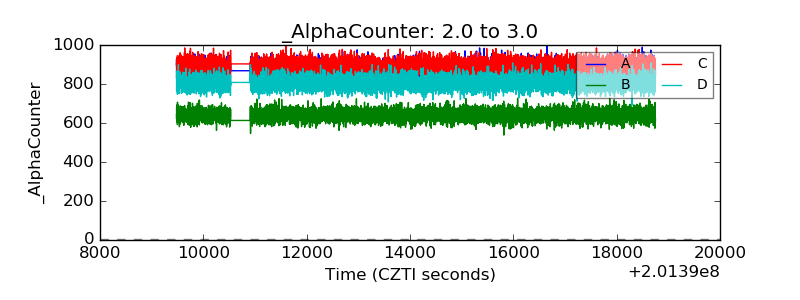 |
| _CPM_Rate | 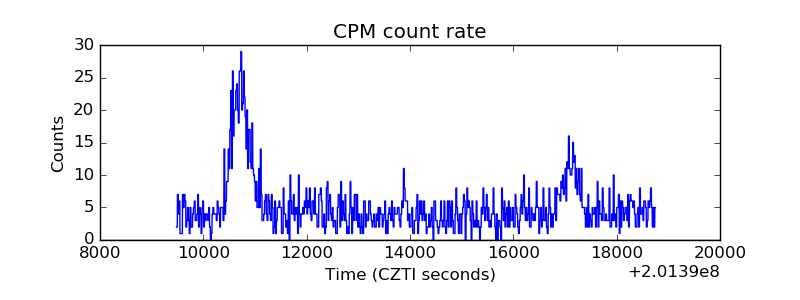 |
| CZT Counter | 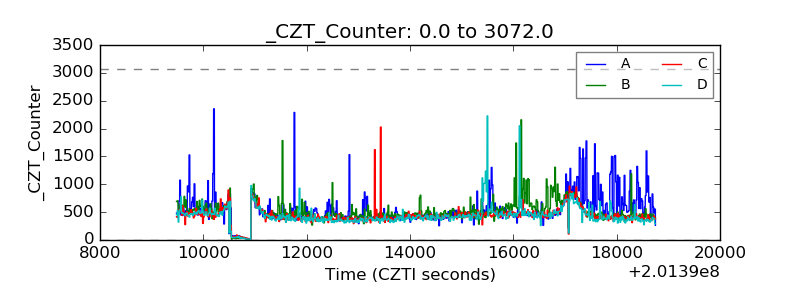 |
| +2.5 Volts monitor |  |
| +5 Volts monitor |  |
| Veto Counter | 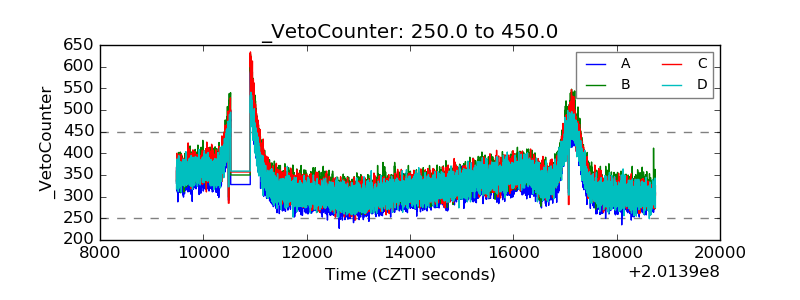 |