| Param | Original file | Final file |
|---|---|---|
| Filename | modeM0/AS1G05_245T01_9000000460_03486cztM0_level2.evt | modeM0/AS1G05_245T01_9000000460_03486cztM0_level2_quad_clean.evt |
| Size (bytes) | 433,019,520 | 82,350,720 |
| Size | 413.0 MB | 78.5 MB |
| Events in quadrant A | 3,071,695 | 529,367 |
| Events in quadrant B | 3,541,164 | 525,164 |
| Events in quadrant C | 3,309,464 | 518,398 |
| Events in quadrant D | 2,789,408 | 507,345 |
| Mode M0 | |||
|---|---|---|---|
| Quadrant | BADHDUFLAG | Total packets | Discarded packets |
| A | 0 | 13227 | 2 |
| B | 0 | 14285 | 1 |
| C | 0 | 13873 | 1 |
| D | 0 | 12623 | 1 |
| Mode SS | |||
|---|---|---|---|
| Quadrant | BADHDUFLAG | Total packets | Discarded packets |
| A | 0 | 120 | 0 |
| B | 0 | 120 | 0 |
| C | 0 | 120 | 0 |
| D | 0 | 120 | 0 |
| Mode M9 | |||
|---|---|---|---|
| Quadrant | BADHDUFLAG | Total packets | Discarded packets |
| A | 0 | 12 | 0 |
| B | 0 | 12 | 0 |
| C | 0 | 12 | 0 |
| D | 0 | 12 | 0 |
| Quadrant | Total seconds | Saturated seconds | Saturation percentage |
|---|---|---|---|
| A | 5920 | 150 | 2.533784% |
| B | 5920 | 136 | 2.297297% |
| C | 5920 | 135 | 2.280405% |
| D | 5920 | 91 | 1.537162% |
Noise dominated data is calculated using 1-second bins in cleaned event files. If a bin has >2000 counts, and if more than 50% of those come from <1% of pixels, then it is considered to be noise-dominated and hence unusable.
| Quadrant | # 1 sec bins | Bins with >0 counts | Bins with >2000 counts | High rate bins dominated by noise | Noise dominated (total time) | Noise dominated (detector-on time) | Marked lightcurve |
|---|---|---|---|---|---|---|---|
| A | 7075 | 5920 | 44 | 44 | 0.62% | 0.74% | 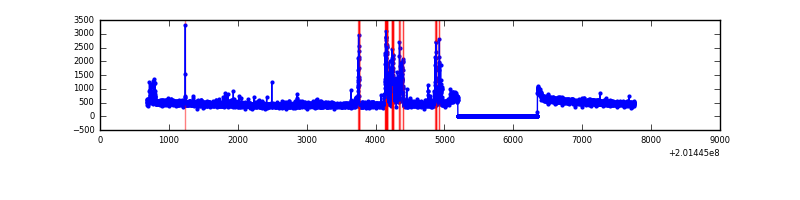 |
| B | 7075 | 5920 | 35 | 35 | 0.49% | 0.59% |  |
| C | 7075 | 5920 | 53 | 53 | 0.75% | 0.90% | 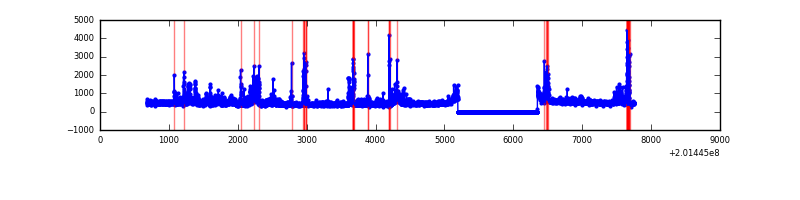 |
| D | 7075 | 5920 | 19 | 19 | 0.27% | 0.32% | 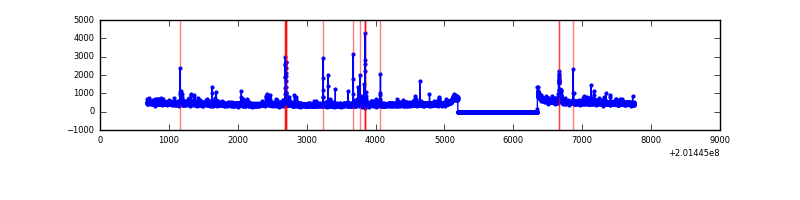 |
Top three noisy pixels from each quadrant. If the there are fewer than three noisy pixels in the level2.evt file, extra rows are filled as -1
| Pixel properties | Quadrant properties | ||||||
|---|---|---|---|---|---|---|---|
| Quadrant | DetID | PixID | Counts | Sigma | Mean | Median | Sigma |
| A | 0 | 50 | 270526 | 1879.68 | 699 | 685 | 143.6 |
| A | 0 | 118 | 72632 | 501.18 | 699 | 685 | 143.6 |
| A | 0 | 226 | 13614 | 90.06 | 699 | 685 | 143.6 |
| B | 15 | 204 | 360779 | 2690.94 | 700 | 685 | 133.8 |
| B | 8 | 3 | 206588 | 1538.69 | 700 | 685 | 133.8 |
| B | 15 | 85 | 166829 | 1241.57 | 700 | 685 | 133.8 |
| C | 7 | 220 | 360626 | 2279.86 | 678 | 684 | 157.9 |
| C | 1 | 192 | 212685 | 1342.81 | 678 | 684 | 157.9 |
| C | 1 | 16 | 73693 | 462.44 | 678 | 684 | 157.9 |
| D | 13 | 223 | 49775 | 296.21 | 681 | 661 | 165.8 |
| D | 5 | 233 | 41781 | 248.0 | 681 | 661 | 165.8 |
| D | 2 | 31 | 37563 | 222.56 | 681 | 661 | 165.8 |
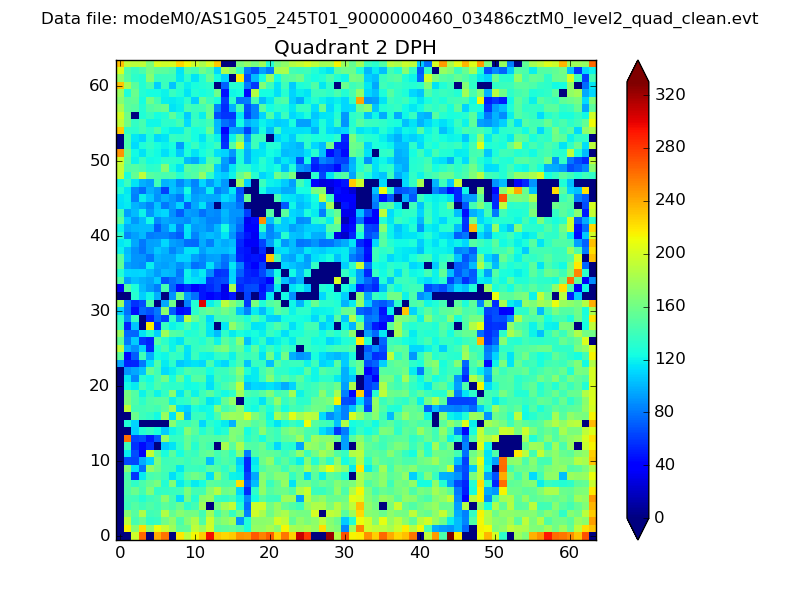
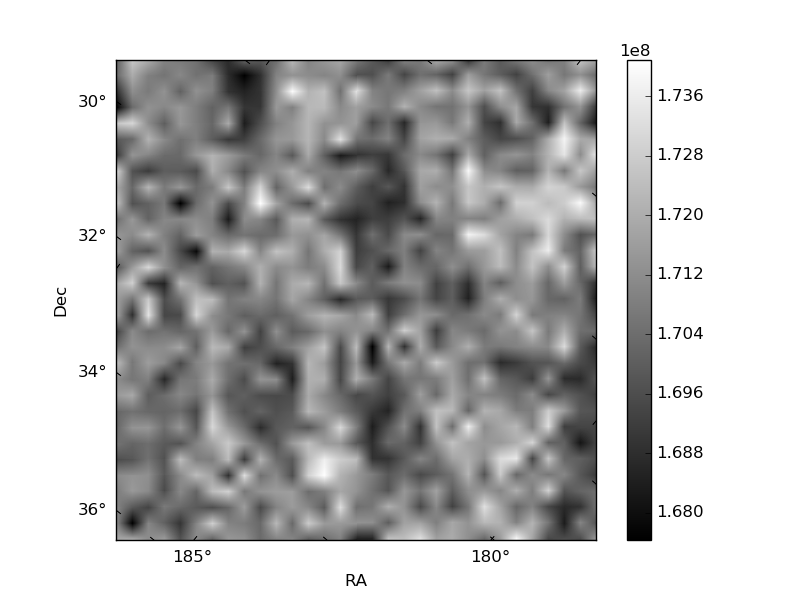
Histogram calculated using DETX and DETY for each event in the final _common_clean file
| Quadrant A |  |
 |
Quadrant B |
|---|---|---|---|
| Quadrant D | 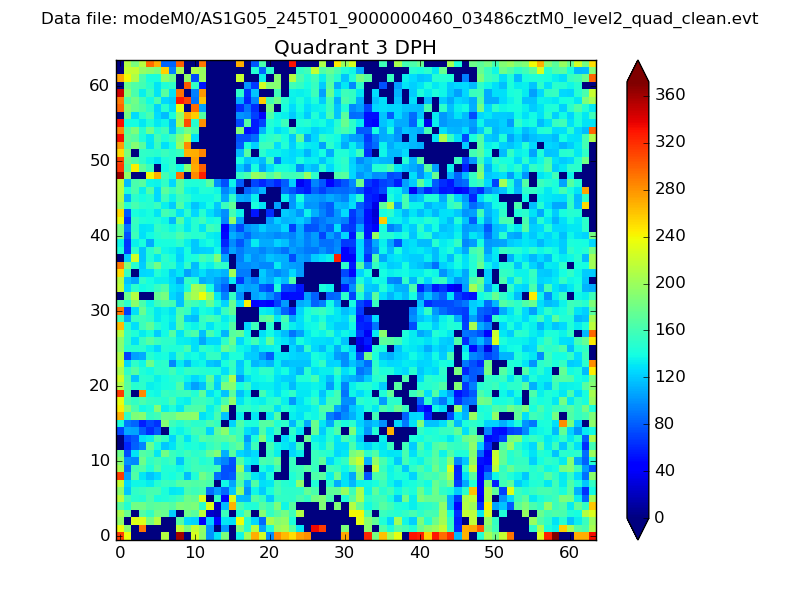 |
 |
Quadrant C |
| Plot type | Count rate plots | Images |
|---|---|---|
| Comparison with Poisson distribution Blue bars denote a histogram of data divided into 1 sec bins. Red curve is a Poisson curve with rate = median count rate of data. |
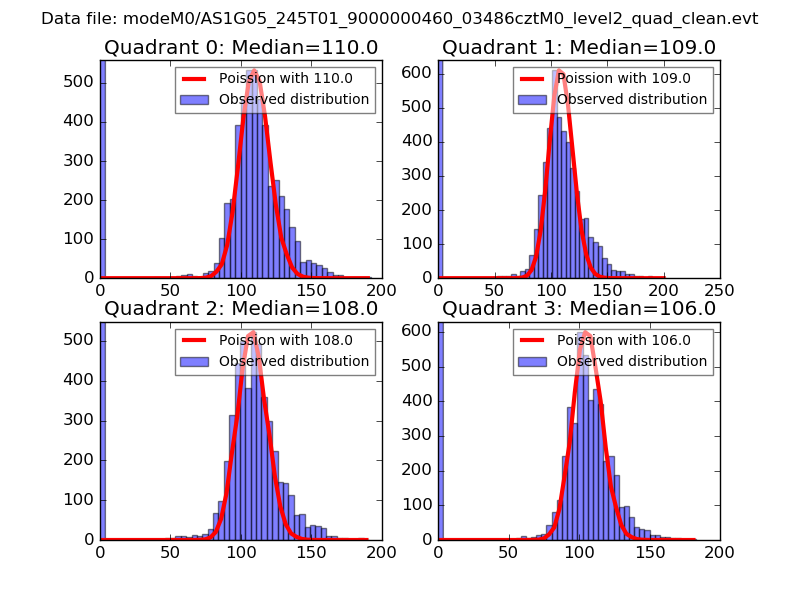 |
 |
| Quadrant-wise count rates Data is divided into 100 sec bins |
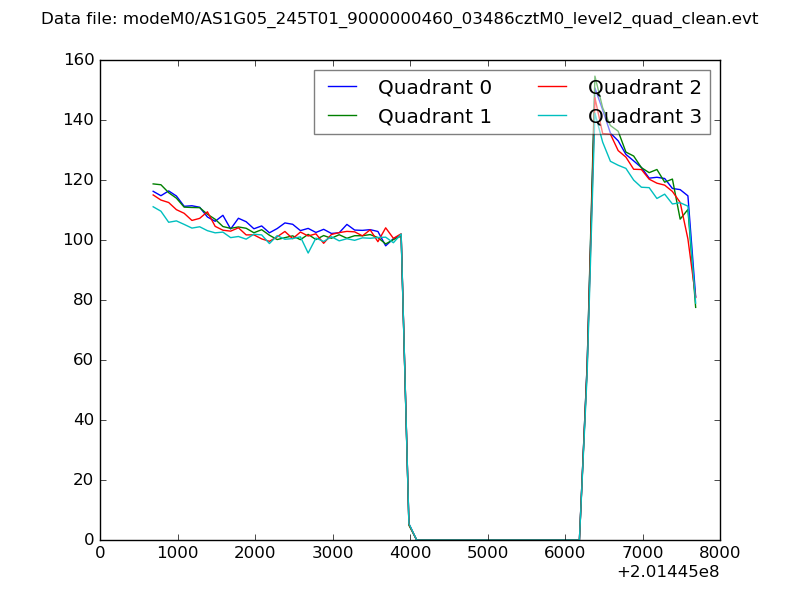 |
|
| Module-wise count rates for Quadrant A Data is divided into 100 sec bins |
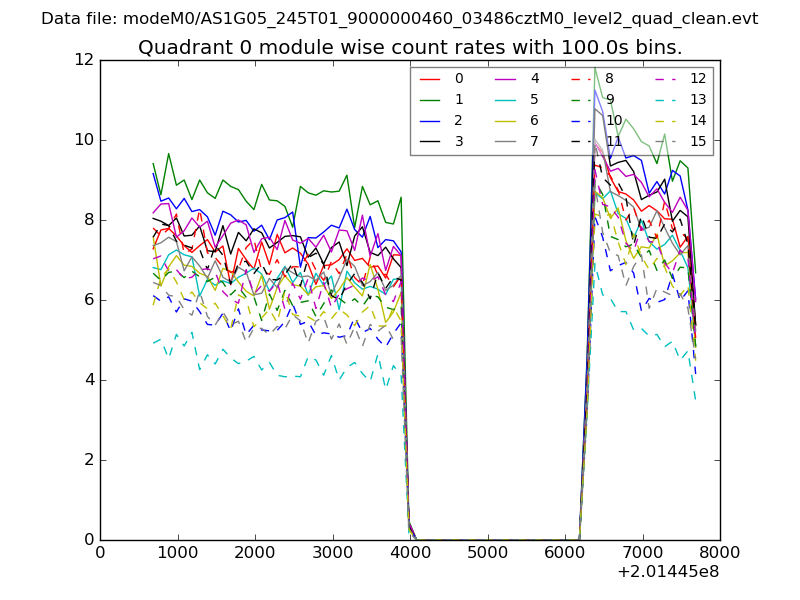 |
 |
| Module-wise count rates for Quadrant B Data is divided into 100 sec bins |
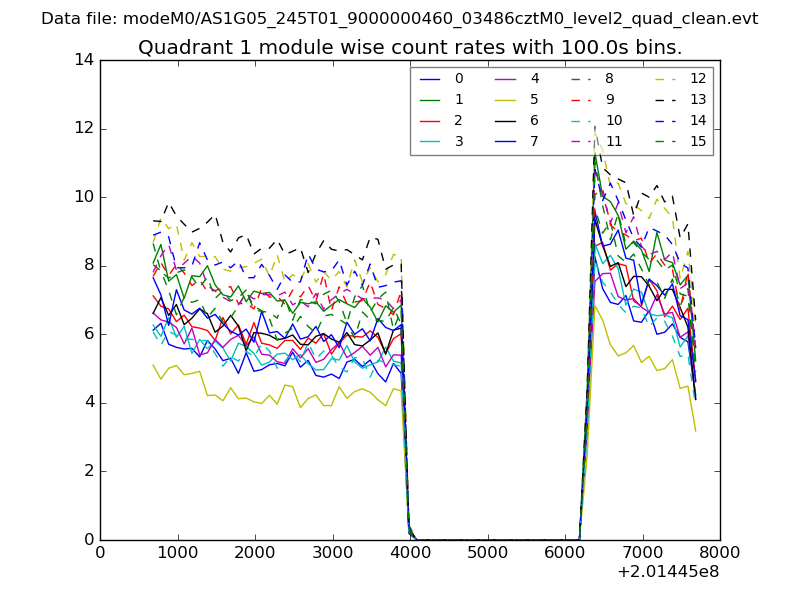 |
 |
| Module-wise count rates for Quadrant C Data is divided into 100 sec bins |
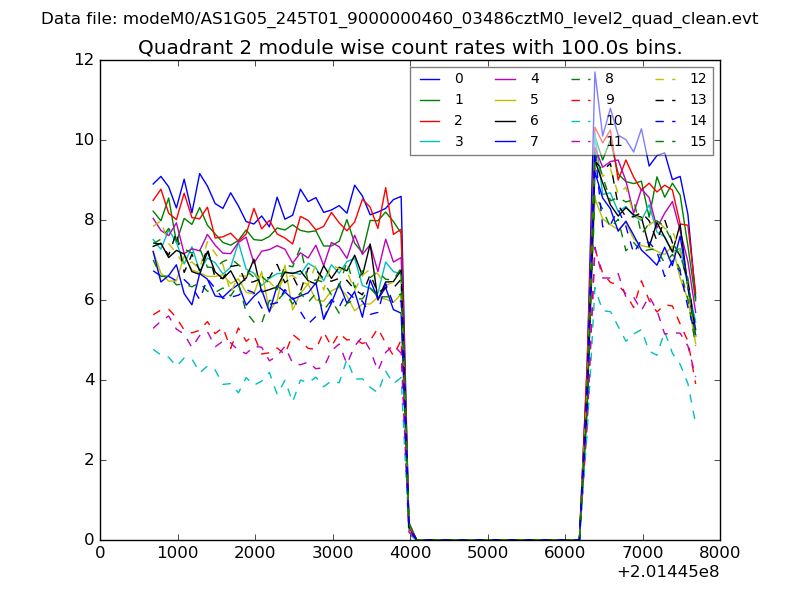 |
 |
| Module-wise count rates for Quadrant D Data is divided into 100 sec bins |
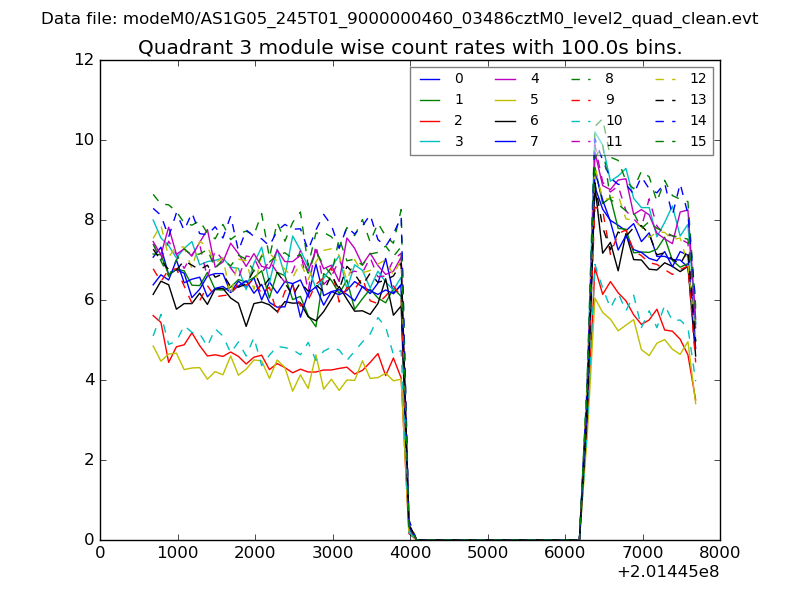 |
 |
| Parameter | Plot |
|---|---|
| CZT HV Monitor | 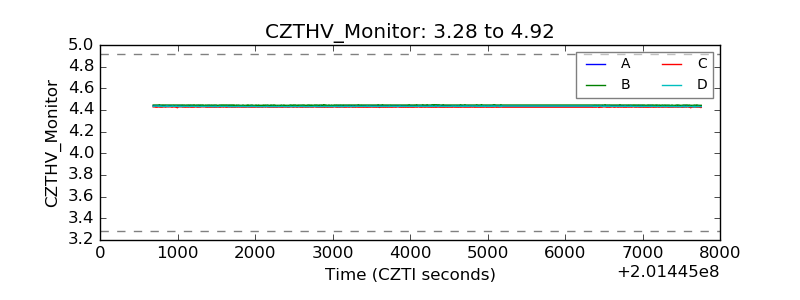 |
| D_VDD | 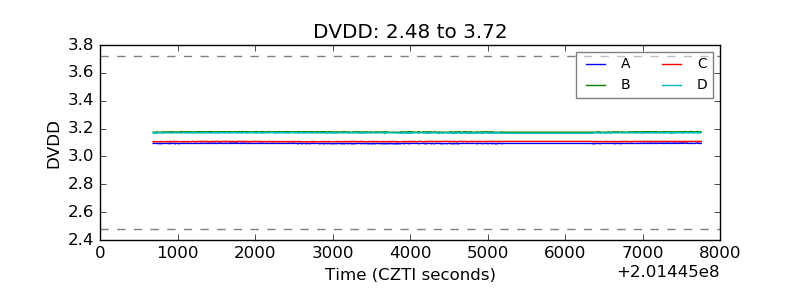 |
| Temperature 1 | 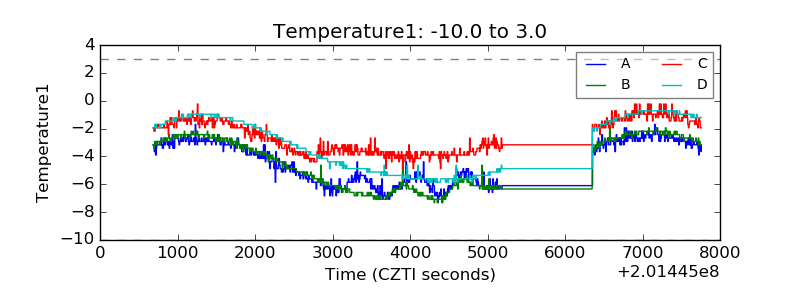 |
| Veto HV Monitor | 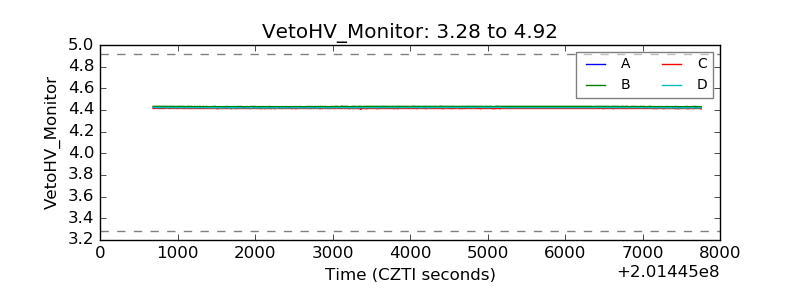 |
| Veto LLD | 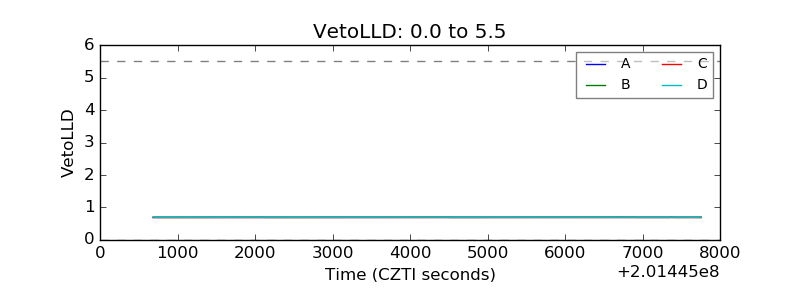 |
| Alpha Counter | 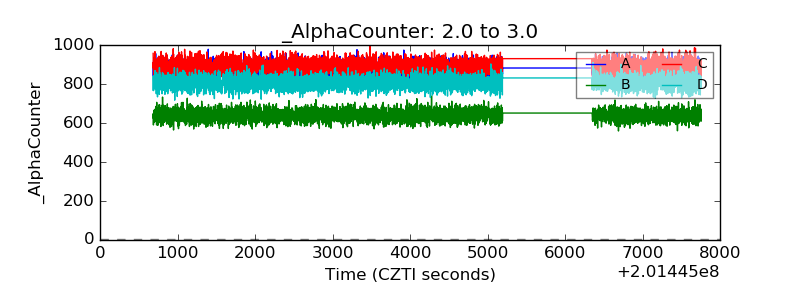 |
| _CPM_Rate | 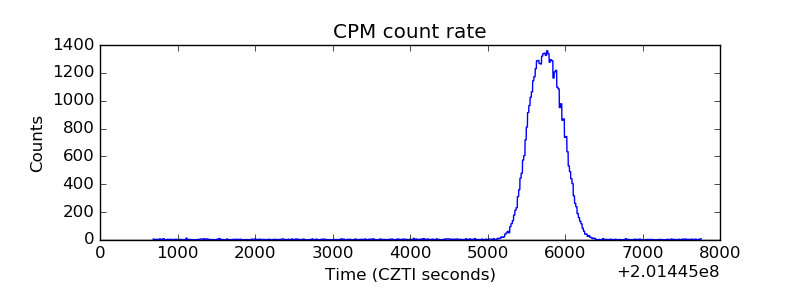 |
| CZT Counter | 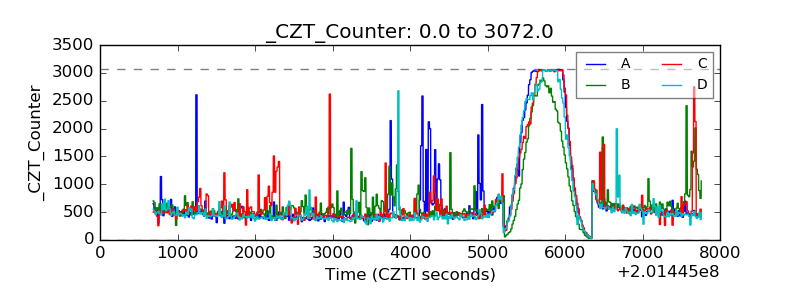 |
| +2.5 Volts monitor |  |
| +5 Volts monitor |  |
| Veto Counter | 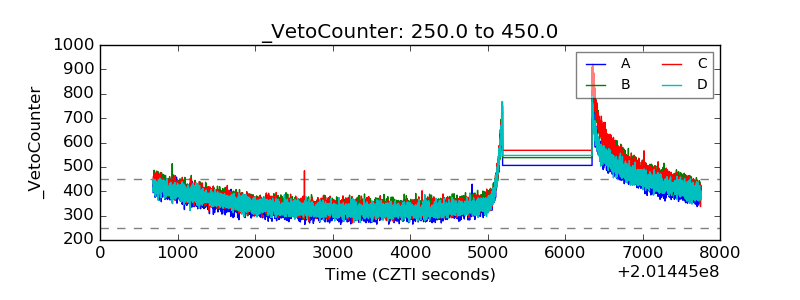 |