| Param | Original file | Final file |
|---|---|---|
| Filename | modeM0/AS1G05_245T01_9000000460_03490cztM0_level2.evt | modeM0/AS1G05_245T01_9000000460_03490cztM0_level2_quad_clean.evt |
| Size (bytes) | 509,063,040 | 73,535,040 |
| Size | 485.5 MB | 70.1 MB |
| Events in quadrant A | 3,213,020 | 456,701 |
| Events in quadrant B | 3,161,502 | 464,049 |
| Events in quadrant C | 5,820,828 | 409,521 |
| Events in quadrant D | 2,782,158 | 444,826 |
| Mode M0 | |||
|---|---|---|---|
| Quadrant | BADHDUFLAG | Total packets | Discarded packets |
| A | 0 | 14258 | 3 |
| B | 0 | 13830 | 2 |
| C | 0 | 21749 | 2 |
| D | 0 | 13360 | 2 |
| Mode SS | |||
|---|---|---|---|
| Quadrant | BADHDUFLAG | Total packets | Discarded packets |
| A | 0 | 132 | 0 |
| B | 0 | 132 | 0 |
| C | 0 | 132 | 0 |
| D | 0 | 132 | 0 |
| Mode M9 | |||
|---|---|---|---|
| Quadrant | BADHDUFLAG | Total packets | Discarded packets |
| A | 0 | 22 | 0 |
| B | 0 | 22 | 0 |
| C | 0 | 22 | 0 |
| D | 0 | 22 | 0 |
| Quadrant | Total seconds | Saturated seconds | Saturation percentage |
|---|---|---|---|
| A | 6466 | 115 | 1.778534% |
| B | 6466 | 39 | 0.603155% |
| C | 6466 | 1216 | 18.806062% |
| D | 6466 | 20 | 0.309310% |
Noise dominated data is calculated using 1-second bins in cleaned event files. If a bin has >2000 counts, and if more than 50% of those come from <1% of pixels, then it is considered to be noise-dominated and hence unusable.
| Quadrant | # 1 sec bins | Bins with >0 counts | Bins with >2000 counts | High rate bins dominated by noise | Noise dominated (total time) | Noise dominated (detector-on time) | Marked lightcurve |
|---|---|---|---|---|---|---|---|
| A | 7521 | 6467 | 80 | 80 | 1.06% | 1.24% | 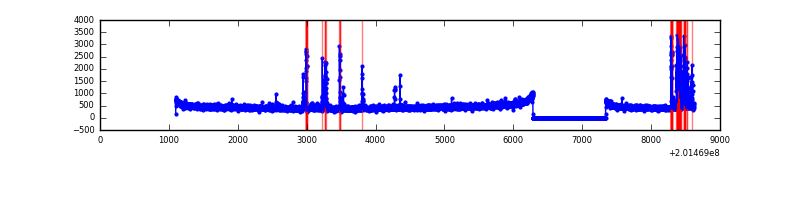 |
| B | 7521 | 6467 | 0 | 0 | 0.00% | 0.00% | 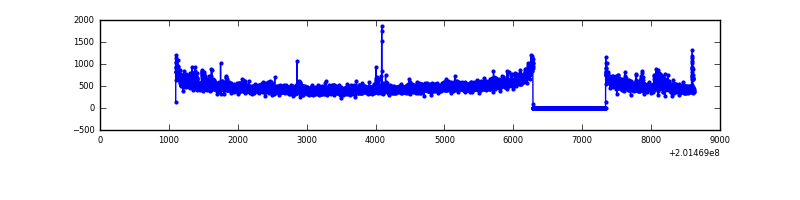 |
| C | 7521 | 6467 | 1064 | 1064 | 14.15% | 16.45% | 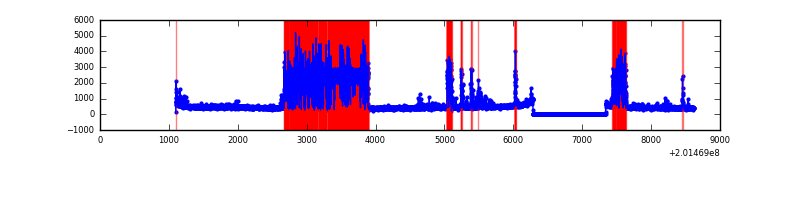 |
| D | 7521 | 6467 | 8 | 8 | 0.11% | 0.12% | 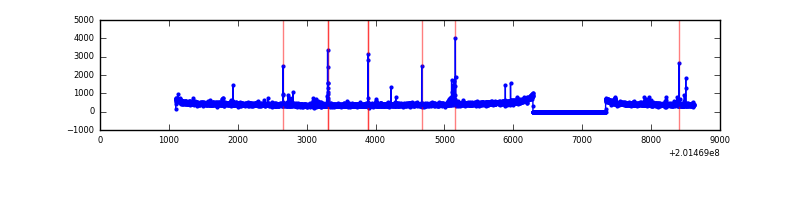 |
Top three noisy pixels from each quadrant. If the there are fewer than three noisy pixels in the level2.evt file, extra rows are filled as -1
| Pixel properties | Quadrant properties | ||||||
|---|---|---|---|---|---|---|---|
| Quadrant | DetID | PixID | Counts | Sigma | Mean | Median | Sigma |
| A | 0 | 50 | 370423 | 2445.56 | 731 | 715 | 151.2 |
| A | 0 | 118 | 19844 | 126.54 | 731 | 715 | 151.2 |
| A | 0 | 226 | 9545 | 58.41 | 731 | 715 | 151.2 |
| B | 15 | 204 | 198443 | 1372.75 | 748 | 731 | 144.0 |
| B | 4 | 81 | 16921 | 112.41 | 748 | 731 | 144.0 |
| B | 0 | 229 | 16486 | 109.39 | 748 | 731 | 144.0 |
| C | 7 | 220 | 3221738 | 21463.85 | 643 | 646 | 150.1 |
| C | 1 | 192 | 33353 | 217.94 | 643 | 646 | 150.1 |
| C | 12 | 80 | 18627 | 119.82 | 643 | 646 | 150.1 |
| D | 13 | 239 | 48800 | 277.38 | 715 | 693 | 173.4 |
| D | 13 | 223 | 12763 | 69.59 | 715 | 693 | 173.4 |
| D | 2 | 14 | 10939 | 59.08 | 715 | 693 | 173.4 |
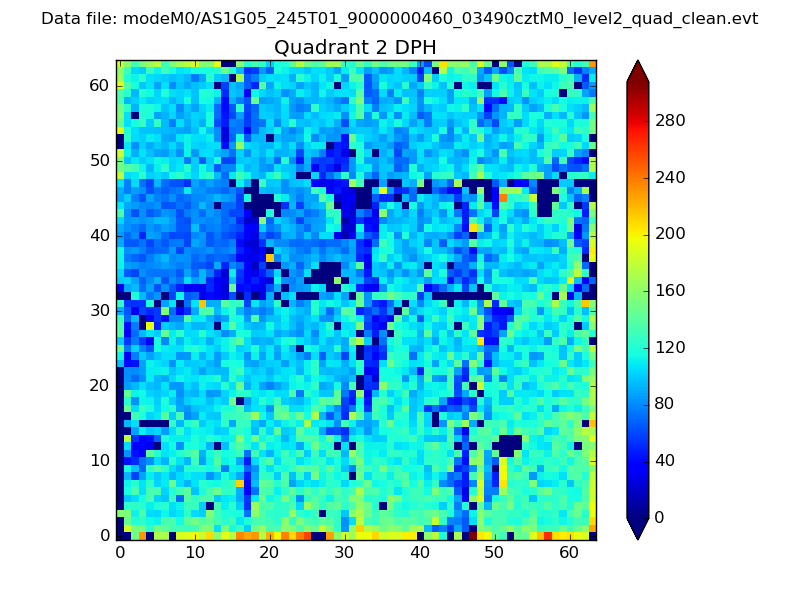
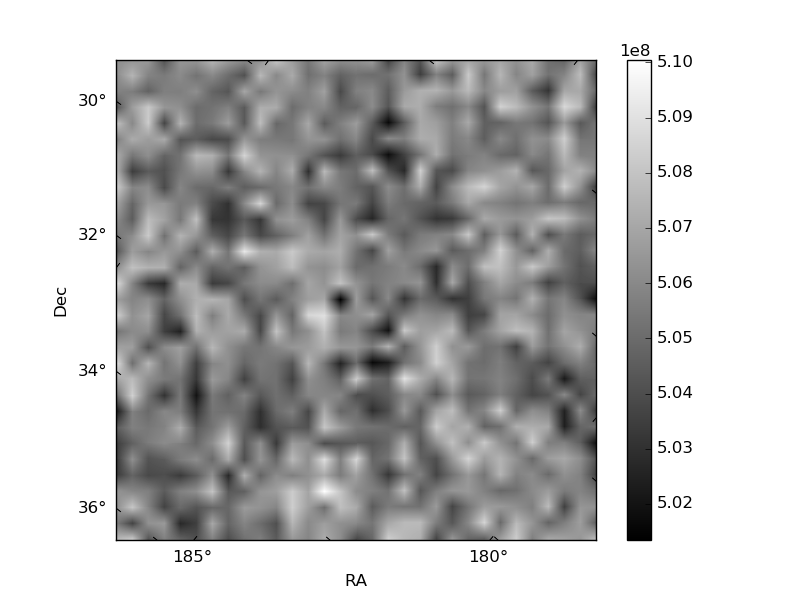
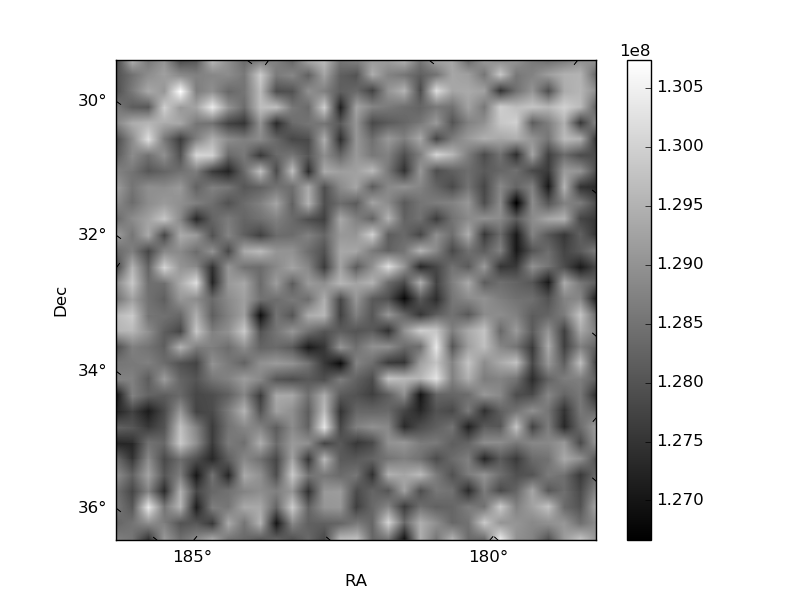
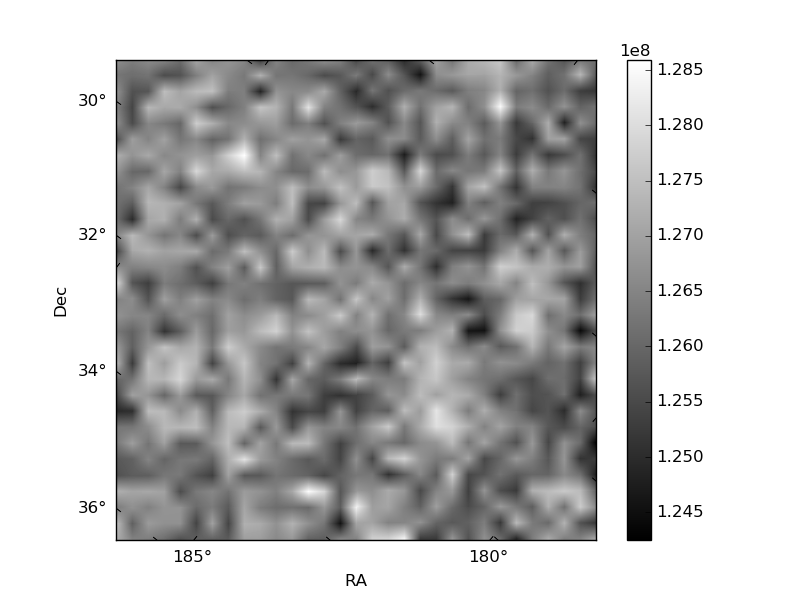
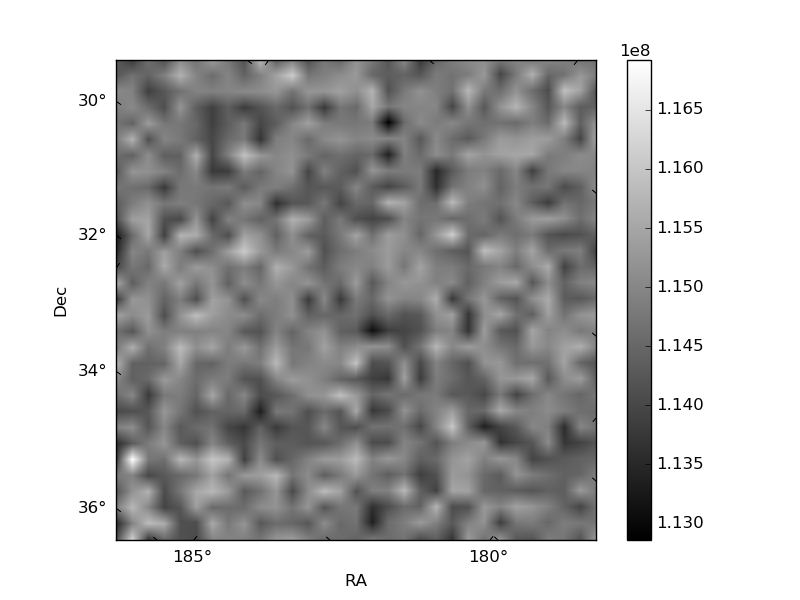
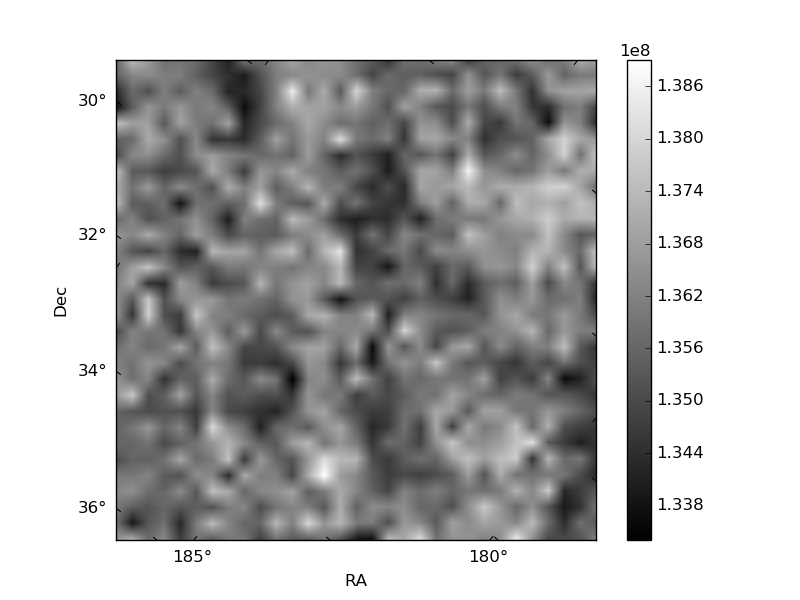
Histogram calculated using DETX and DETY for each event in the final _common_clean file
| Quadrant A | 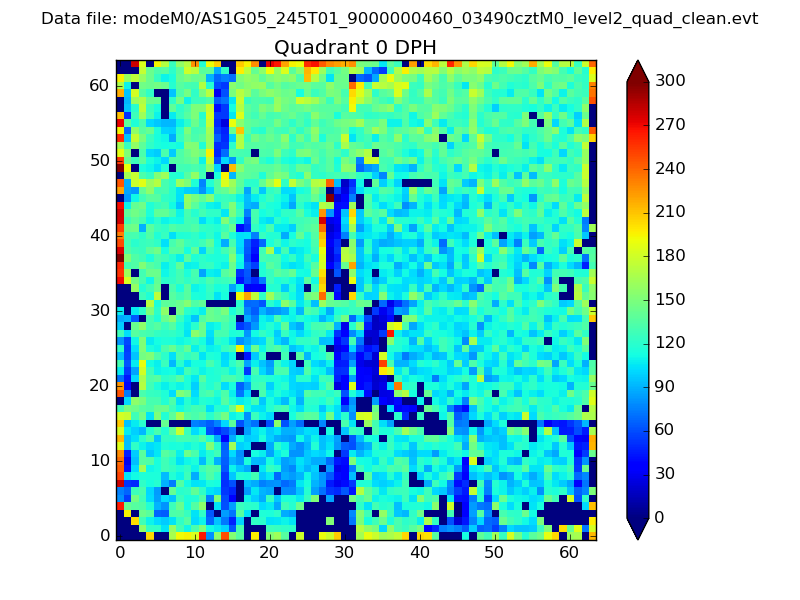 |
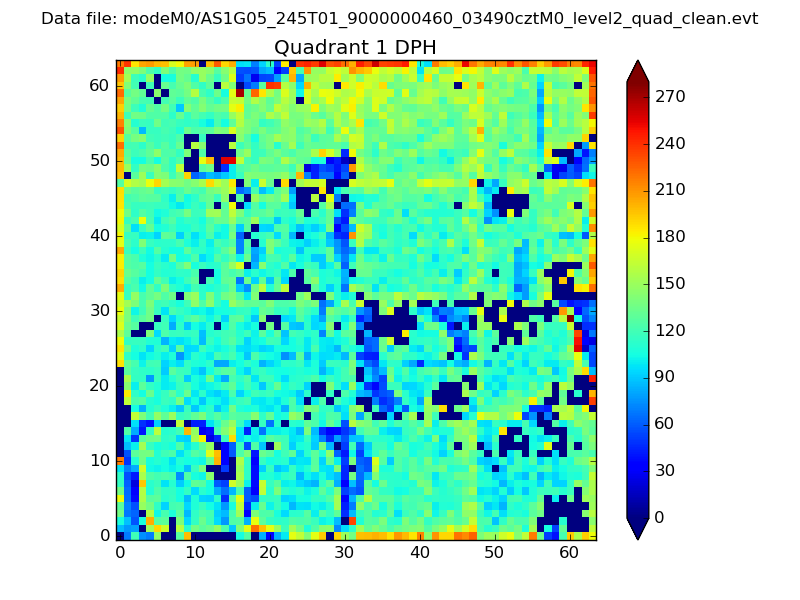 |
Quadrant B |
|---|---|---|---|
| Quadrant D | 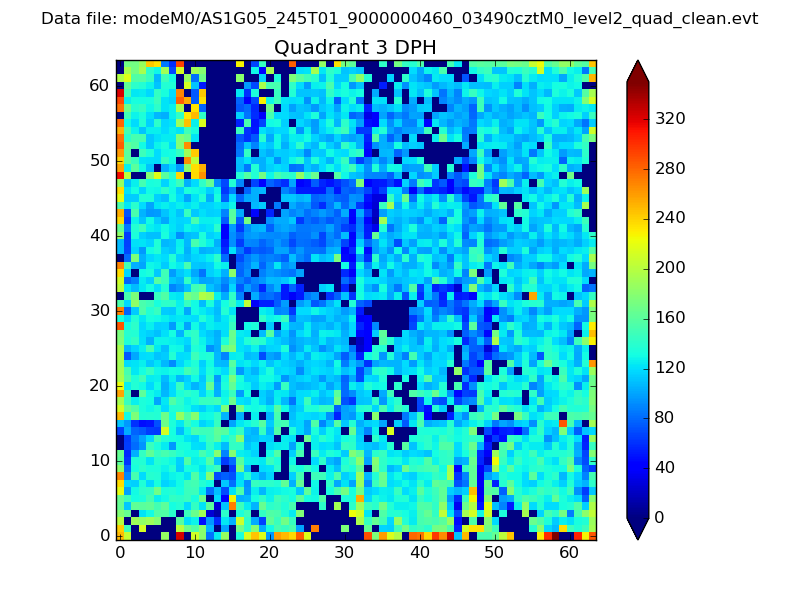 |
 |
Quadrant C |
| Plot type | Count rate plots | Images |
|---|---|---|
| Comparison with Poisson distribution Blue bars denote a histogram of data divided into 1 sec bins. Red curve is a Poisson curve with rate = median count rate of data. |
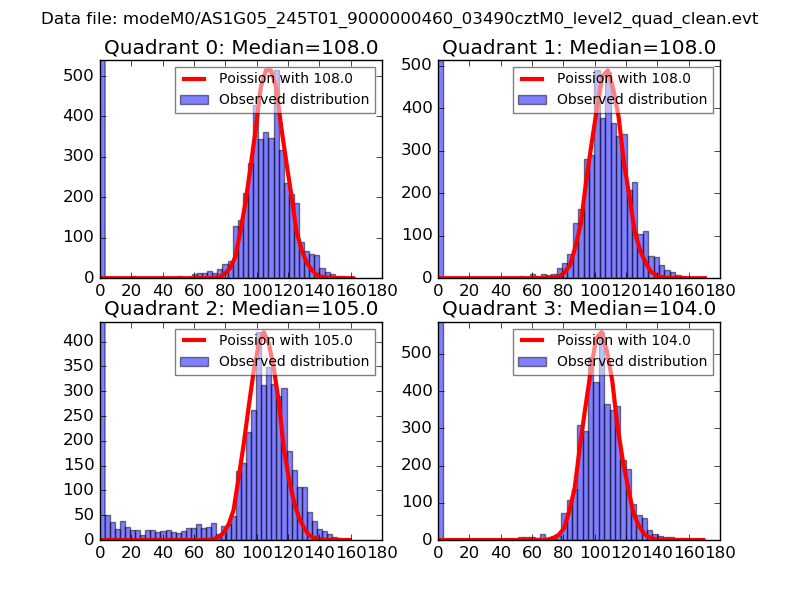 |
 |
| Quadrant-wise count rates Data is divided into 100 sec bins |
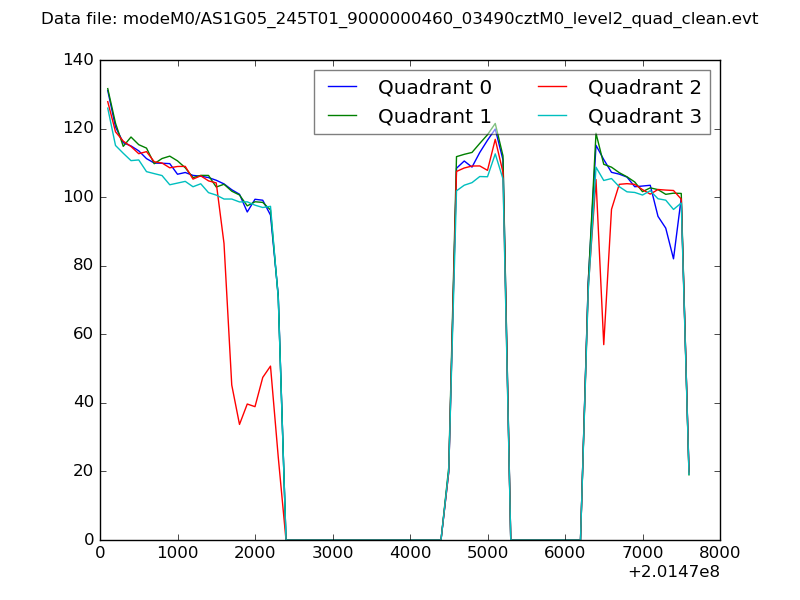 |
|
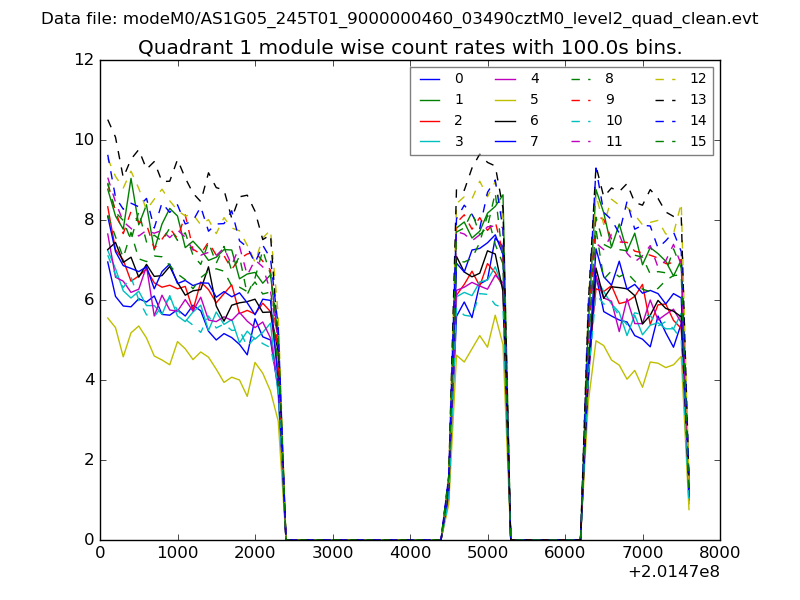
| Module-wise count rates for Quadrant A Data is divided into 100 sec bins |
 |
 |
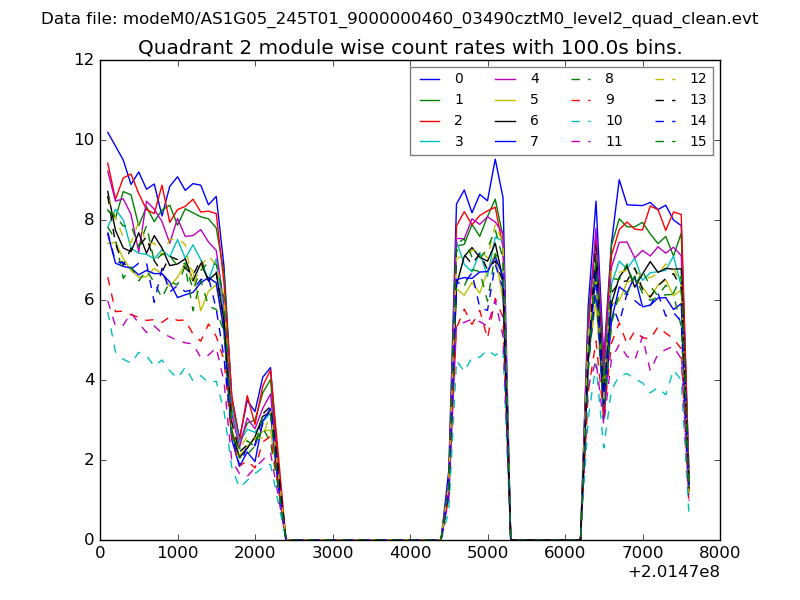
| Module-wise count rates for Quadrant B Data is divided into 100 sec bins |
 |
 |
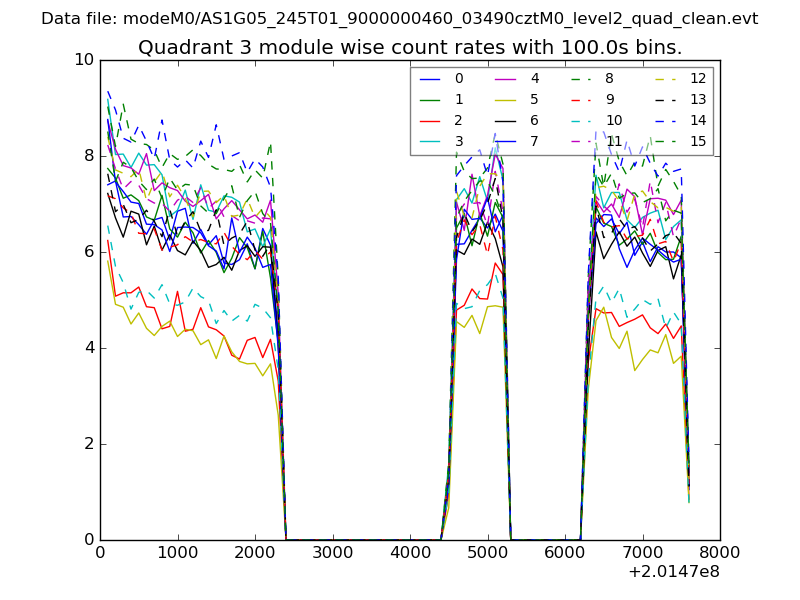
| Module-wise count rates for Quadrant C Data is divided into 100 sec bins |
 |
 |
| Module-wise count rates for Quadrant D Data is divided into 100 sec bins |
 |
 |
| Parameter | Plot |
|---|---|
| CZT HV Monitor | 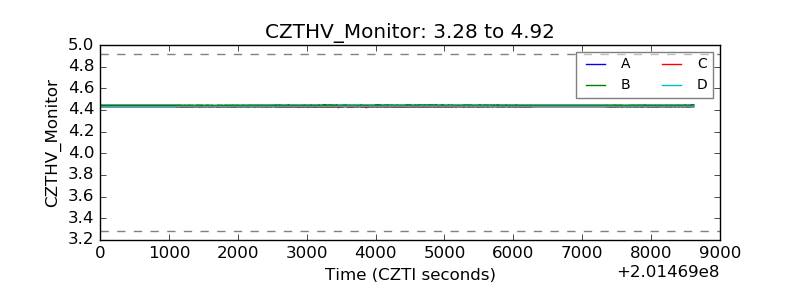 |
| D_VDD | 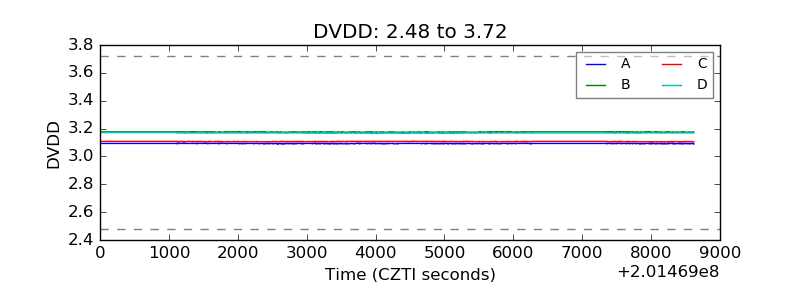 |
| Temperature 1 | 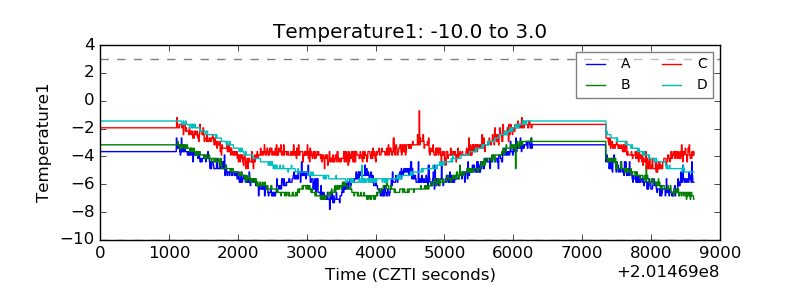 |
| Veto HV Monitor | 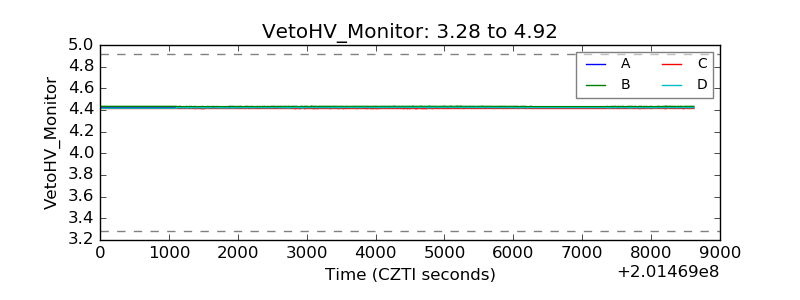 |
| Veto LLD | 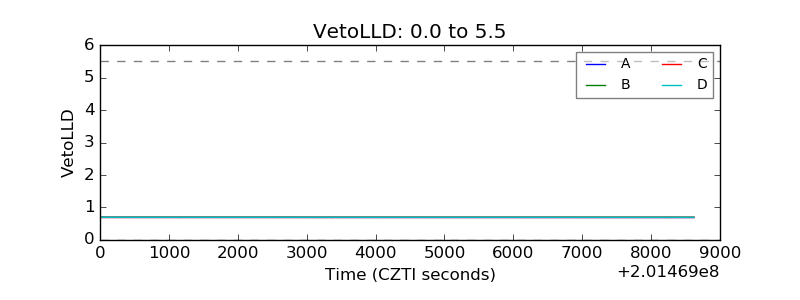 |
| Alpha Counter | 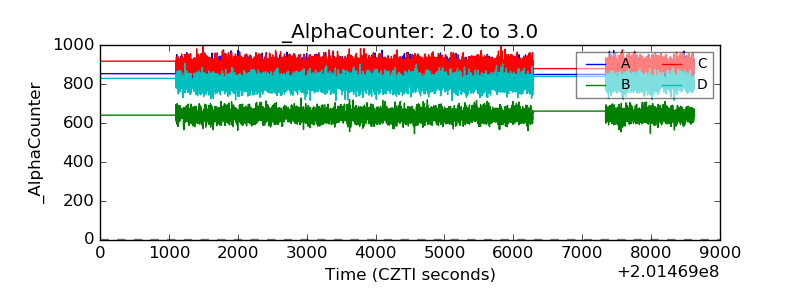 |
| _CPM_Rate | 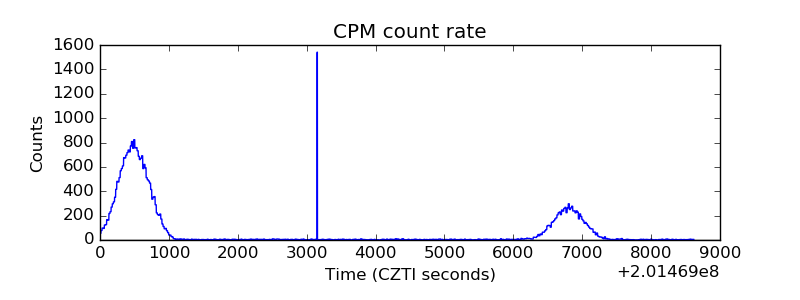 |
| CZT Counter | 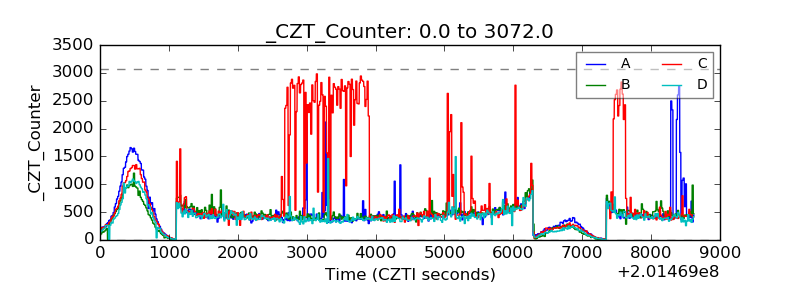 |
| +2.5 Volts monitor |  |
| +5 Volts monitor |  |
| Veto Counter | 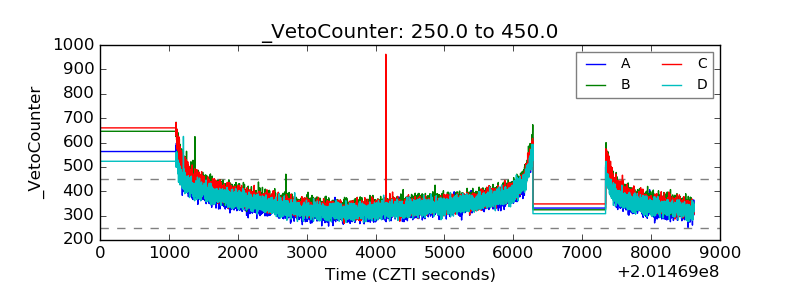 |