| Param | Original file | Final file |
|---|---|---|
| Filename | modeM0/AS1G05_245T01_9000000460_03492cztM0_level2.evt | modeM0/AS1G05_245T01_9000000460_03492cztM0_level2_quad_clean.evt |
| Size (bytes) | 546,822,720 | 85,527,360 |
| Size | 521.5 MB | 81.6 MB |
| Events in quadrant A | 4,600,589 | 515,446 |
| Events in quadrant B | 3,856,459 | 520,084 |
| Events in quadrant C | 4,179,800 | 513,244 |
| Events in quadrant D | 3,400,699 | 505,204 |
| Mode M0 | |||
|---|---|---|---|
| Quadrant | BADHDUFLAG | Total packets | Discarded packets |
| A | 0 | 19194 | 5 |
| B | 0 | 16706 | 4 |
| C | 0 | 17997 | 4 |
| D | 0 | 16258 | 4 |
| Mode SS | |||
|---|---|---|---|
| Quadrant | BADHDUFLAG | Total packets | Discarded packets |
| A | 0 | 156 | 0 |
| B | 0 | 156 | 0 |
| C | 0 | 156 | 0 |
| D | 0 | 156 | 0 |
| Mode M9 | |||
|---|---|---|---|
| Quadrant | BADHDUFLAG | Total packets | Discarded packets |
| A | 0 | 3 | 0 |
| B | 0 | 3 | 0 |
| C | 0 | 3 | 0 |
| D | 0 | 4 | 0 |
| Quadrant | Total seconds | Saturated seconds | Saturation percentage |
|---|---|---|---|
| A | 7695 | 354 | 4.600390% |
| B | 7695 | 169 | 2.196231% |
| C | 7695 | 282 | 3.664717% |
| D | 7695 | 49 | 0.636777% |
Noise dominated data is calculated using 1-second bins in cleaned event files. If a bin has >2000 counts, and if more than 50% of those come from <1% of pixels, then it is considered to be noise-dominated and hence unusable.
| Quadrant | # 1 sec bins | Bins with >0 counts | Bins with >2000 counts | High rate bins dominated by noise | Noise dominated (total time) | Noise dominated (detector-on time) | Marked lightcurve |
|---|---|---|---|---|---|---|---|
| A | 7825 | 7698 | 223 | 223 | 2.85% | 2.90% | 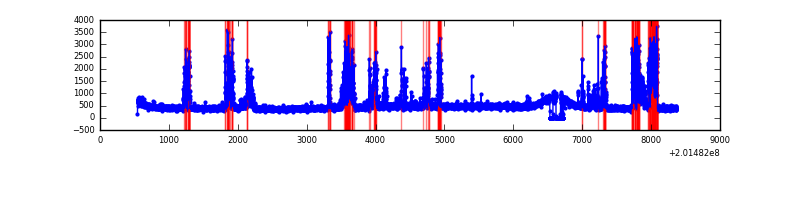 |
| B | 7825 | 7698 | 34 | 34 | 0.43% | 0.44% | 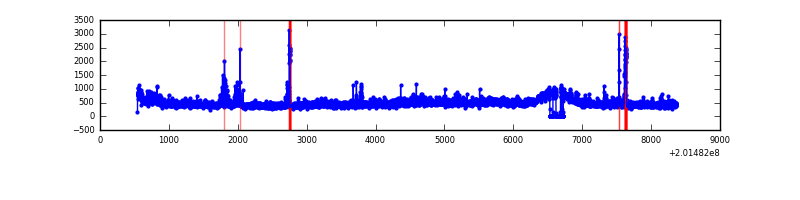 |
| C | 7825 | 7698 | 173 | 173 | 2.21% | 2.25% |  |
| D | 7825 | 7698 | 20 | 20 | 0.26% | 0.26% | 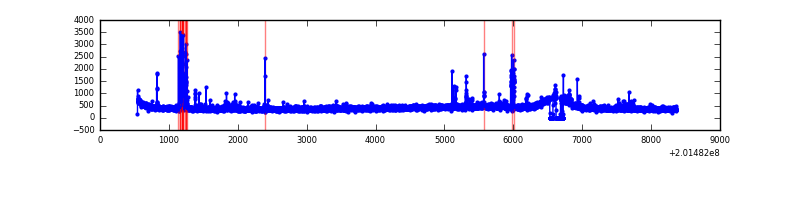 |
Top three noisy pixels from each quadrant. If the there are fewer than three noisy pixels in the level2.evt file, extra rows are filled as -1
| Pixel properties | Quadrant properties | ||||||
|---|---|---|---|---|---|---|---|
| Quadrant | DetID | PixID | Counts | Sigma | Mean | Median | Sigma |
| A | 0 | 50 | 1277488 | 7218.04 | 856 | 833 | 176.9 |
| A | 8 | 15 | 13137 | 69.57 | 856 | 833 | 176.9 |
| A | 12 | 194 | 9001 | 46.18 | 856 | 833 | 176.9 |
| B | 15 | 204 | 210303 | 1231.52 | 878 | 855 | 170.1 |
| B | 4 | 81 | 187764 | 1098.99 | 878 | 855 | 170.1 |
| B | 0 | 229 | 20344 | 114.59 | 878 | 855 | 170.1 |
| C | 7 | 220 | 661528 | 3372.27 | 837 | 841 | 195.9 |
| C | 1 | 16 | 81347 | 410.92 | 837 | 841 | 195.9 |
| C | 1 | 192 | 48777 | 244.67 | 837 | 841 | 195.9 |
| D | 13 | 223 | 150399 | 725.54 | 842 | 816 | 206.2 |
| D | 13 | 239 | 21302 | 99.37 | 842 | 816 | 206.2 |
| D | 3 | 247 | 18910 | 87.76 | 842 | 816 | 206.2 |
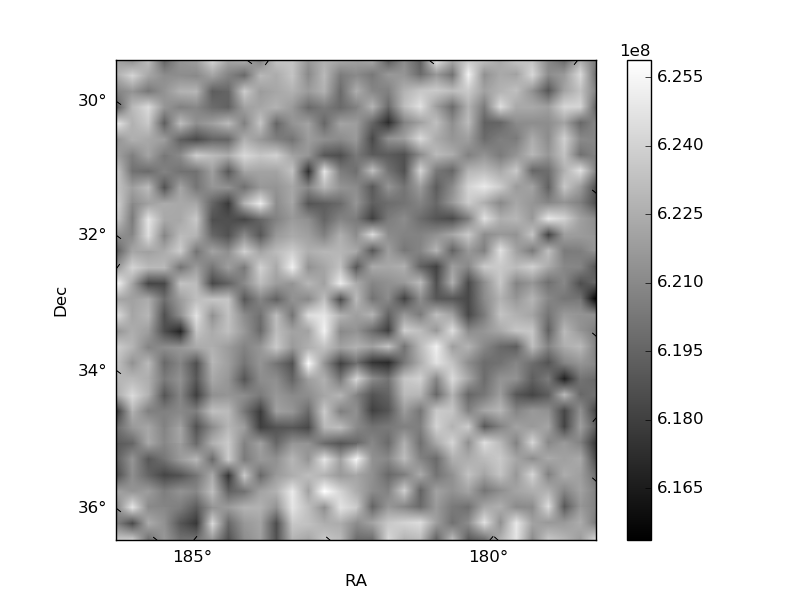
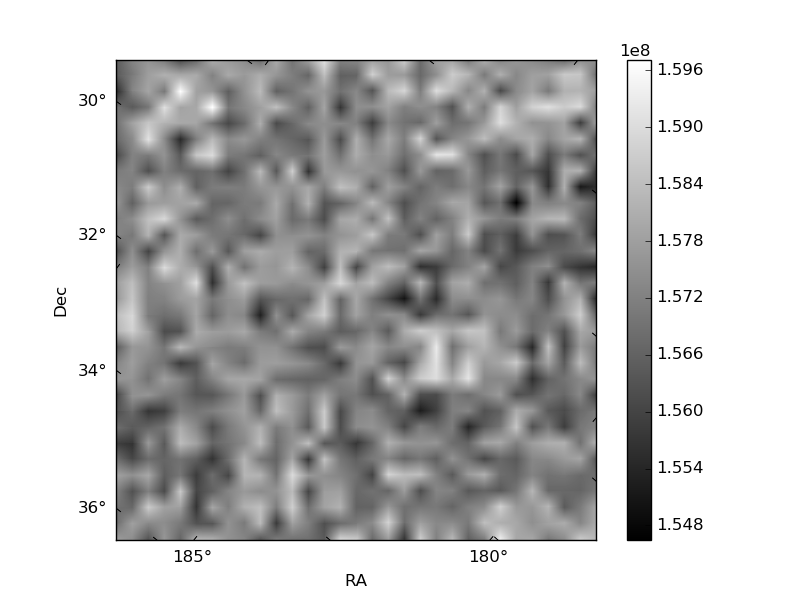
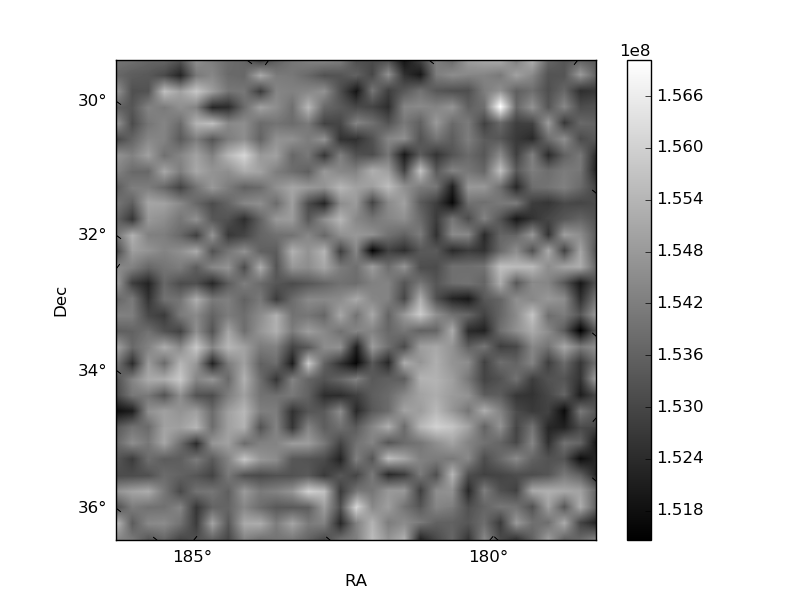
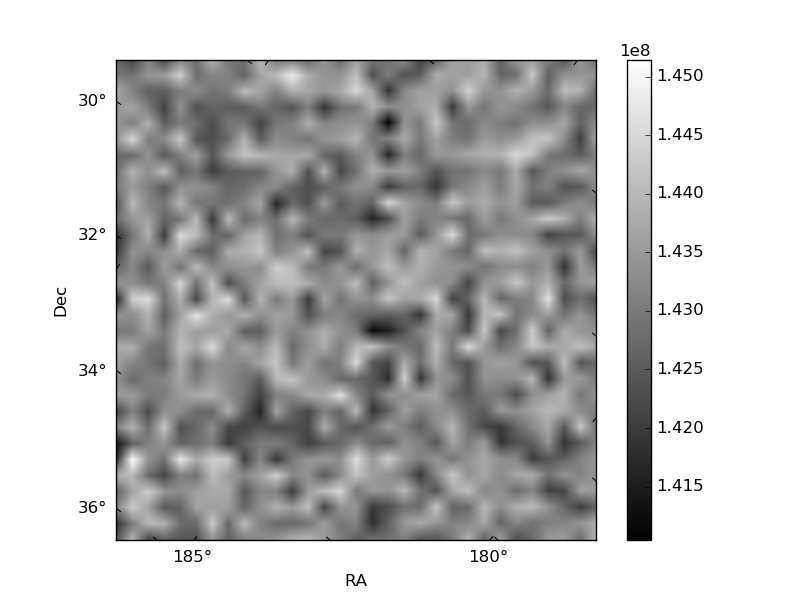
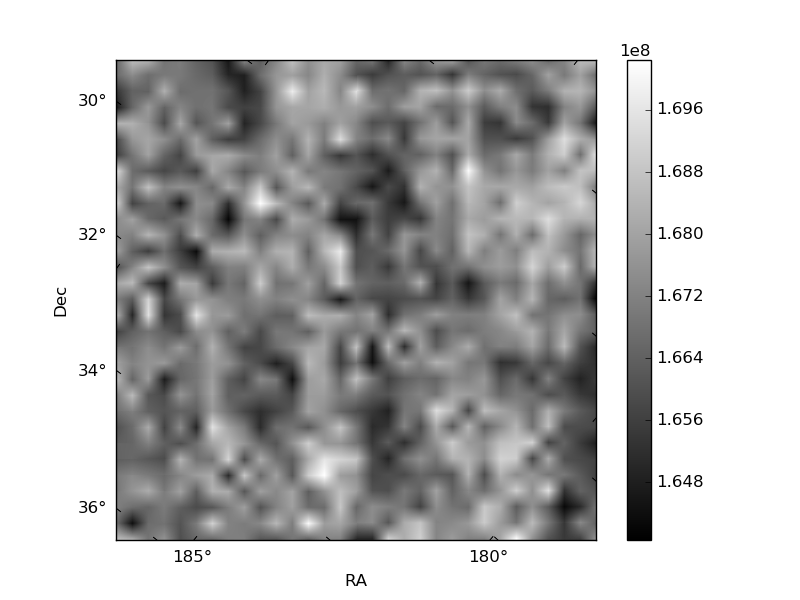
Histogram calculated using DETX and DETY for each event in the final _common_clean file
| Quadrant A | 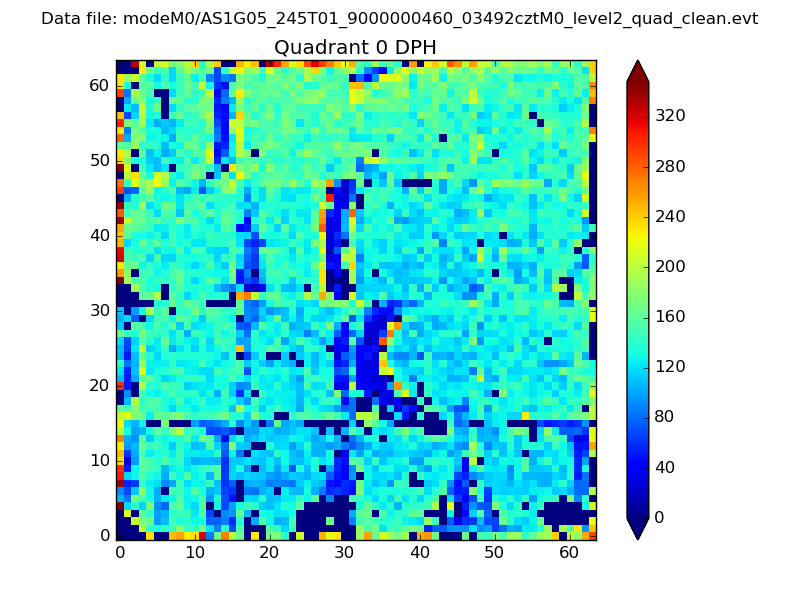 |
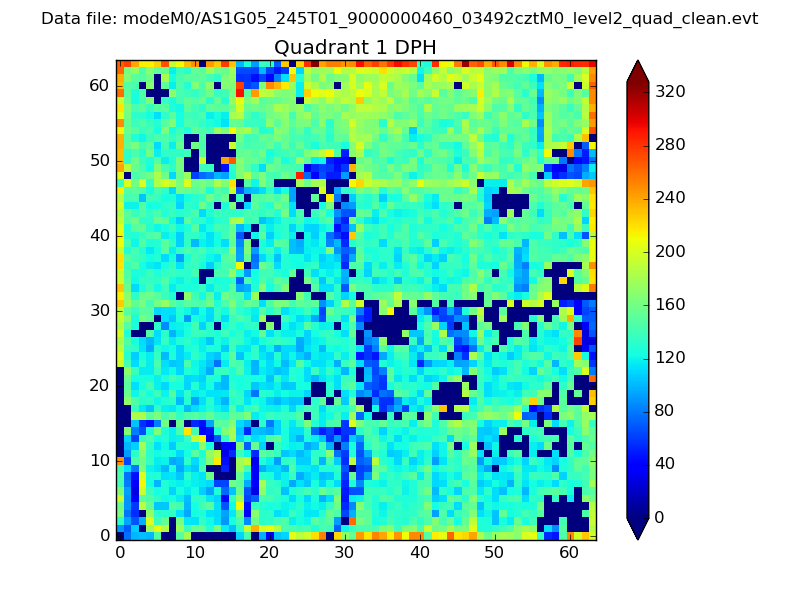 |
Quadrant B |
|---|---|---|---|
| Quadrant D | 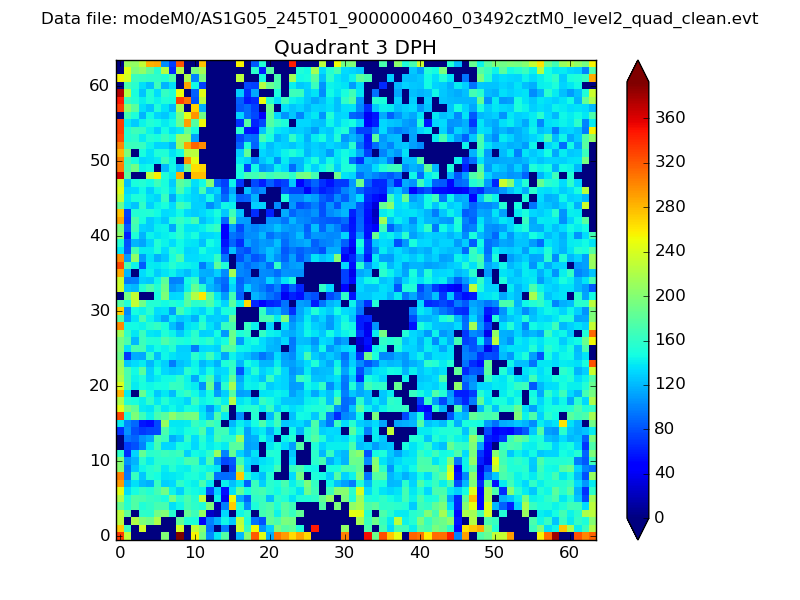 |
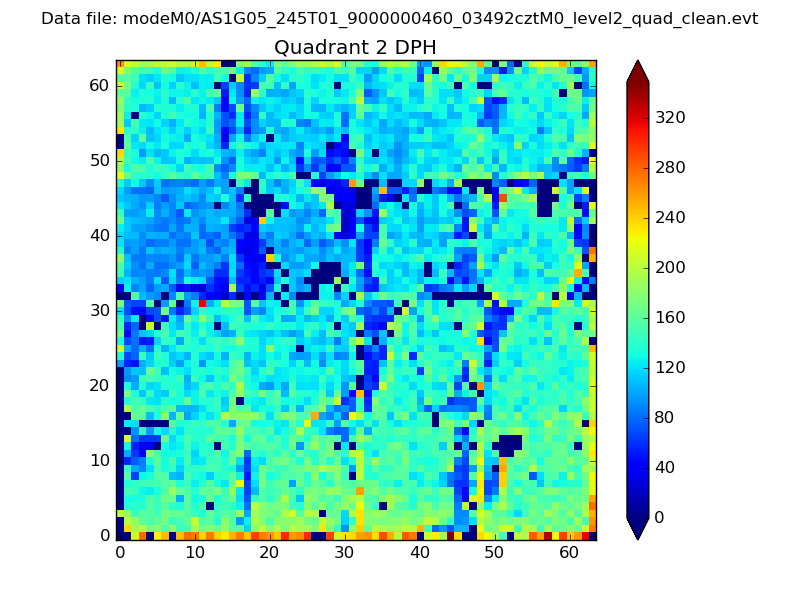 |
Quadrant C |
| Plot type | Count rate plots | Images |
|---|---|---|
| Comparison with Poisson distribution Blue bars denote a histogram of data divided into 1 sec bins. Red curve is a Poisson curve with rate = median count rate of data. |
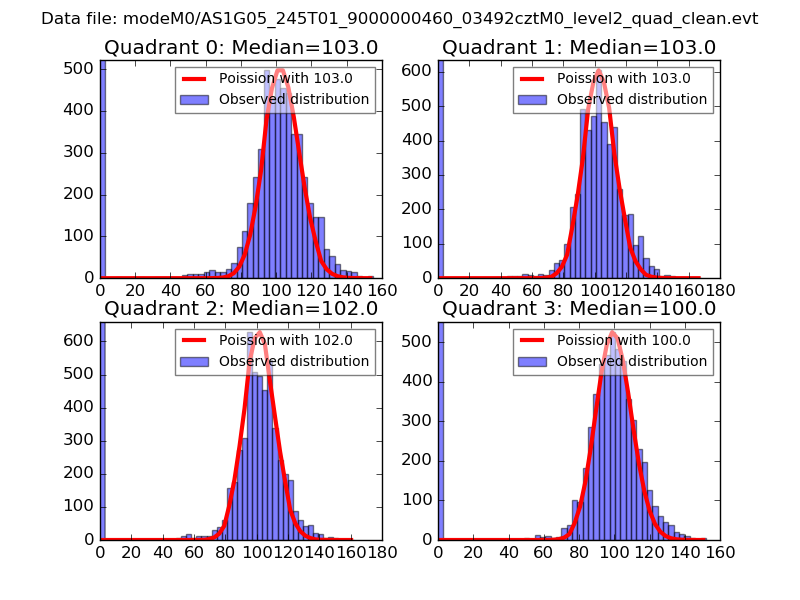 |
 |
| Quadrant-wise count rates Data is divided into 100 sec bins |
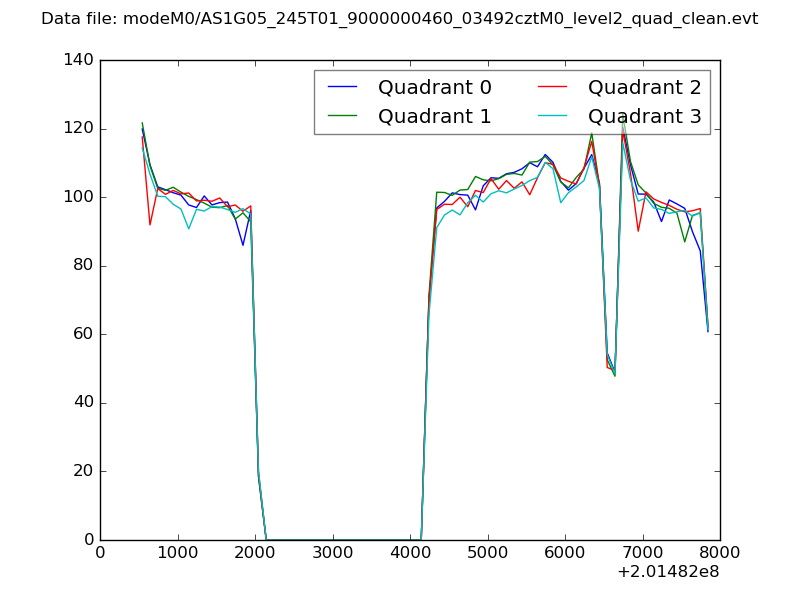 |
|
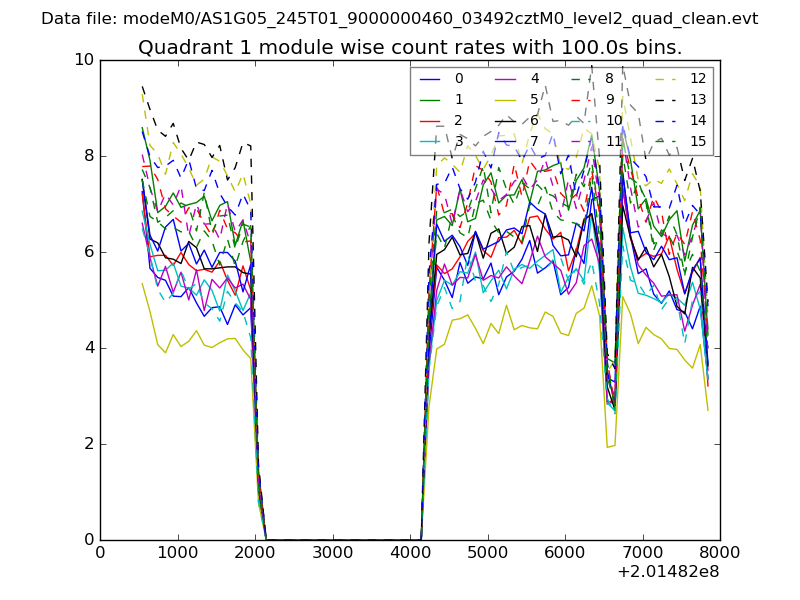
| Module-wise count rates for Quadrant A Data is divided into 100 sec bins |
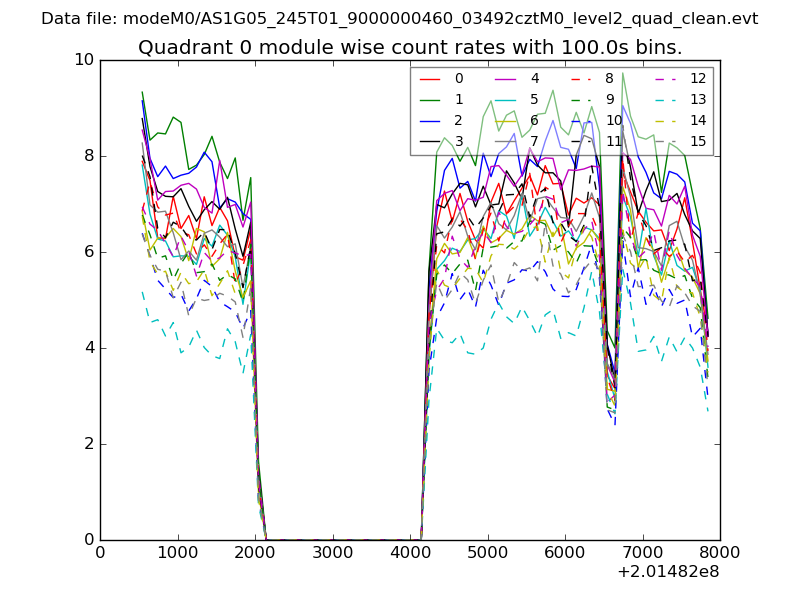 |
 |
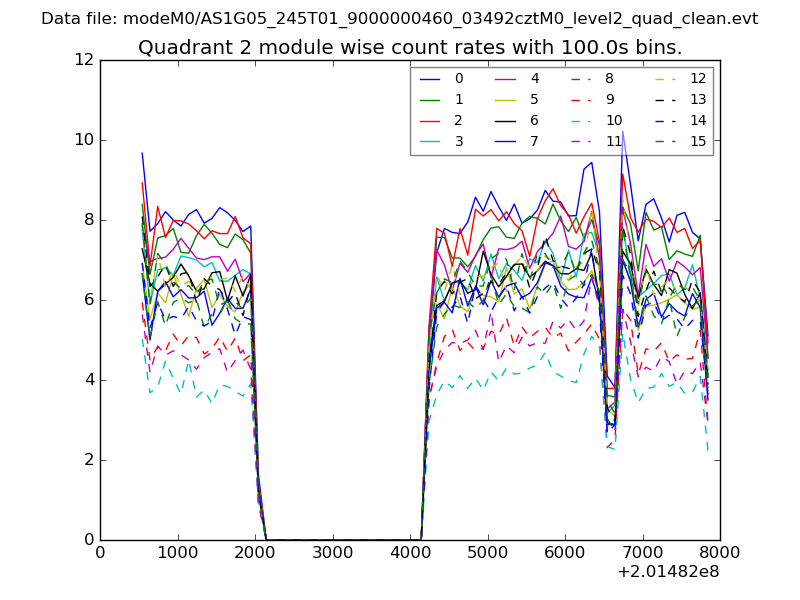
| Module-wise count rates for Quadrant B Data is divided into 100 sec bins |
 |
 |
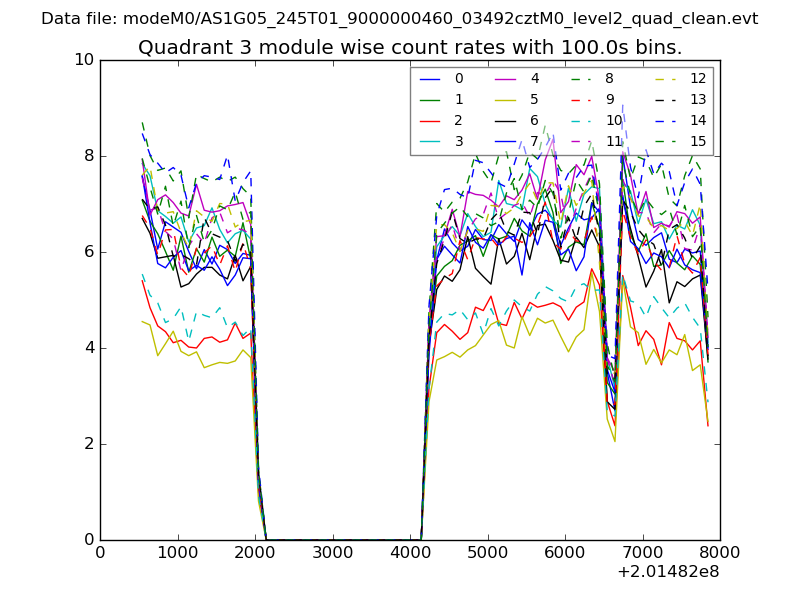
| Module-wise count rates for Quadrant C Data is divided into 100 sec bins |
 |
 |
| Module-wise count rates for Quadrant D Data is divided into 100 sec bins |
 |
 |
| Parameter | Plot |
|---|---|
| CZT HV Monitor | 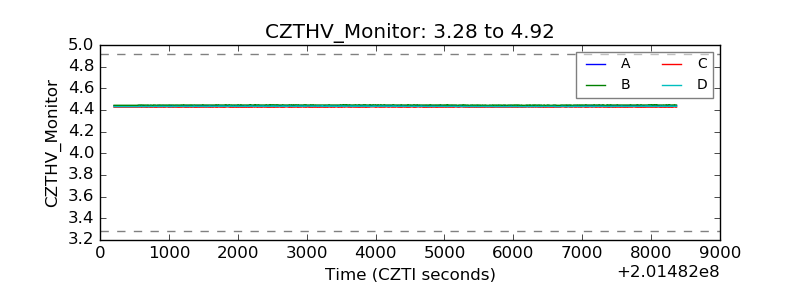 |
| D_VDD | 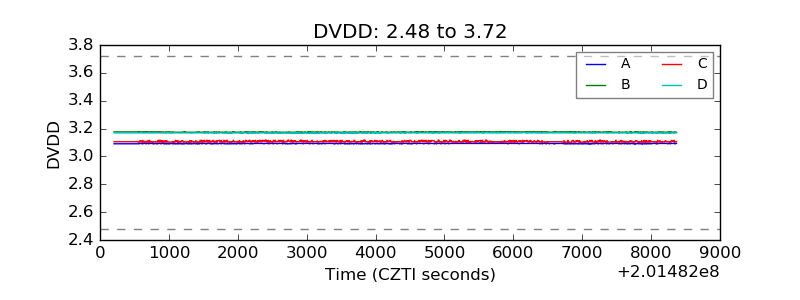 |
| Temperature 1 | 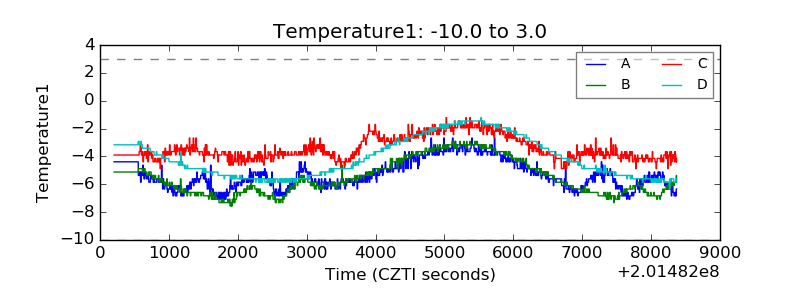 |
| Veto HV Monitor | 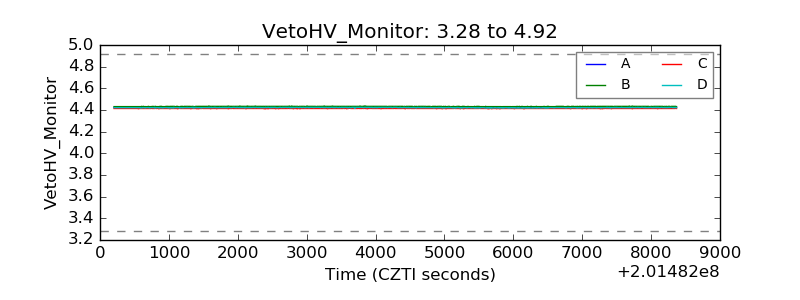 |
| Veto LLD | 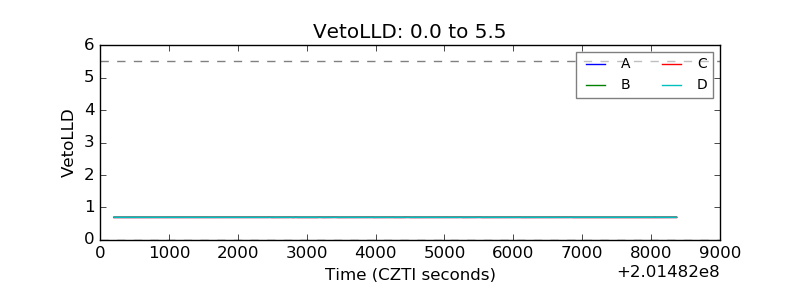 |
| Alpha Counter | 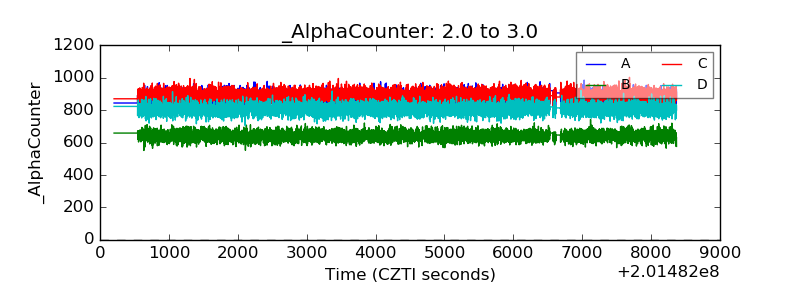 |
| _CPM_Rate | 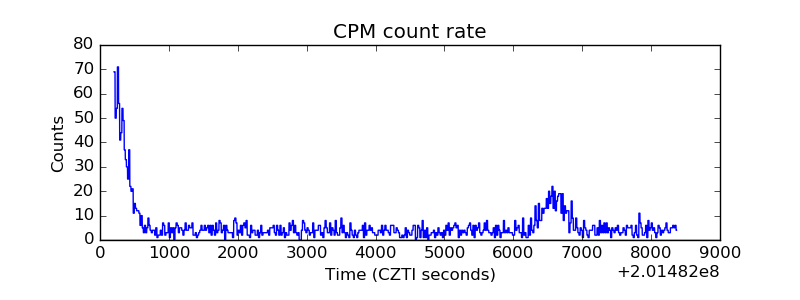 |
| CZT Counter |  |
| +2.5 Volts monitor |  |
| +5 Volts monitor |  |
| Veto Counter | 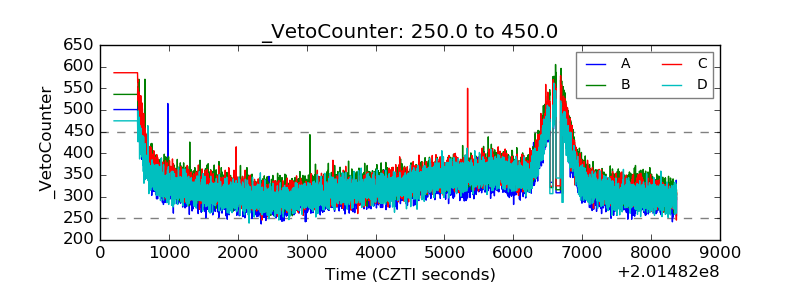 |