| Param | Original file | Final file |
|---|---|---|
| Filename | modeM0/AS1G05_245T01_9000000460_03494cztM0_level2.evt | modeM0/AS1G05_245T01_9000000460_03494cztM0_level2_quad_clean.evt |
| Size (bytes) | 456,523,200 | 69,598,080 |
| Size | 435.4 MB | 66.4 MB |
| Events in quadrant A | 3,445,252 | 422,443 |
| Events in quadrant B | 4,092,745 | 407,571 |
| Events in quadrant C | 3,034,933 | 422,312 |
| Events in quadrant D | 2,821,502 | 412,155 |
| Mode M0 | |||
|---|---|---|---|
| Quadrant | BADHDUFLAG | Total packets | Discarded packets |
| A | 0 | 14774 | 1 |
| B | 0 | 16419 | 1 |
| C | 0 | 13728 | 1 |
| D | 0 | 13438 | 1 |
| Mode SS | |||
|---|---|---|---|
| Quadrant | BADHDUFLAG | Total packets | Discarded packets |
| A | 0 | 128 | 0 |
| B | 0 | 128 | 0 |
| C | 0 | 128 | 0 |
| D | 0 | 128 | 0 |
| Quadrant | Total seconds | Saturated seconds | Saturation percentage |
|---|---|---|---|
| A | 6336 | 220 | 3.472222% |
| B | 6336 | 532 | 8.396465% |
| C | 6336 | 132 | 2.083333% |
| D | 6336 | 99 | 1.562500% |
Noise dominated data is calculated using 1-second bins in cleaned event files. If a bin has >2000 counts, and if more than 50% of those come from <1% of pixels, then it is considered to be noise-dominated and hence unusable.
| Quadrant | # 1 sec bins | Bins with >0 counts | Bins with >2000 counts | High rate bins dominated by noise | Noise dominated (total time) | Noise dominated (detector-on time) | Marked lightcurve |
|---|---|---|---|---|---|---|---|
| A | 6380 | 6336 | 52 | 52 | 0.82% | 0.82% | 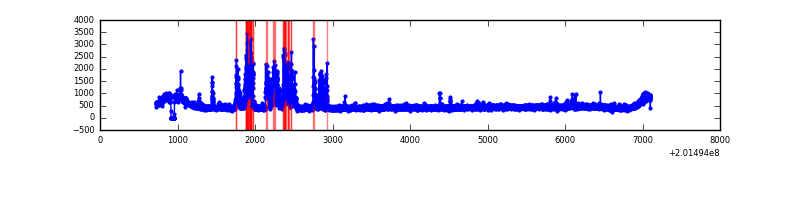 |
| B | 6380 | 6336 | 219 | 219 | 3.43% | 3.46% | 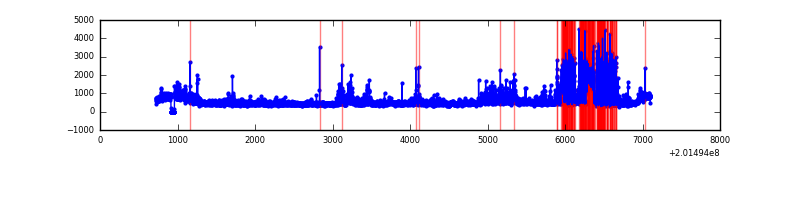 |
| C | 6381 | 6337 | 24 | 24 | 0.38% | 0.38% | 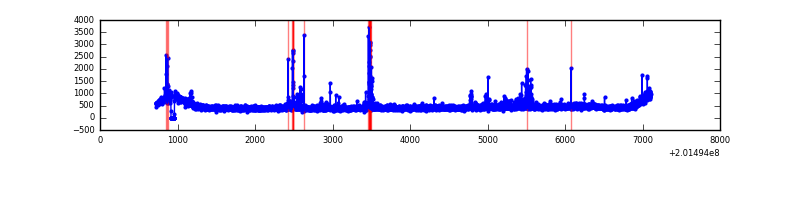 |
| D | 6381 | 6337 | 16 | 16 | 0.25% | 0.25% | 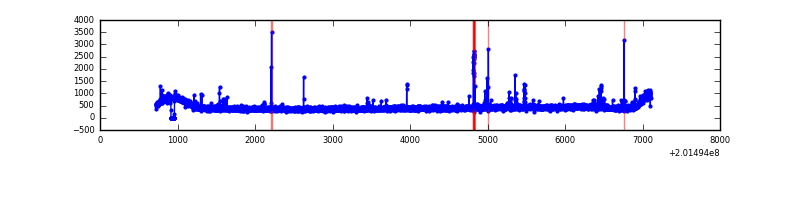 |
Top three noisy pixels from each quadrant. If the there are fewer than three noisy pixels in the level2.evt file, extra rows are filled as -1
| Pixel properties | Quadrant properties | ||||||
|---|---|---|---|---|---|---|---|
| Quadrant | DetID | PixID | Counts | Sigma | Mean | Median | Sigma |
| A | 0 | 50 | 567925 | 3692.49 | 736 | 718 | 153.6 |
| A | 0 | 118 | 19010 | 119.08 | 736 | 718 | 153.6 |
| A | 8 | 15 | 15447 | 95.89 | 736 | 718 | 153.6 |
| B | 4 | 81 | 897703 | 6121.74 | 732 | 712 | 146.5 |
| B | 15 | 204 | 291784 | 1986.49 | 732 | 712 | 146.5 |
| B | 15 | 85 | 29585 | 197.05 | 732 | 712 | 146.5 |
| C | 7 | 220 | 143516 | 839.61 | 721 | 725 | 170.1 |
| C | 9 | 54 | 20702 | 117.46 | 721 | 725 | 170.1 |
| C | 1 | 16 | 18828 | 106.45 | 721 | 725 | 170.1 |
| D | 13 | 223 | 59940 | 333.92 | 719 | 696 | 177.4 |
| D | 13 | 239 | 15707 | 84.6 | 719 | 696 | 177.4 |
| D | 10 | 172 | 12889 | 68.72 | 719 | 696 | 177.4 |
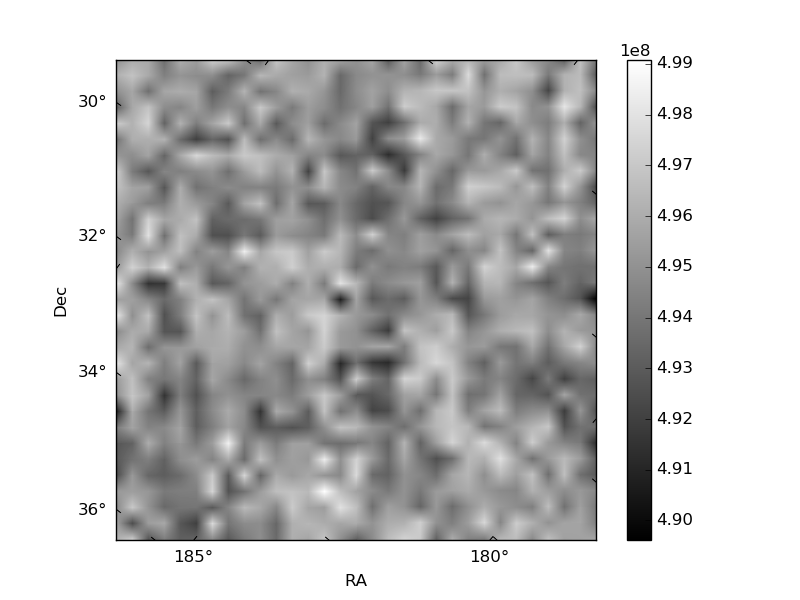
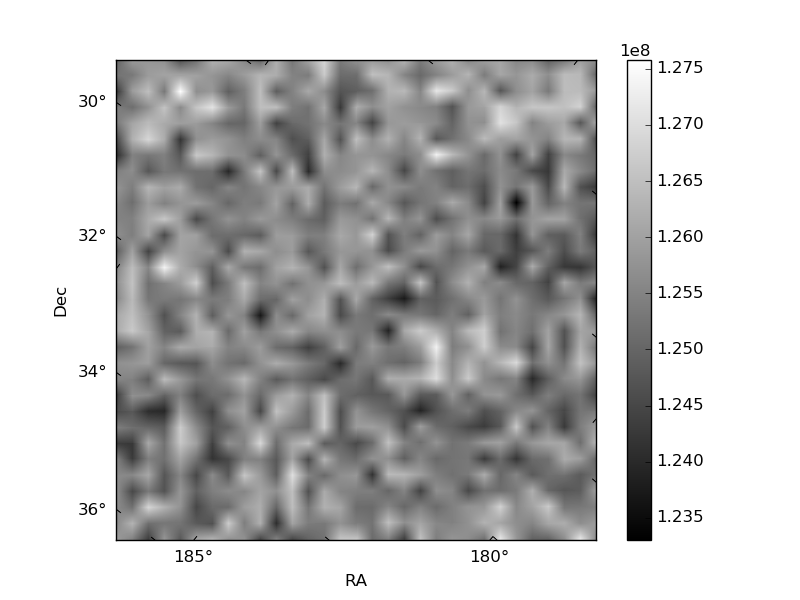
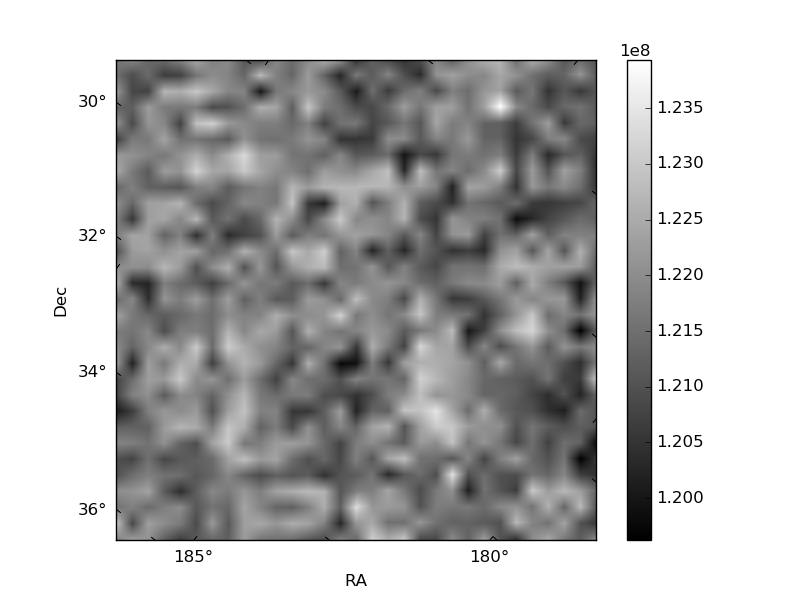
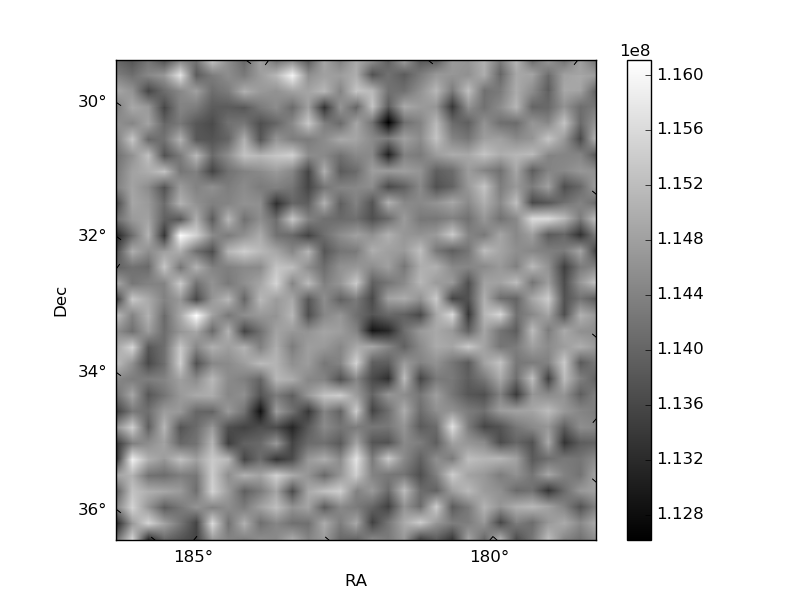
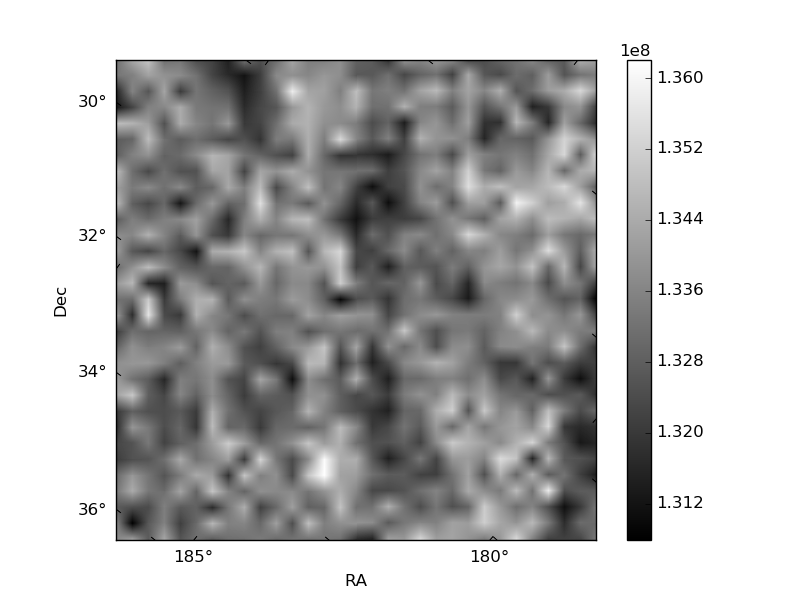
Histogram calculated using DETX and DETY for each event in the final _common_clean file
| Quadrant A | 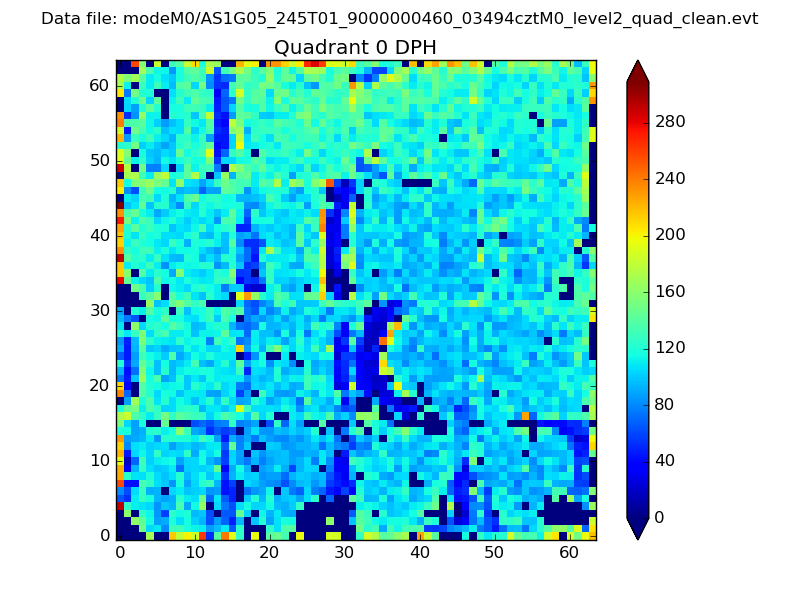 |
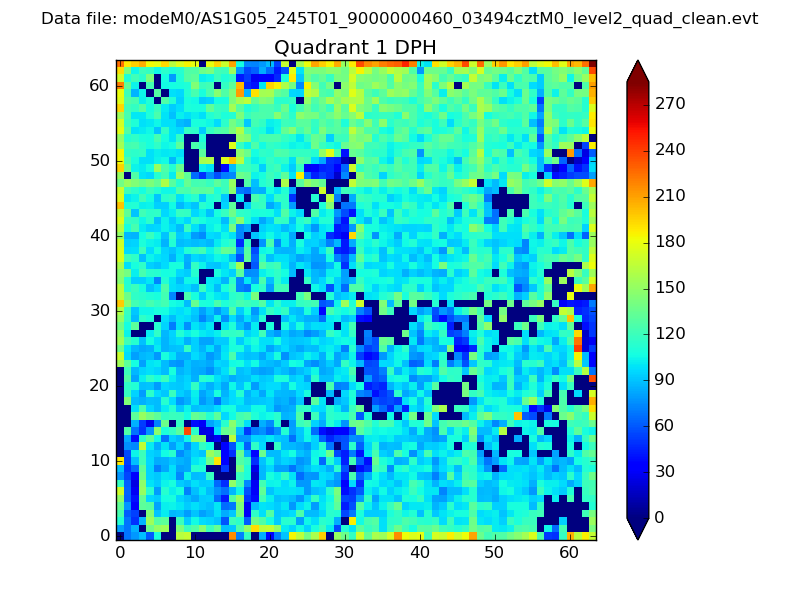 |
Quadrant B |
|---|---|---|---|
| Quadrant D | 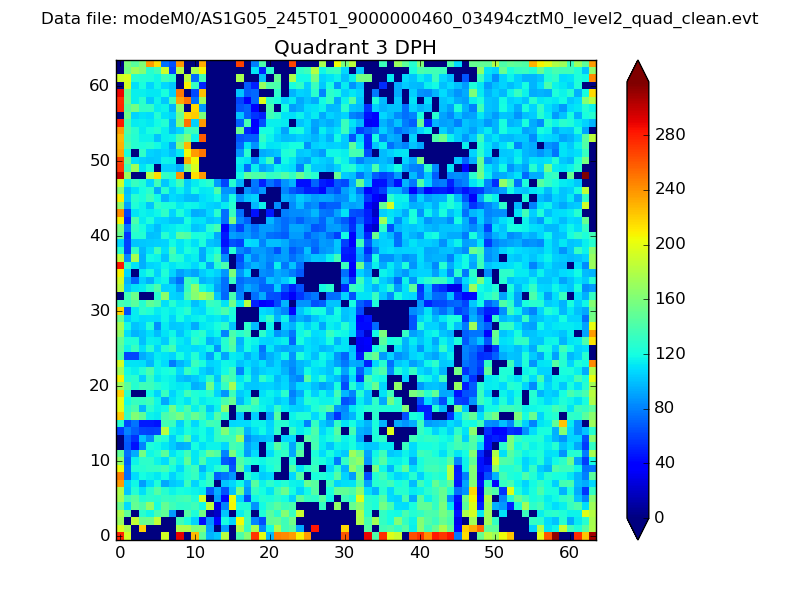 |
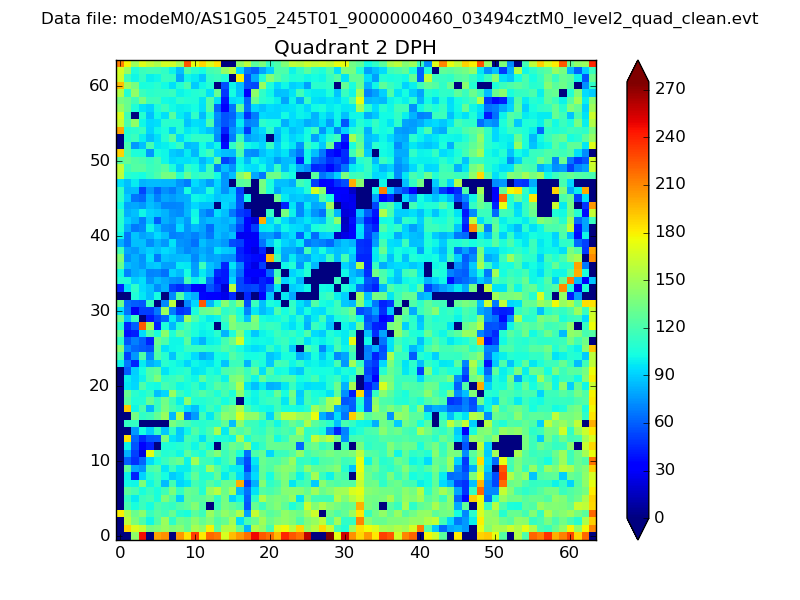 |
Quadrant C |
| Plot type | Count rate plots | Images |
|---|---|---|
| Comparison with Poisson distribution Blue bars denote a histogram of data divided into 1 sec bins. Red curve is a Poisson curve with rate = median count rate of data. |
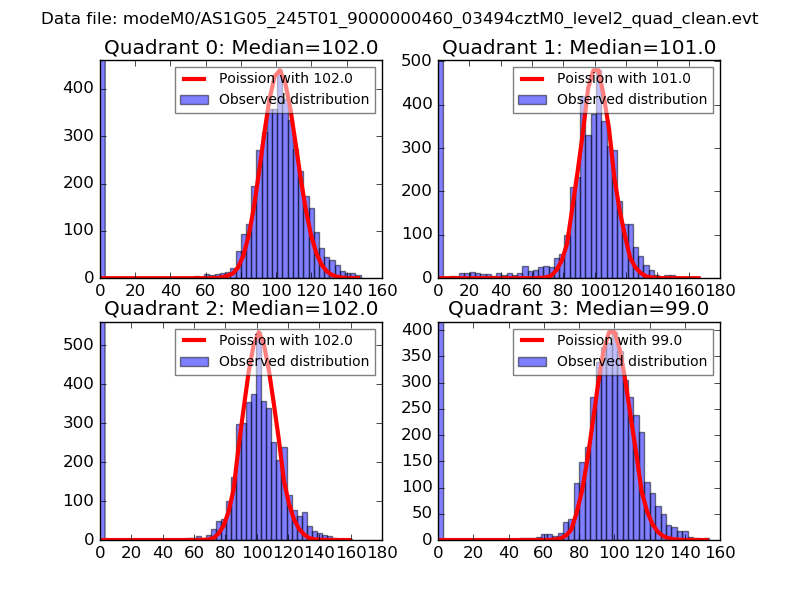 |
 |
| Quadrant-wise count rates Data is divided into 100 sec bins |
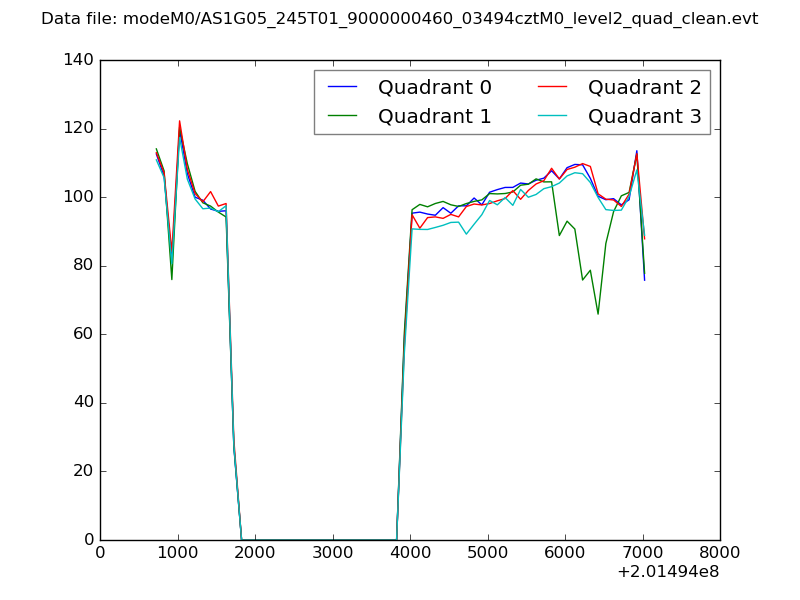 |
|
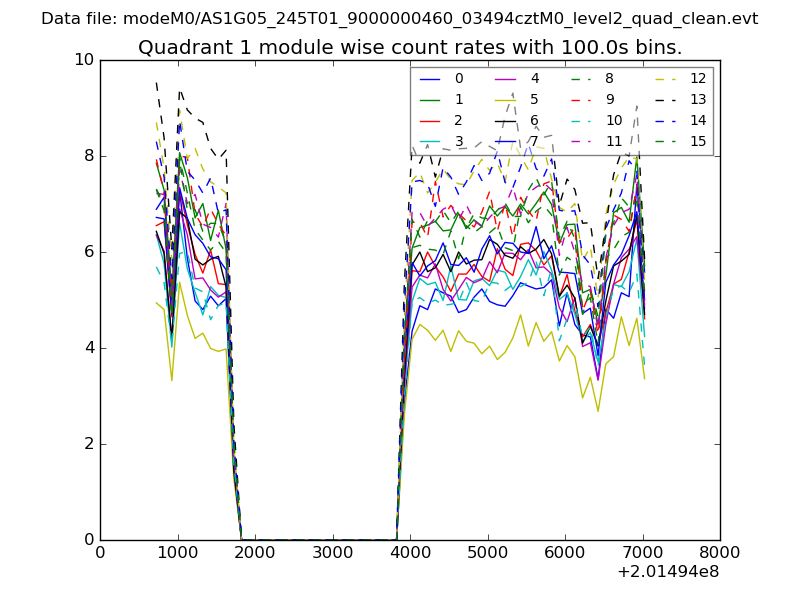
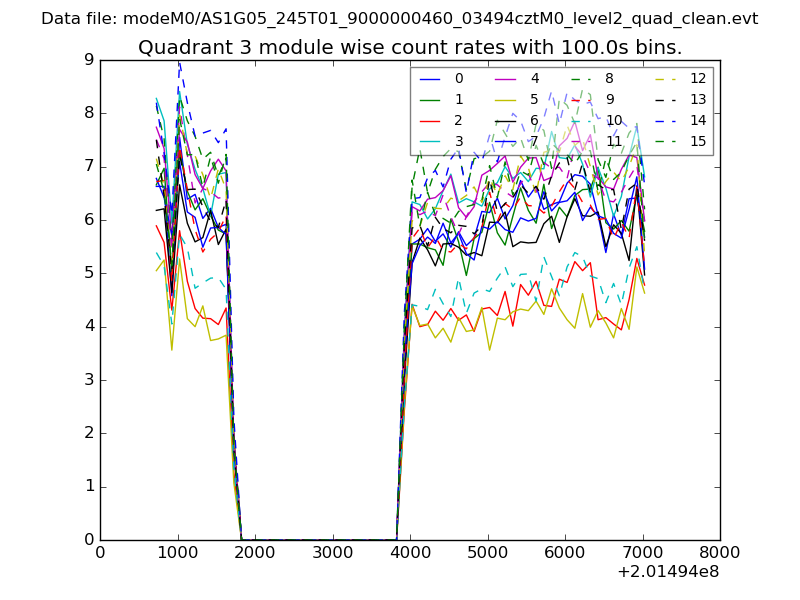
| Module-wise count rates for Quadrant A Data is divided into 100 sec bins |
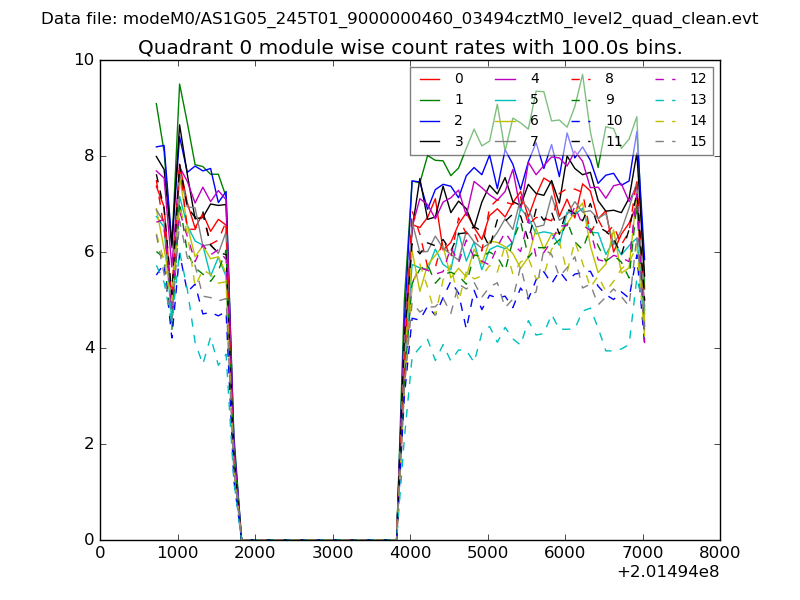 |
 |
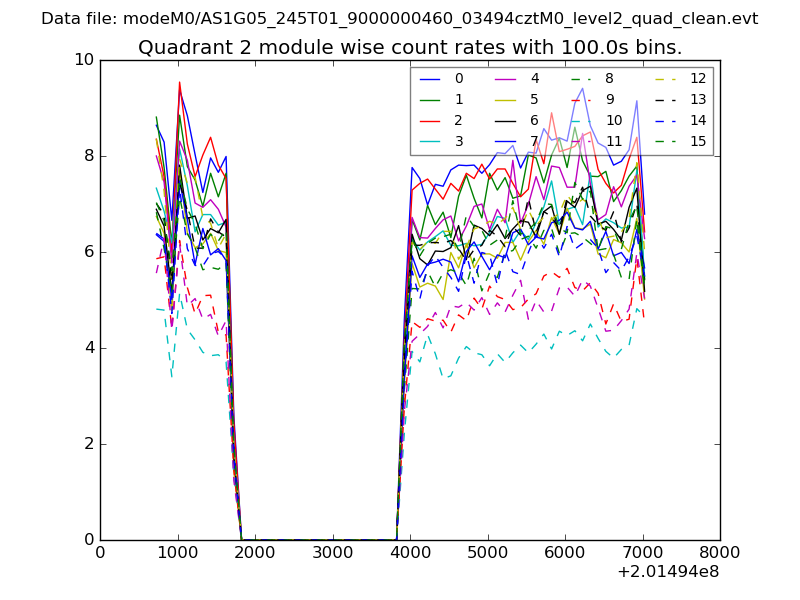
| Module-wise count rates for Quadrant B Data is divided into 100 sec bins |
 |
 |
| Module-wise count rates for Quadrant C Data is divided into 100 sec bins |
 |
 |
| Module-wise count rates for Quadrant D Data is divided into 100 sec bins |
 |
 |
| Parameter | Plot |
|---|---|
| CZT HV Monitor | 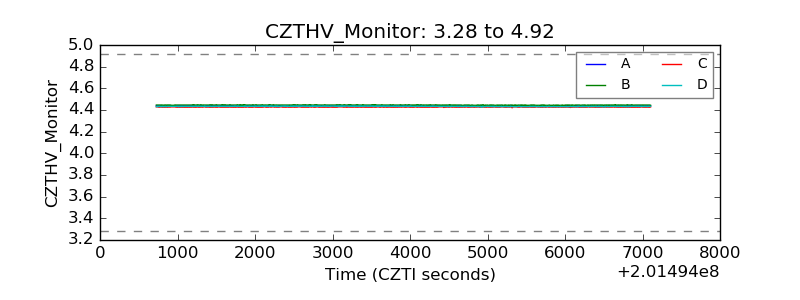 |
| D_VDD | 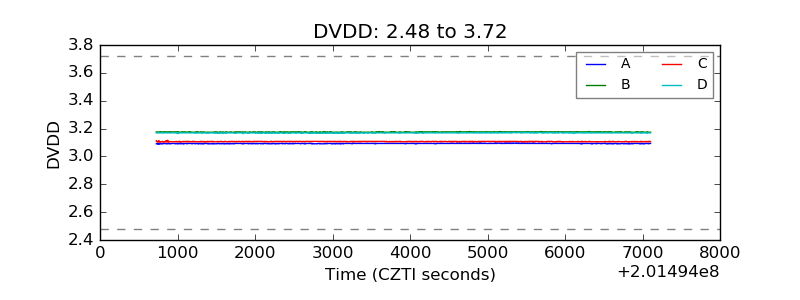 |
| Temperature 1 | 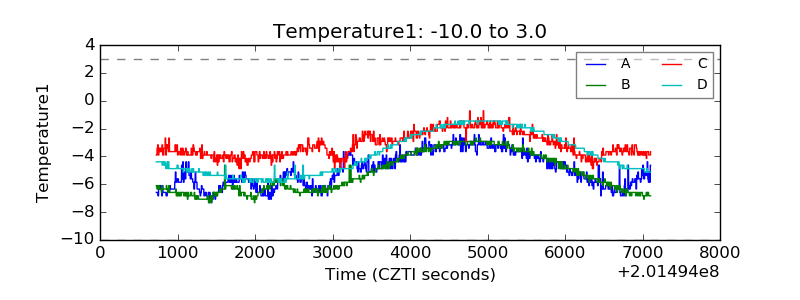 |
| Veto HV Monitor | 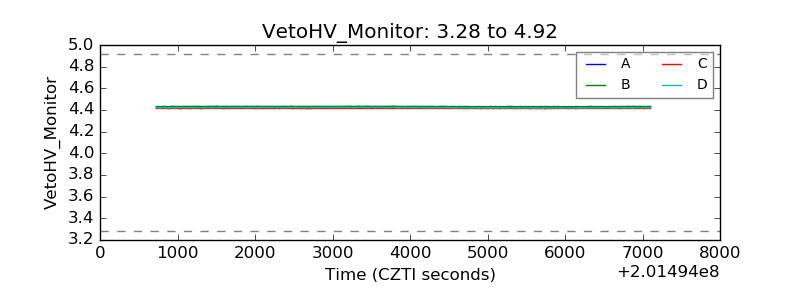 |
| Veto LLD | 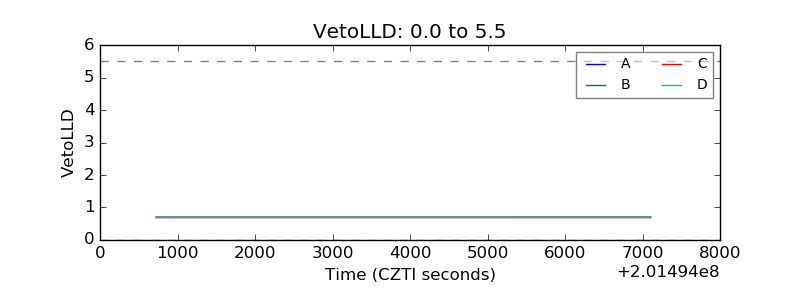 |
| Alpha Counter | 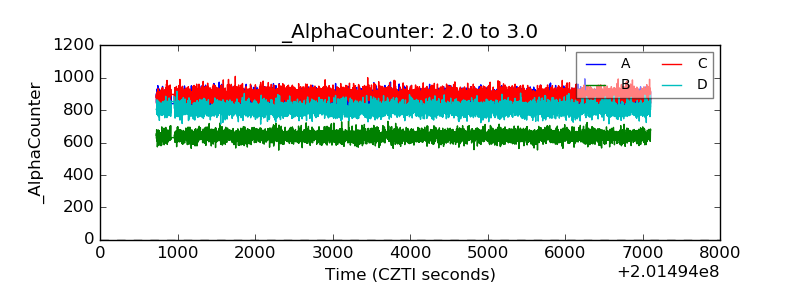 |
| _CPM_Rate | 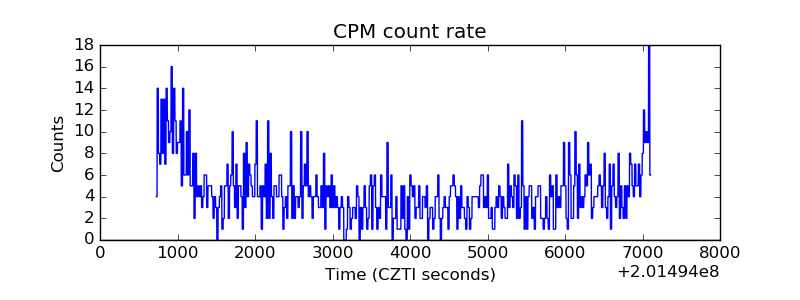 |
| CZT Counter | 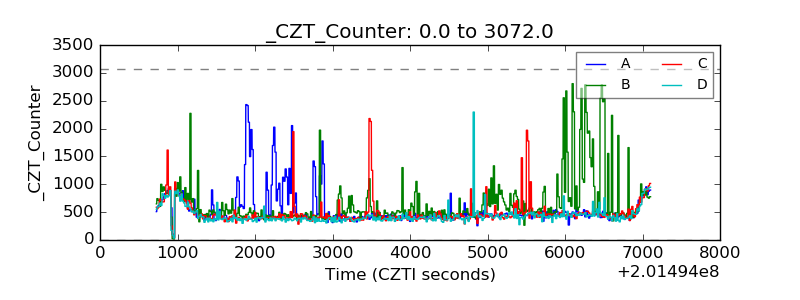 |
| +2.5 Volts monitor |  |
| +5 Volts monitor | 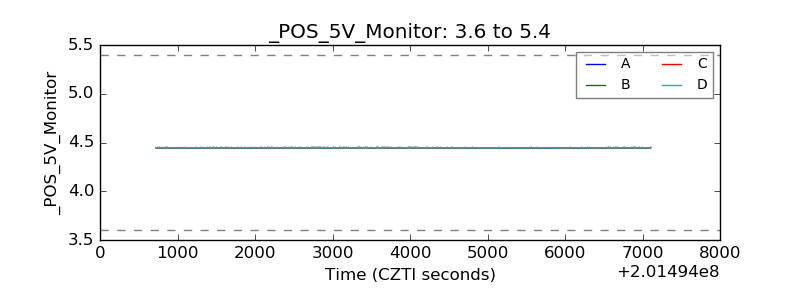 |
| Veto Counter | 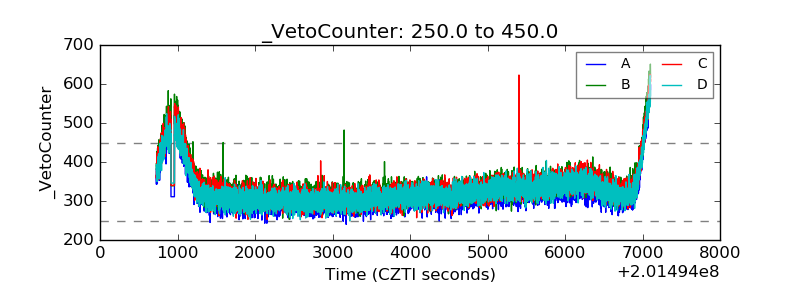 |