| Param | Original file | Final file |
|---|---|---|
| Filename | modeM0/AS1G05_245T01_9000000460_03496cztM0_level2.evt | modeM0/AS1G05_245T01_9000000460_03496cztM0_level2_quad_clean.evt |
| Size (bytes) | 30,588,480 | 6,059,520 |
| Size | 29.2 MB | 5.8 MB |
| Events in quadrant A | 216,160 | 36,615 |
| Events in quadrant B | 232,087 | 37,178 |
| Events in quadrant C | 227,754 | 38,109 |
| Events in quadrant D | 222,148 | 37,548 |
| Mode M0 | |||
|---|---|---|---|
| Quadrant | BADHDUFLAG | Total packets | Discarded packets |
| A | 0 | 890 | 0 |
| B | 0 | 921 | 0 |
| C | 0 | 931 | 0 |
| D | 0 | 922 | 0 |
| Mode SS | |||
|---|---|---|---|
| Quadrant | BADHDUFLAG | Total packets | Discarded packets |
| A | 0 | 8 | 0 |
| B | 0 | 8 | 0 |
| C | 0 | 8 | 0 |
| D | 0 | 8 | 0 |
| Quadrant | Total seconds | Saturated seconds | Saturation percentage |
|---|---|---|---|
| A | 360 | 93 | 25.833333% |
| B | 360 | 94 | 26.111111% |
| C | 360 | 74 | 20.555556% |
| D | 360 | 68 | 18.888889% |
Noise dominated data is calculated using 1-second bins in cleaned event files. If a bin has >2000 counts, and if more than 50% of those come from <1% of pixels, then it is considered to be noise-dominated and hence unusable.
| Quadrant | # 1 sec bins | Bins with >0 counts | Bins with >2000 counts | High rate bins dominated by noise | Noise dominated (total time) | Noise dominated (detector-on time) | Marked lightcurve |
|---|---|---|---|---|---|---|---|
| A | 359 | 359 | 0 | 0 | 0.00% | 0.00% | 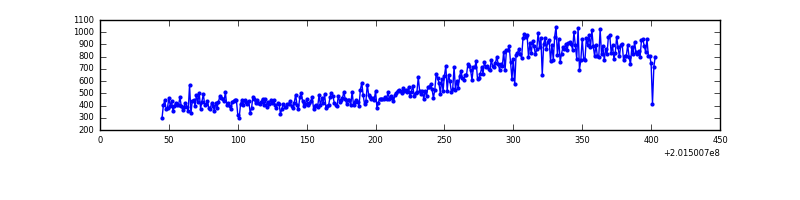 |
| B | 359 | 359 | 1 | 1 | 0.28% | 0.28% | 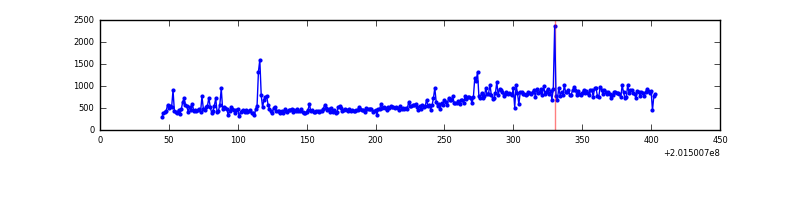 |
| C | 360 | 360 | 0 | 0 | 0.00% | 0.00% |  |
| D | 360 | 360 | 1 | 1 | 0.28% | 0.28% | 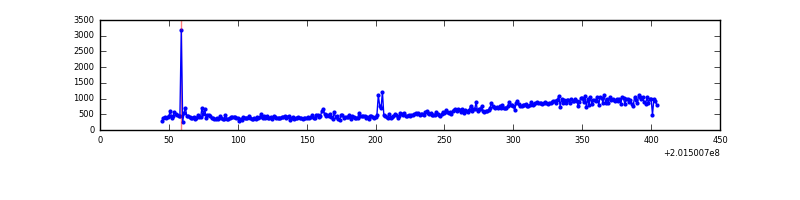 |
Top three noisy pixels from each quadrant. If the there are fewer than three noisy pixels in the level2.evt file, extra rows are filled as -1
| Pixel properties | Quadrant properties | ||||||
|---|---|---|---|---|---|---|---|
| Quadrant | DetID | PixID | Counts | Sigma | Mean | Median | Sigma |
| A | 8 | 15 | 1132 | 76.54 | 55 | 53 | 14.1 |
| A | 0 | 118 | 910 | 60.79 | 55 | 53 | 14.1 |
| A | 0 | 226 | 578 | 37.24 | 55 | 53 | 14.1 |
| B | 4 | 81 | 14297 | 1012.01 | 55 | 53 | 14.1 |
| B | 0 | 228 | 1712 | 117.87 | 55 | 53 | 14.1 |
| B | 12 | 111 | 984 | 66.15 | 55 | 53 | 14.1 |
| C | 1 | 192 | 3837 | 240.88 | 55 | 55 | 15.7 |
| C | 9 | 54 | 3088 | 193.18 | 55 | 55 | 15.7 |
| C | 15 | 208 | 2697 | 168.27 | 55 | 55 | 15.7 |
| D | 13 | 223 | 8914 | 544.1 | 56 | 53 | 16.3 |
| D | 2 | 14 | 960 | 55.69 | 56 | 53 | 16.3 |
| D | 2 | 31 | 741 | 42.25 | 56 | 53 | 16.3 |
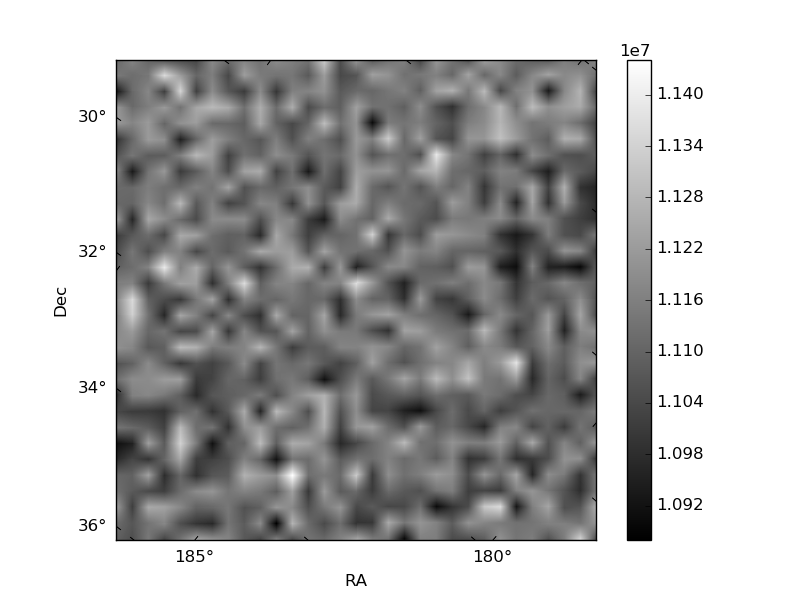
Histogram calculated using DETX and DETY for each event in the final _common_clean file
| Quadrant A | 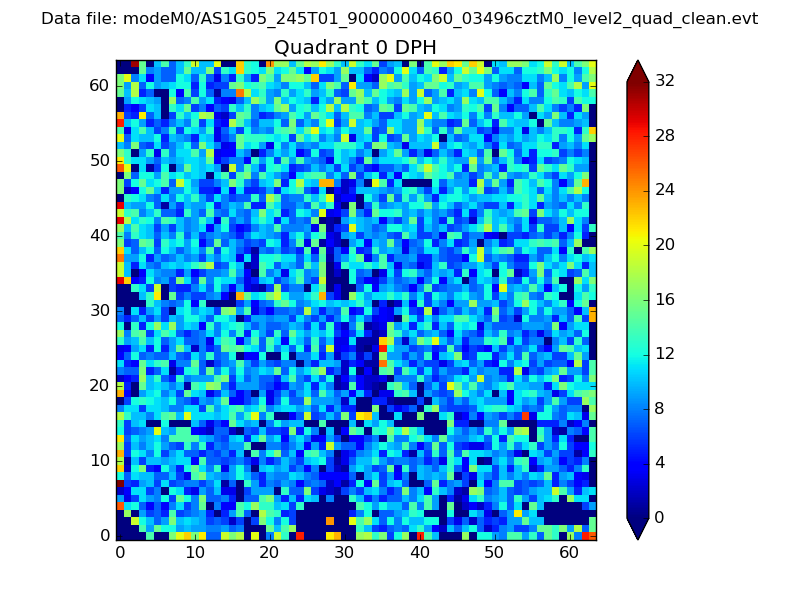 |
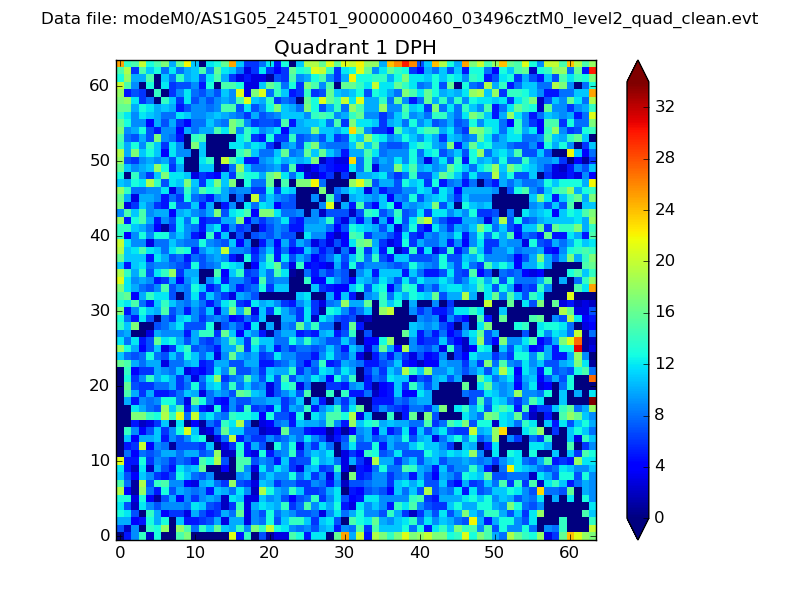 |
Quadrant B |
|---|---|---|---|
| Quadrant D | 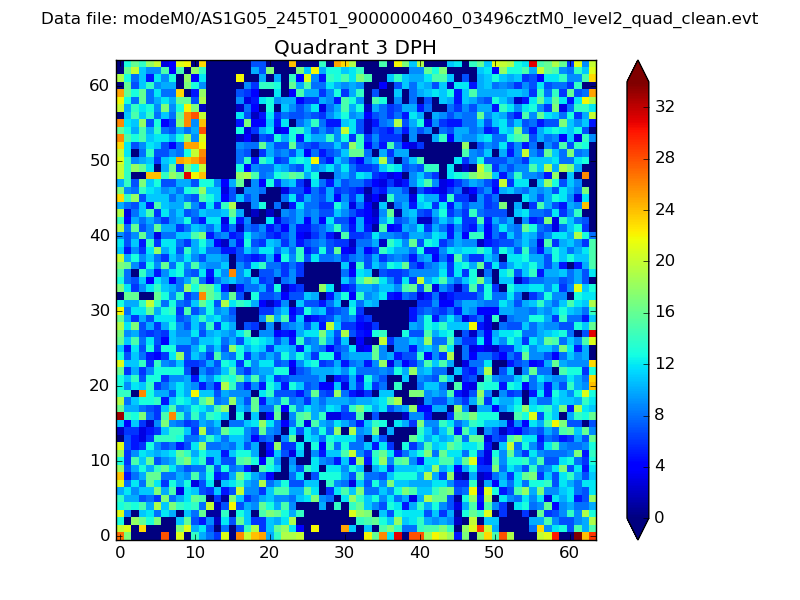 |
 |
Quadrant C |
| Plot type | Count rate plots | Images |
|---|---|---|
| Comparison with Poisson distribution Blue bars denote a histogram of data divided into 1 sec bins. Red curve is a Poisson curve with rate = median count rate of data. |
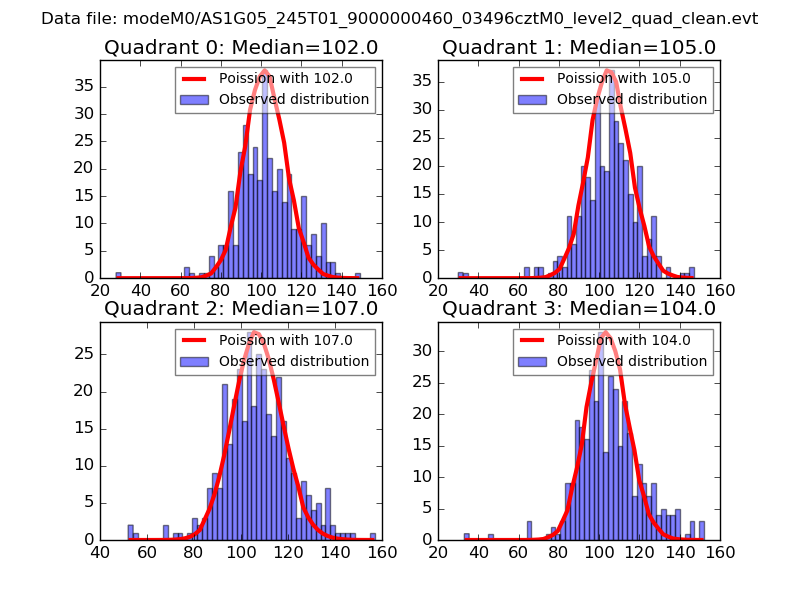 |
 |
| Quadrant-wise count rates Data is divided into 100 sec bins |
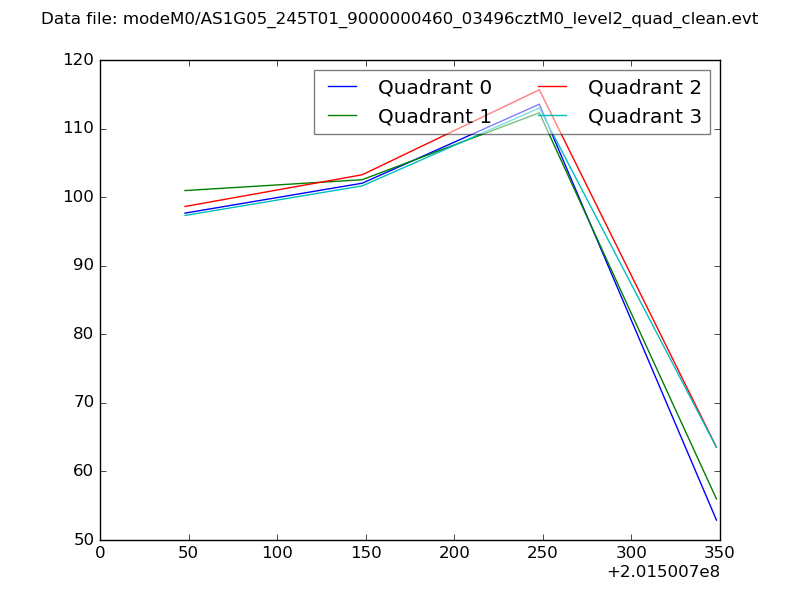 |
|
| Module-wise count rates for Quadrant A Data is divided into 100 sec bins |
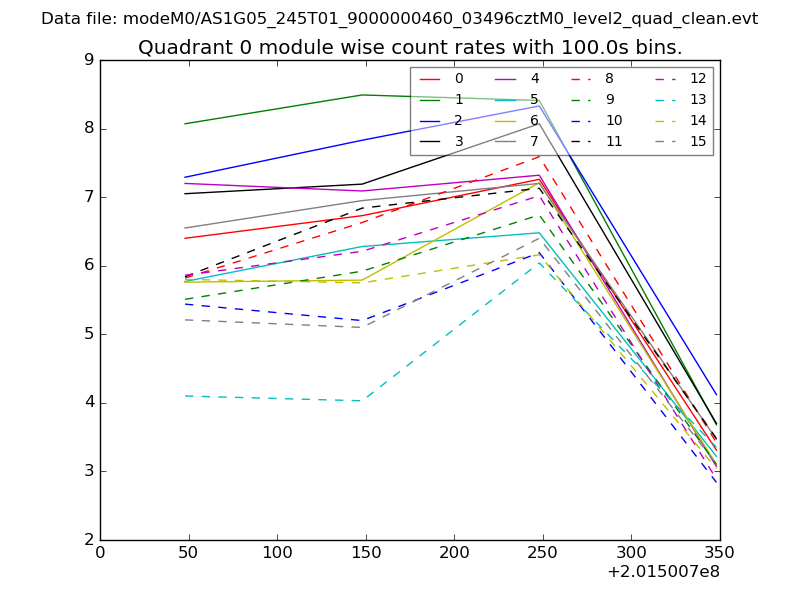 |
 |
| Module-wise count rates for Quadrant B Data is divided into 100 sec bins |
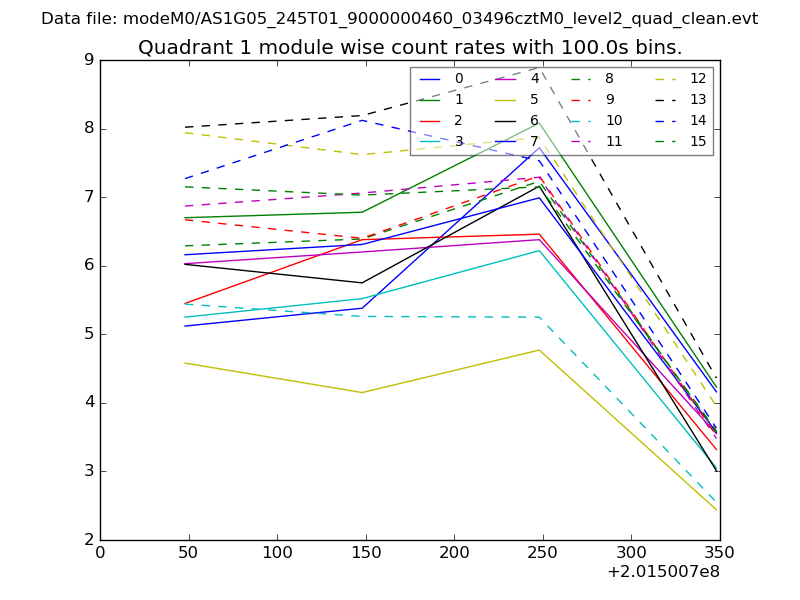 |
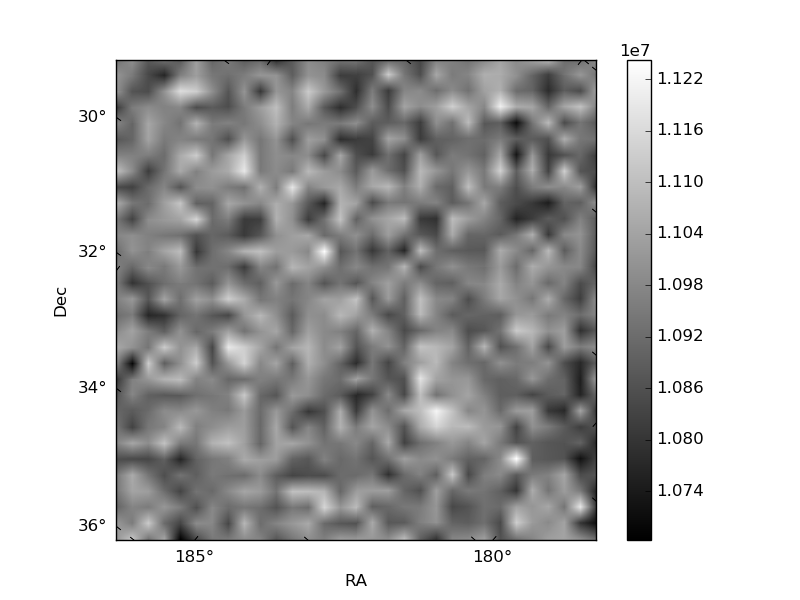 |
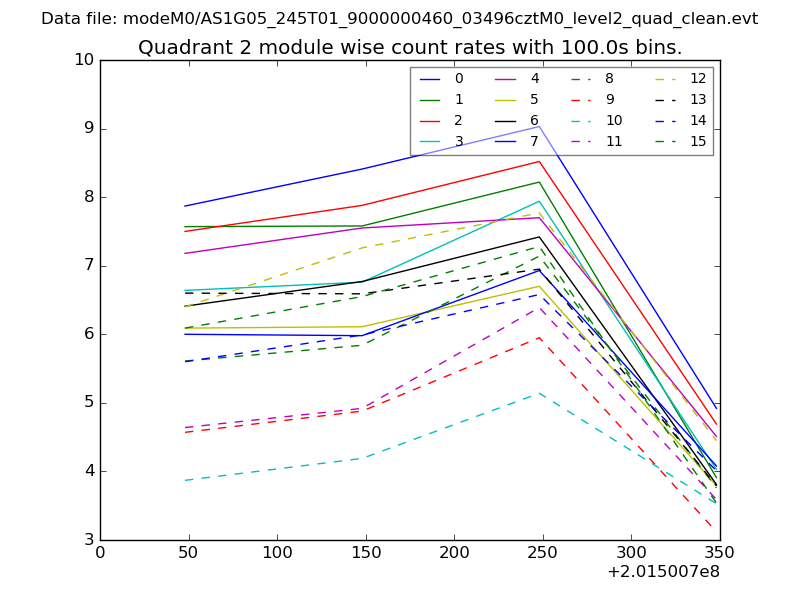
| Module-wise count rates for Quadrant C Data is divided into 100 sec bins |
 |
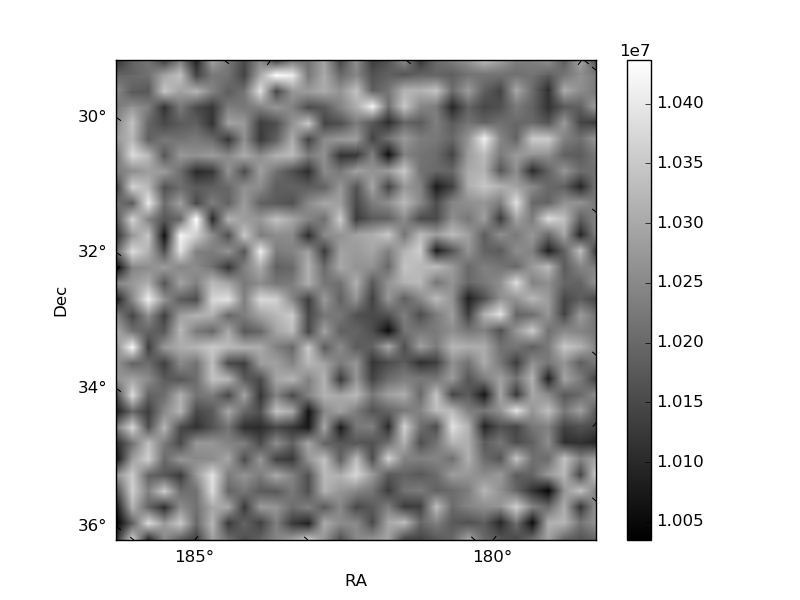 |
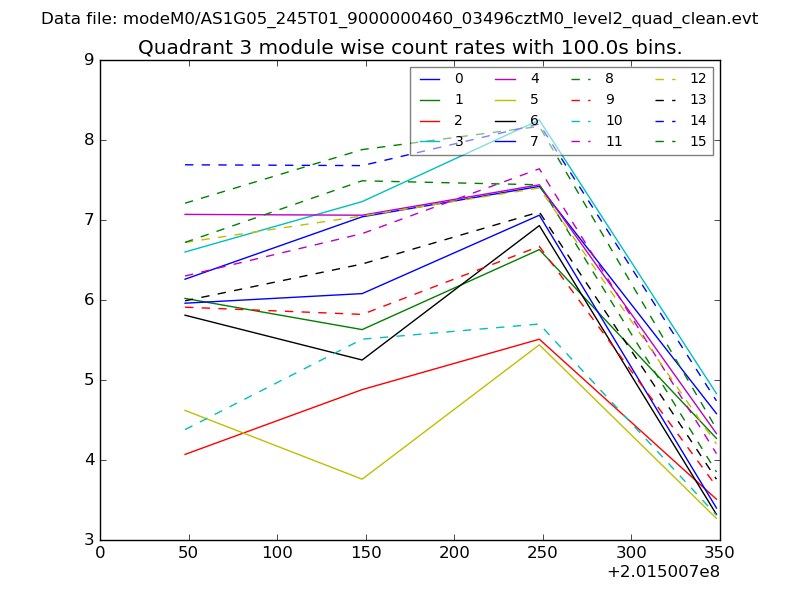
| Module-wise count rates for Quadrant D Data is divided into 100 sec bins |
 |
 |
| Parameter | Plot |
|---|---|
| CZT HV Monitor | 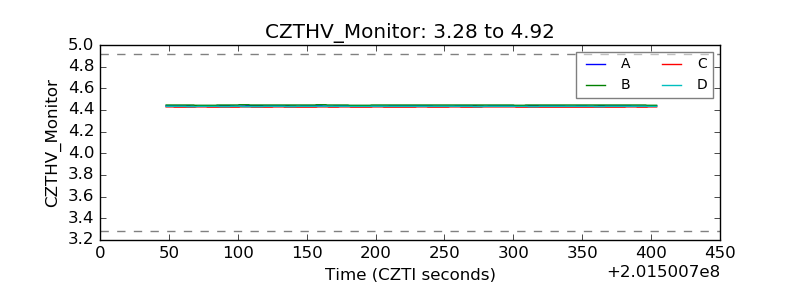 |
| D_VDD | 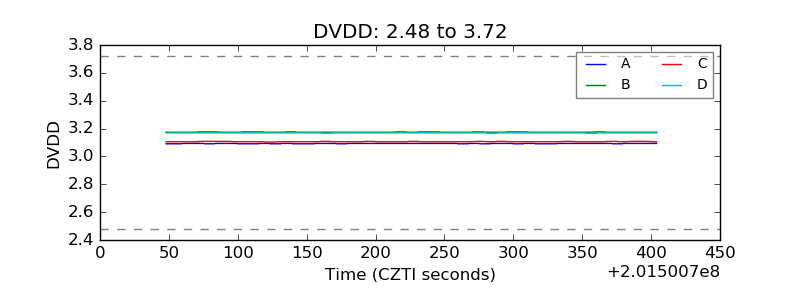 |
| Temperature 1 | 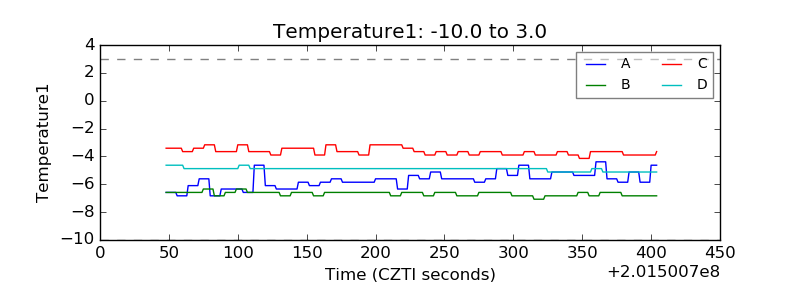 |
| Veto HV Monitor | 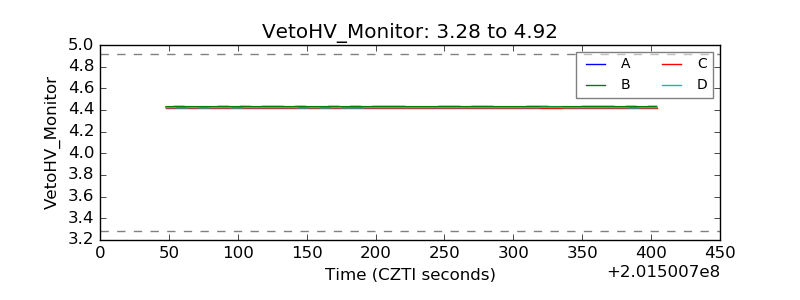 |
| Veto LLD | 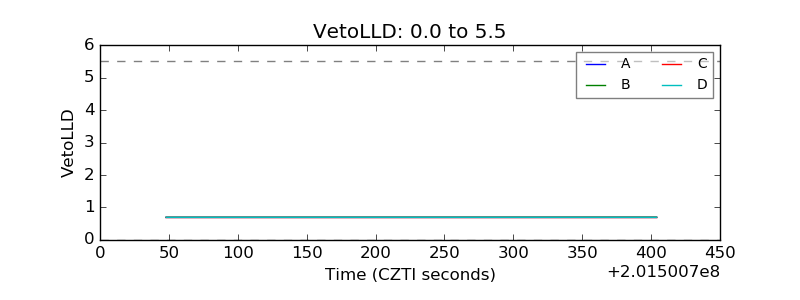 |
| Alpha Counter | 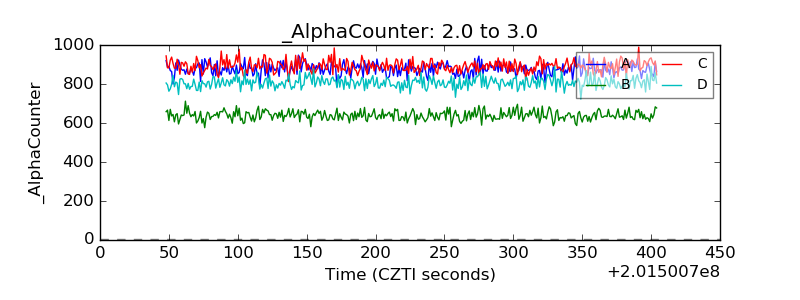 |
| _CPM_Rate | 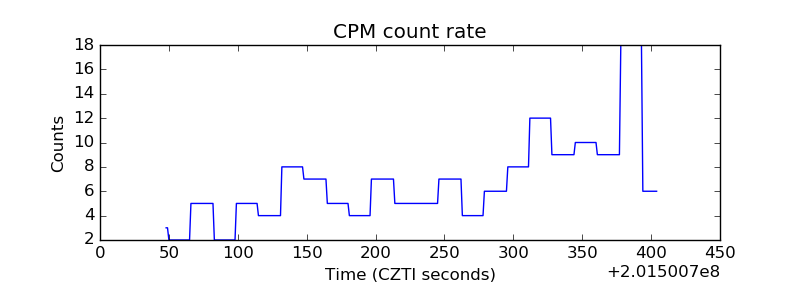 |
| CZT Counter |  |
| +2.5 Volts monitor | 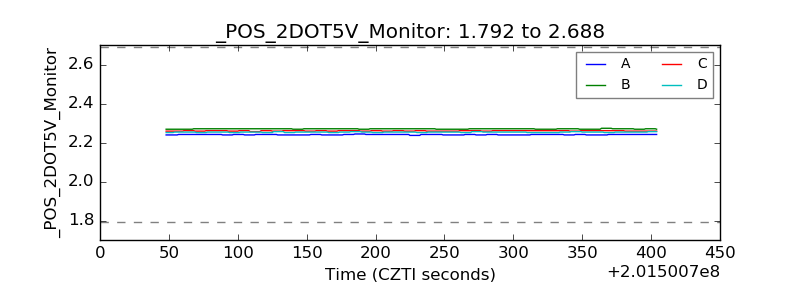 |
| +5 Volts monitor |  |
| Veto Counter | 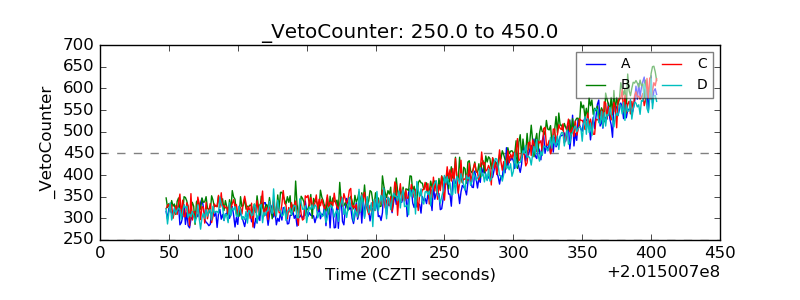 |