| Param | Original file | Final file |
|---|---|---|
| Filename | modeM0/AS1SLEW_01234_9000000463_03477cztM0_level2.evt | modeM0/AS1SLEW_01234_9000000463_03477cztM0_level2_quad_clean.evt |
| Size (bytes) | 41,935,680 | 8,795,520 |
| Size | 40.0 MB | 8.4 MB |
| Events in quadrant A | 499,736 | 52,756 |
| Events in quadrant B | 282,415 | 54,094 |
| Events in quadrant C | 224,747 | 56,894 |
| Events in quadrant D | 221,415 | 55,128 |
| Mode M0 | |||
|---|---|---|---|
| Quadrant | BADHDUFLAG | Total packets | Discarded packets |
| A | 0 | 1885 | 0 |
| B | 0 | 1198 | 0 |
| C | 0 | 1122 | 0 |
| D | 0 | 1131 | 0 |
| Mode SS | |||
|---|---|---|---|
| Quadrant | BADHDUFLAG | Total packets | Discarded packets |
| A | 0 | 12 | 0 |
| B | 0 | 12 | 0 |
| C | 0 | 12 | 0 |
| D | 0 | 12 | 0 |
| Quadrant | Total seconds | Saturated seconds | Saturation percentage |
|---|---|---|---|
| A | 558 | 25 | 4.480287% |
| B | 558 | 3 | 0.537634% |
| C | 558 | 0 | 0.000000% |
| D | 558 | 1 | 0.179211% |
Noise dominated data is calculated using 1-second bins in cleaned event files. If a bin has >2000 counts, and if more than 50% of those come from <1% of pixels, then it is considered to be noise-dominated and hence unusable.
| Quadrant | # 1 sec bins | Bins with >0 counts | Bins with >2000 counts | High rate bins dominated by noise | Noise dominated (total time) | Noise dominated (detector-on time) | Marked lightcurve |
|---|---|---|---|---|---|---|---|
| A | 558 | 558 | 25 | 25 | 4.48% | 4.48% | 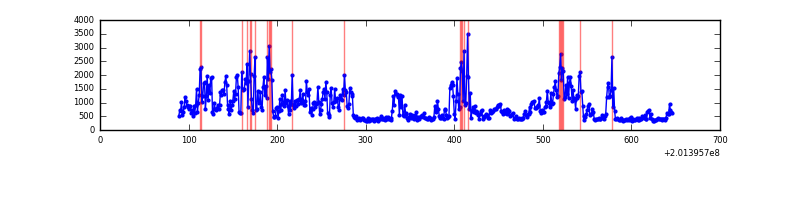 |
| B | 558 | 558 | 2 | 2 | 0.36% | 0.36% | 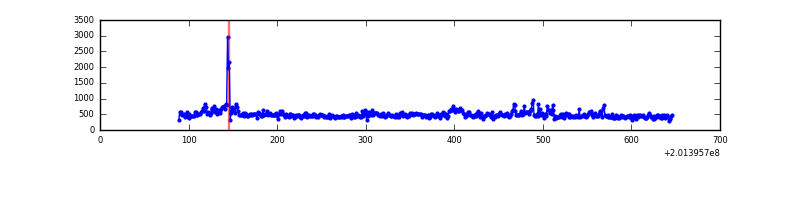 |
| C | 558 | 558 | 0 | 0 | 0.00% | 0.00% | 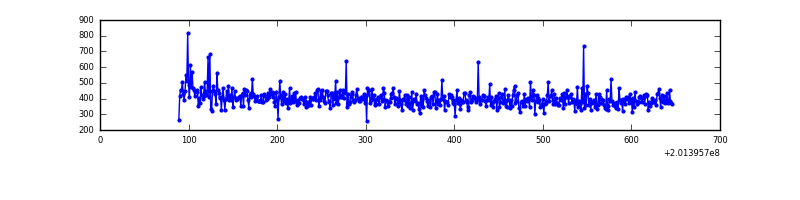 |
| D | 558 | 558 | 2 | 2 | 0.36% | 0.36% | 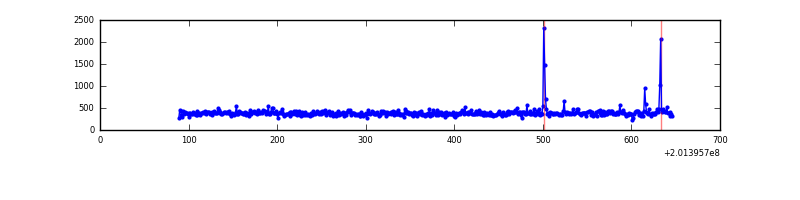 |
Top three noisy pixels from each quadrant. If the there are fewer than three noisy pixels in the level2.evt file, extra rows are filled as -1
| Pixel properties | Quadrant properties | ||||||
|---|---|---|---|---|---|---|---|
| Quadrant | DetID | PixID | Counts | Sigma | Mean | Median | Sigma |
| A | 0 | 118 | 169083 | 12380.32 | 54 | 52 | 13.7 |
| A | 0 | 50 | 104076 | 7619.02 | 54 | 52 | 13.7 |
| A | 0 | 226 | 15618 | 1140.1 | 54 | 52 | 13.7 |
| B | 15 | 204 | 24695 | 1878.55 | 56 | 55 | 13.1 |
| B | 3 | 0 | 22234 | 1690.93 | 56 | 55 | 13.1 |
| B | 2 | 249 | 7948 | 601.76 | 56 | 55 | 13.1 |
| C | 7 | 220 | 5934 | 393.65 | 55 | 56 | 14.9 |
| C | 13 | 61 | 440 | 25.72 | 55 | 56 | 14.9 |
| C | 10 | 21 | 322 | 17.81 | 55 | 56 | 14.9 |
| D | 13 | 239 | 4931 | 325.27 | 54 | 52 | 15.0 |
| D | 13 | 223 | 4483 | 295.4 | 54 | 52 | 15.0 |
| D | 2 | 37 | 3264 | 214.13 | 54 | 52 | 15.0 |
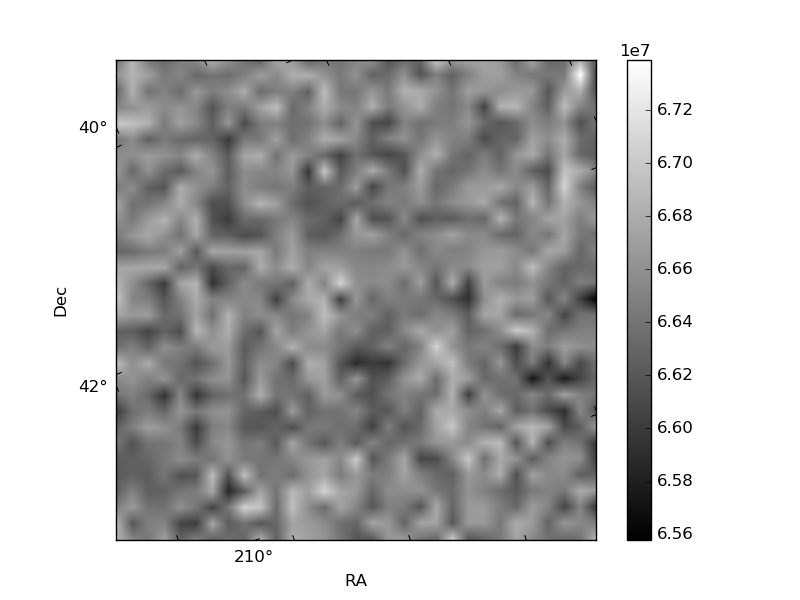
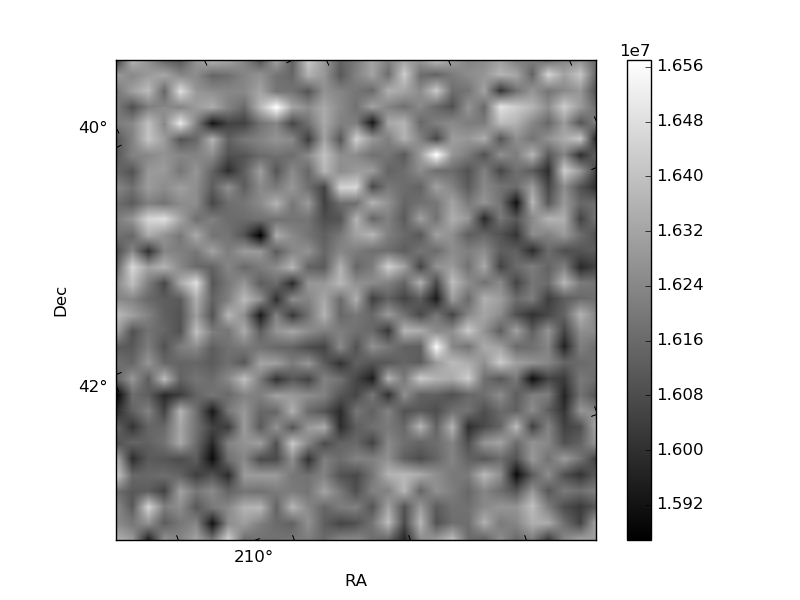
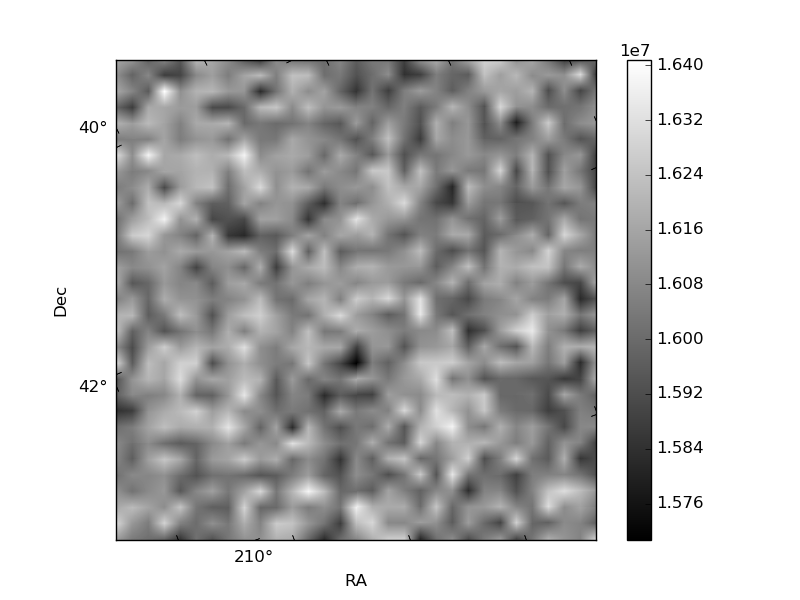
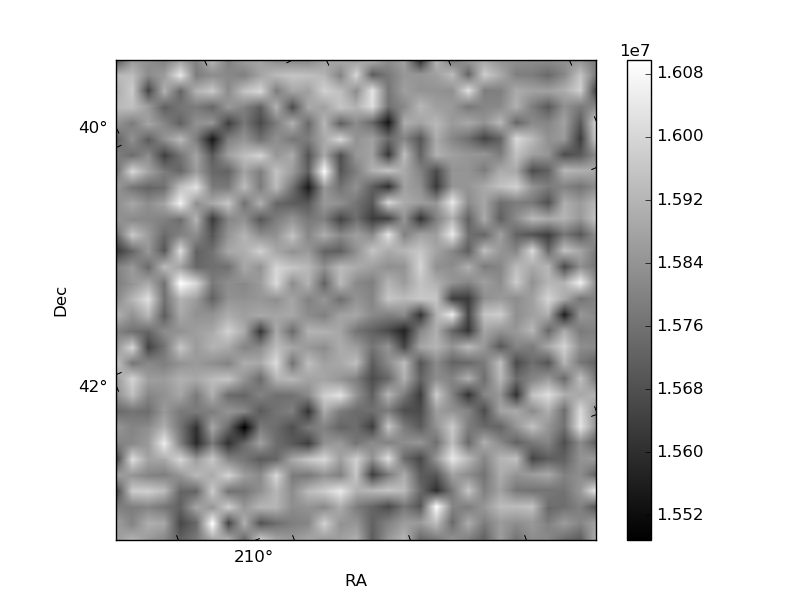
Histogram calculated using DETX and DETY for each event in the final _common_clean file
| Quadrant A | 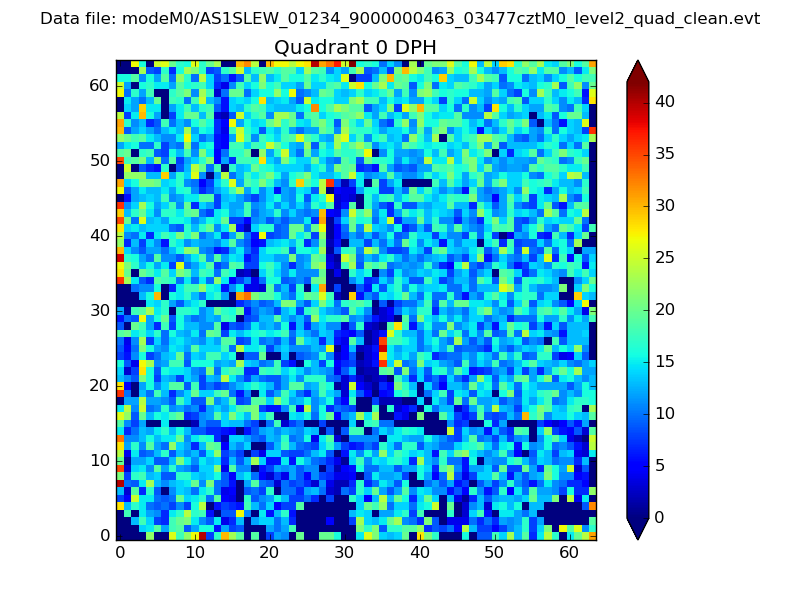 |
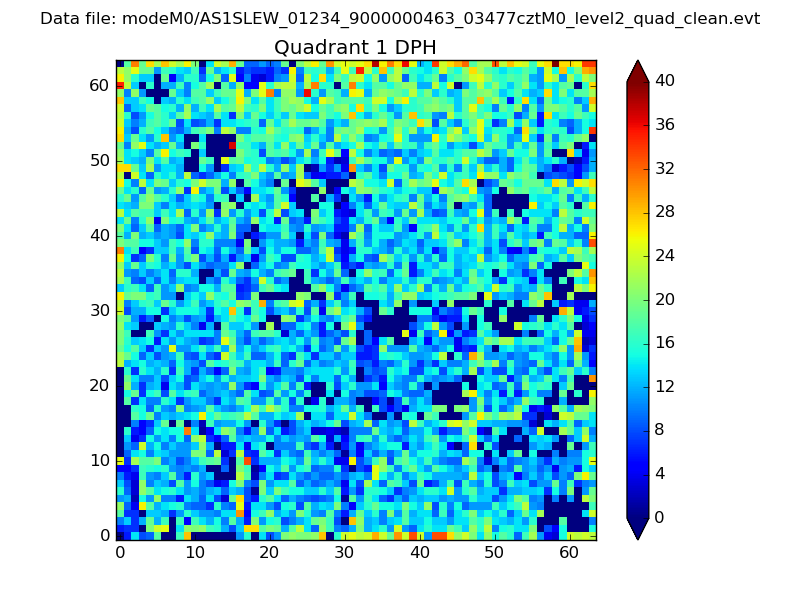 |
Quadrant B |
|---|---|---|---|
| Quadrant D | 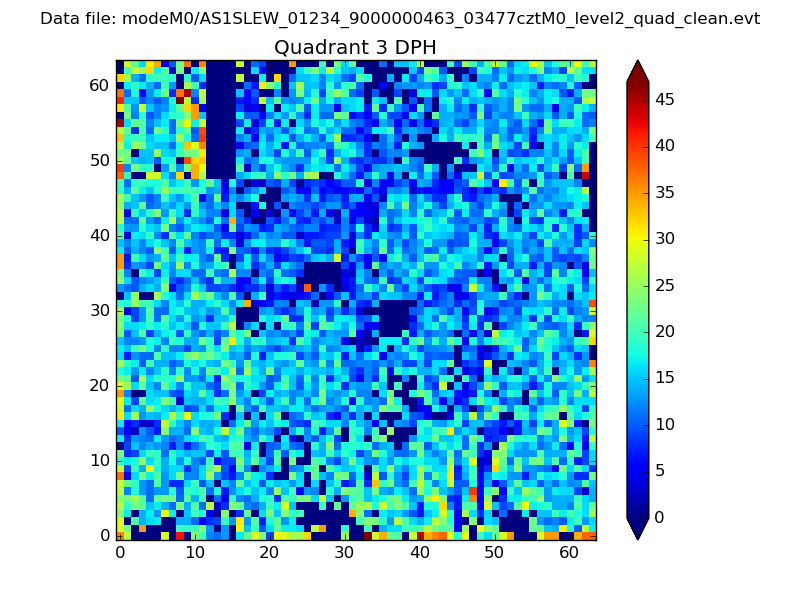 |
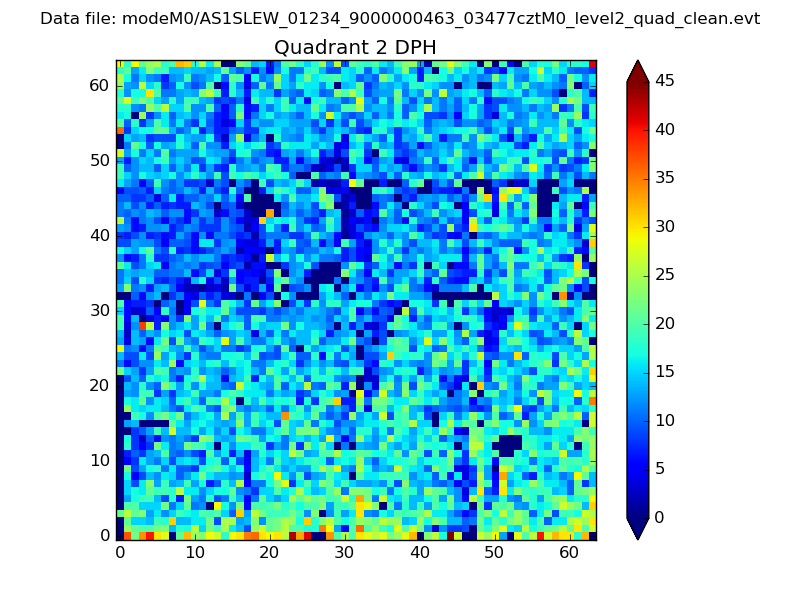 |
Quadrant C |
| Plot type | Count rate plots | Images |
|---|---|---|
| Comparison with Poisson distribution Blue bars denote a histogram of data divided into 1 sec bins. Red curve is a Poisson curve with rate = median count rate of data. |
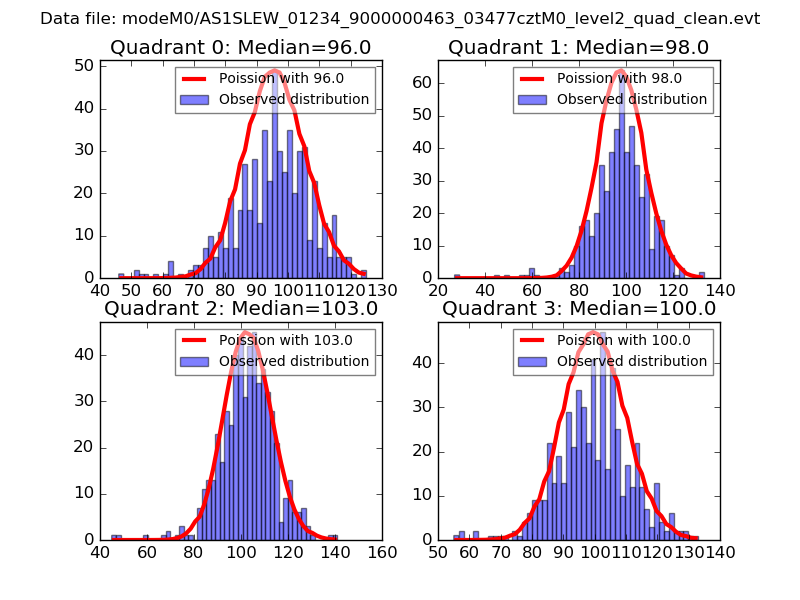 |
 |
| Quadrant-wise count rates Data is divided into 100 sec bins |
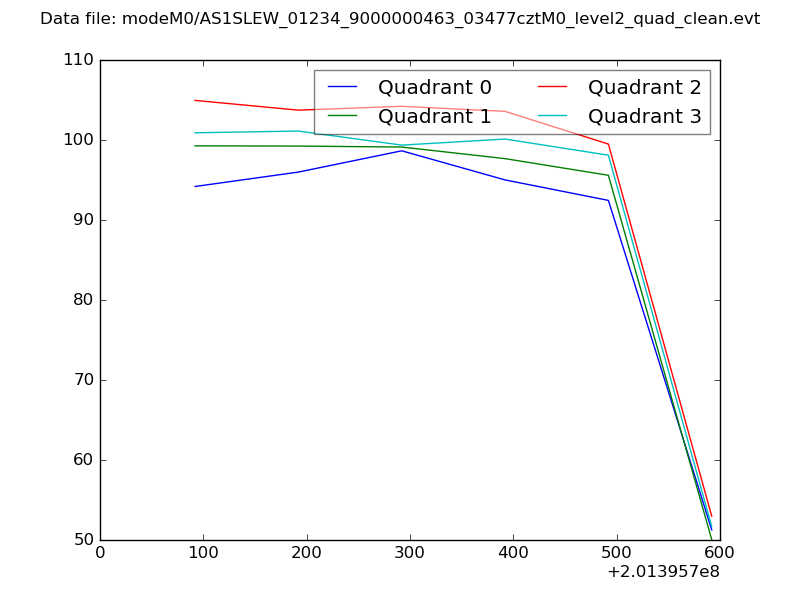 |
|
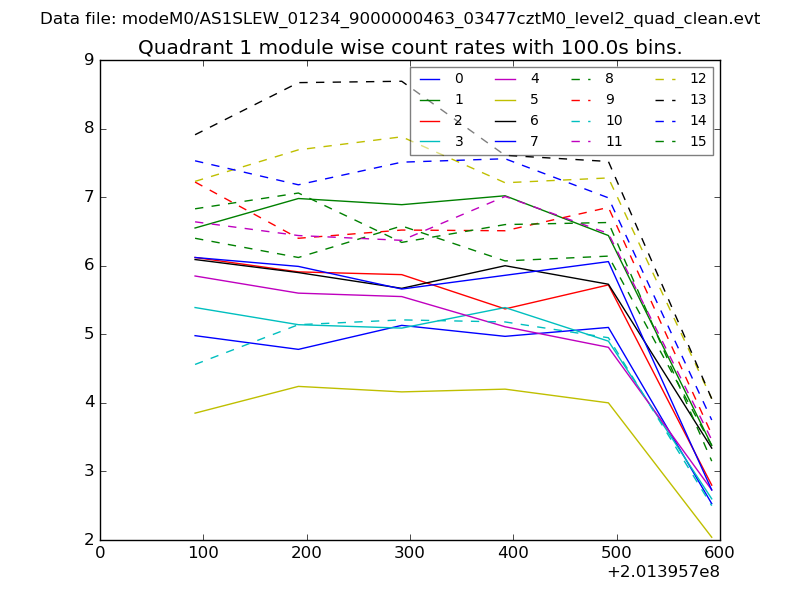
| Module-wise count rates for Quadrant A Data is divided into 100 sec bins |
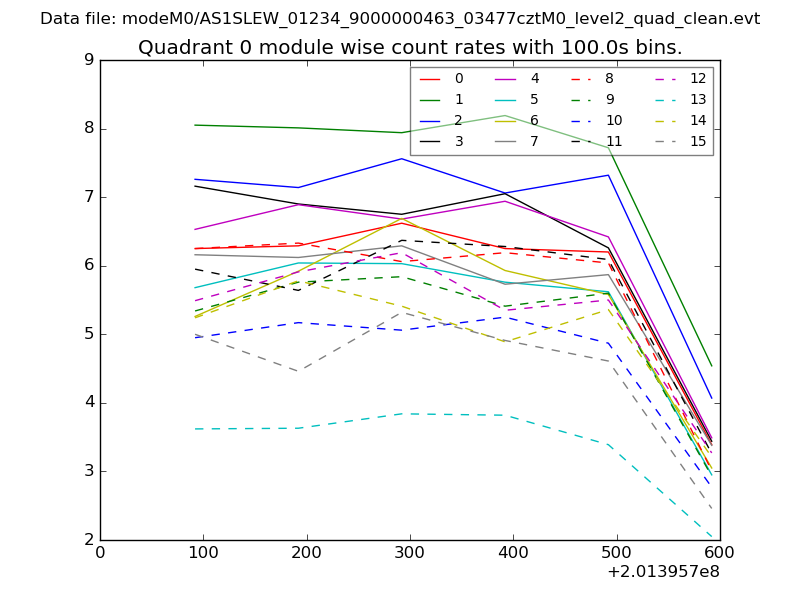 |
 |
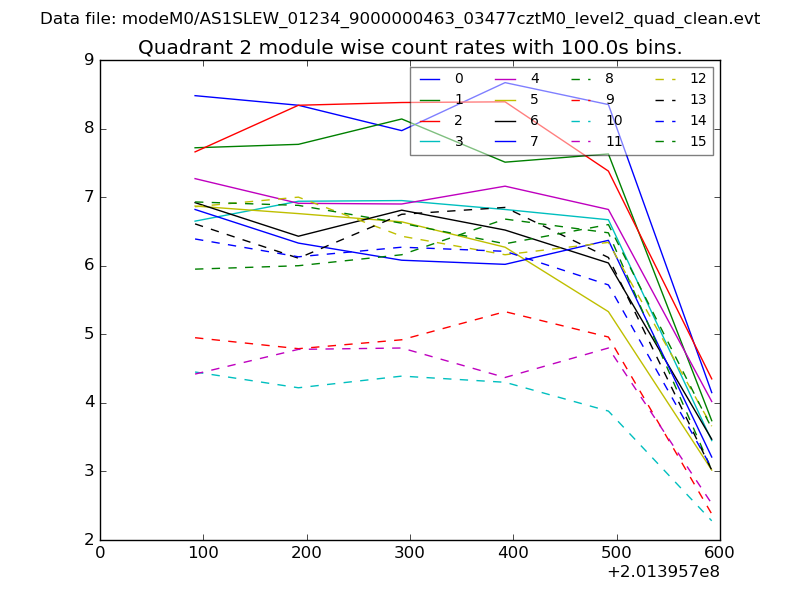
| Module-wise count rates for Quadrant B Data is divided into 100 sec bins |
 |
 |
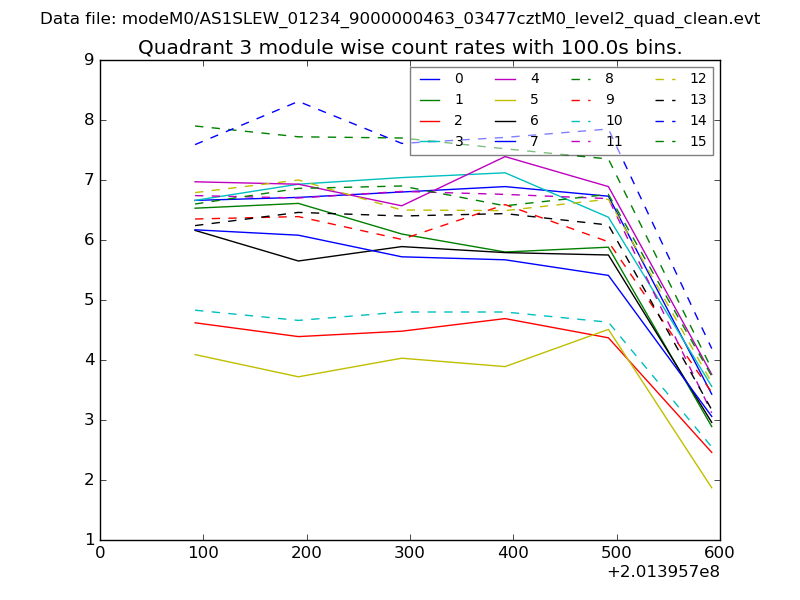
| Module-wise count rates for Quadrant C Data is divided into 100 sec bins |
 |
 |
| Module-wise count rates for Quadrant D Data is divided into 100 sec bins |
 |
 |
| Parameter | Plot |
|---|---|
| CZT HV Monitor | 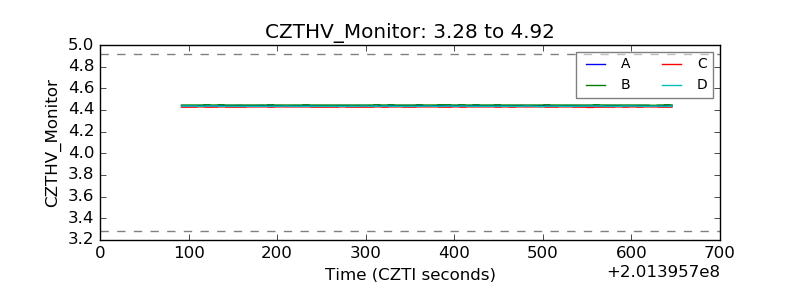 |
| D_VDD | 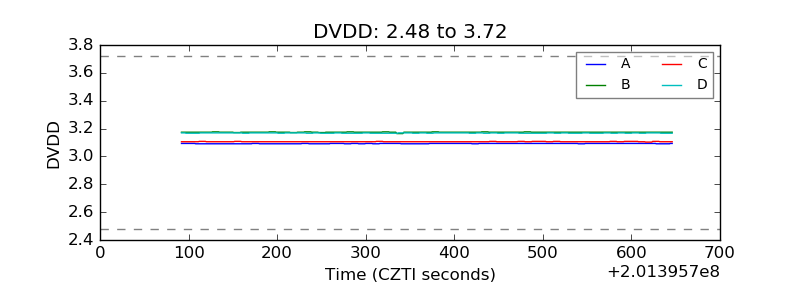 |
| Temperature 1 | 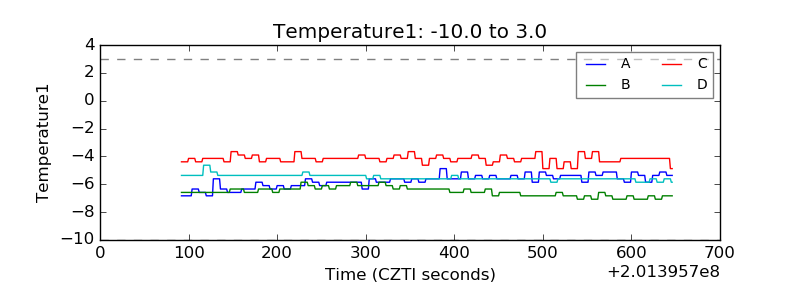 |
| Veto HV Monitor | 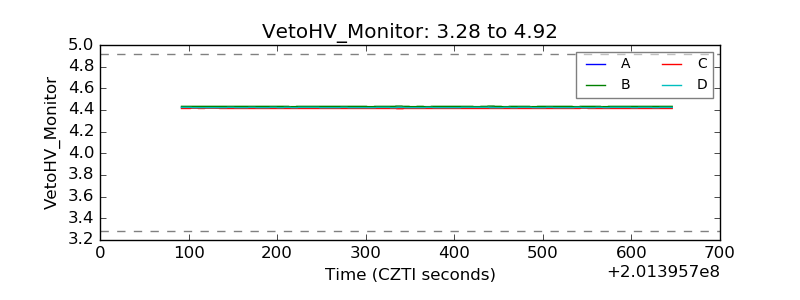 |
| Veto LLD | 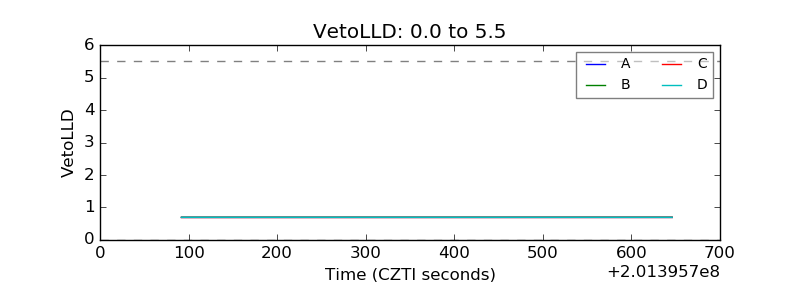 |
| Alpha Counter | 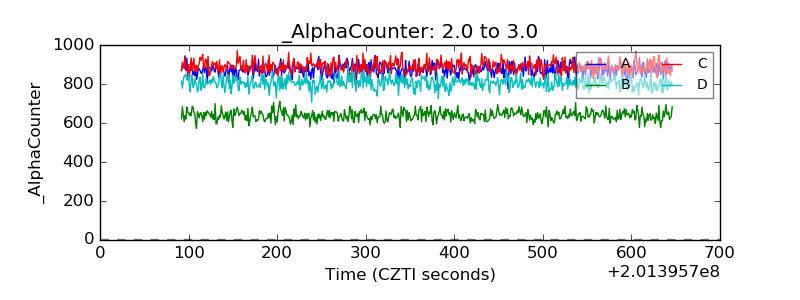 |
| _CPM_Rate | 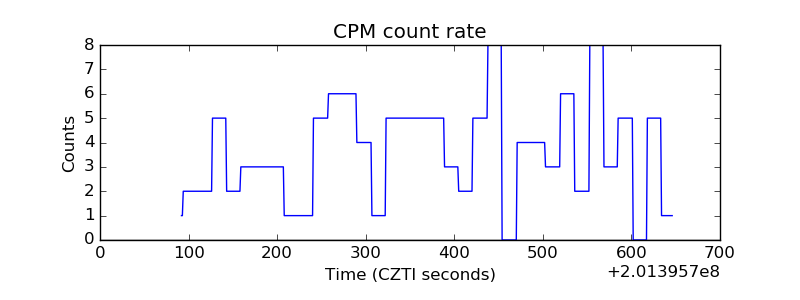 |
| CZT Counter | 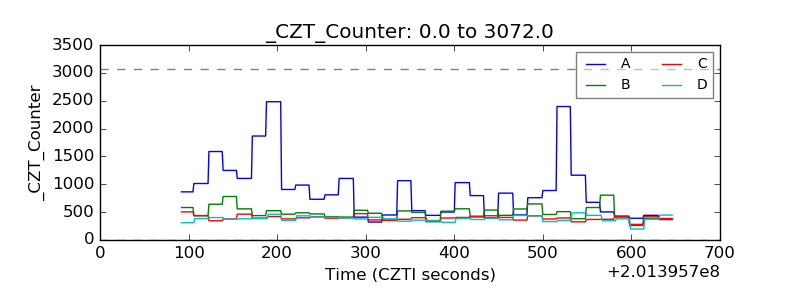 |
| +2.5 Volts monitor |  |
| +5 Volts monitor | 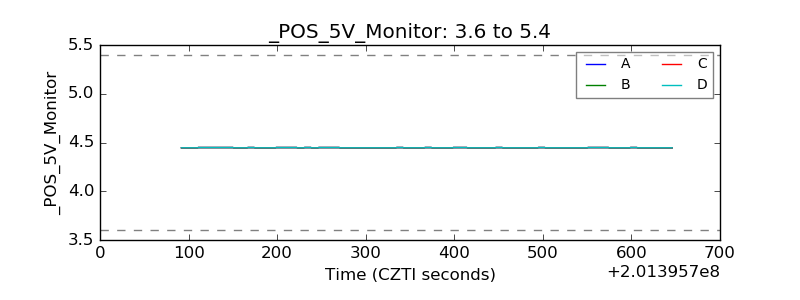 |
| Veto Counter | 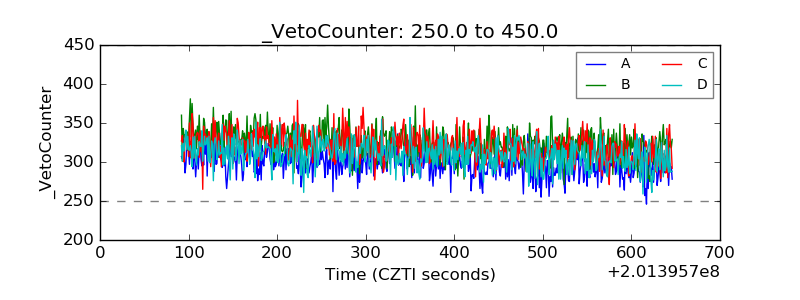 |