| Param | Original file | Final file |
|---|---|---|
| Filename | modeM0/AS1G05_211T01_9000000464_03498cztM0_level2.evt | modeM0/AS1G05_211T01_9000000464_03498cztM0_level2_quad_clean.evt |
| Size (bytes) | 204,439,680 | 28,002,240 |
| Size | 195.0 MB | 26.7 MB |
| Events in quadrant A | 1,776,270 | 164,594 |
| Events in quadrant B | 1,454,391 | 166,913 |
| Events in quadrant C | 1,537,947 | 160,951 |
| Events in quadrant D | 1,233,998 | 158,387 |
| Mode M9 | |||
|---|---|---|---|
| Quadrant | BADHDUFLAG | Total packets | Discarded packets |
| A | 0 | 7 | 0 |
| B | 0 | 7 | 0 |
| C | 0 | 7 | 0 |
| D | 0 | 8 | 0 |
| Mode M0 | |||
|---|---|---|---|
| Quadrant | BADHDUFLAG | Total packets | Discarded packets |
| A | 0 | 7255 | 1 |
| B | 0 | 6049 | 1 |
| C | 0 | 6479 | 1 |
| D | 0 | 5675 | 1 |
| Mode SS | |||
|---|---|---|---|
| Quadrant | BADHDUFLAG | Total packets | Discarded packets |
| A | 0 | 54 | 0 |
| B | 0 | 54 | 0 |
| C | 0 | 54 | 0 |
| D | 0 | 54 | 0 |
| Quadrant | Total seconds | Saturated seconds | Saturation percentage |
|---|---|---|---|
| A | 2750 | 164 | 5.963636% |
| B | 2750 | 52 | 1.890909% |
| C | 2750 | 81 | 2.945455% |
| D | 2750 | 14 | 0.509091% |
Noise dominated data is calculated using 1-second bins in cleaned event files. If a bin has >2000 counts, and if more than 50% of those come from <1% of pixels, then it is considered to be noise-dominated and hence unusable.
| Quadrant | # 1 sec bins | Bins with >0 counts | Bins with >2000 counts | High rate bins dominated by noise | Noise dominated (total time) | Noise dominated (detector-on time) | Marked lightcurve |
|---|---|---|---|---|---|---|---|
| A | 2750 | 2750 | 79 | 79 | 2.87% | 2.87% | 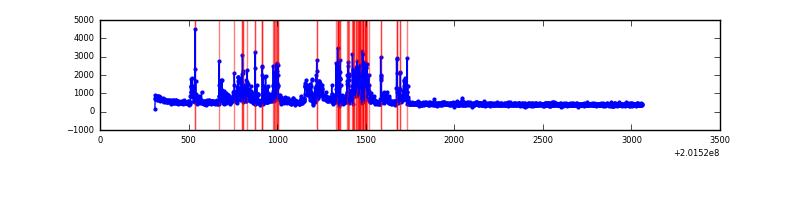 |
| B | 2750 | 2750 | 6 | 6 | 0.22% | 0.22% | 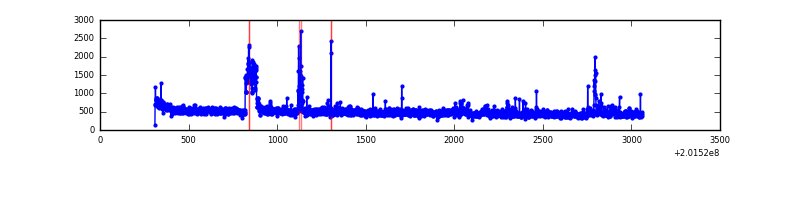 |
| C | 2750 | 2750 | 61 | 61 | 2.22% | 2.22% | 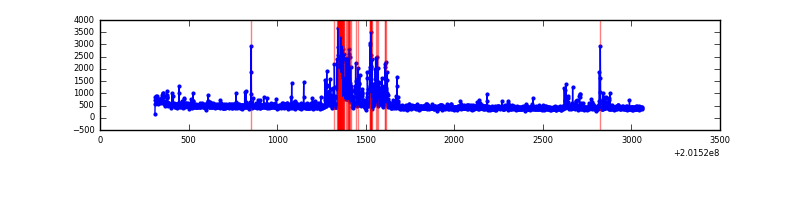 |
| D | 2750 | 2750 | 3 | 3 | 0.11% | 0.11% | 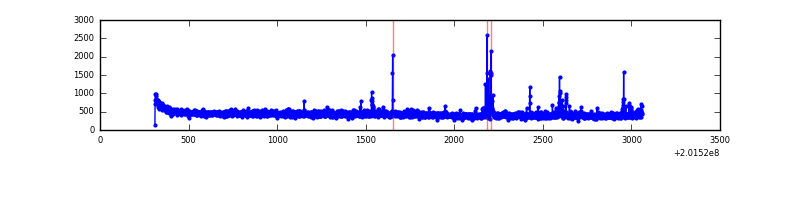 |
Top three noisy pixels from each quadrant. If the there are fewer than three noisy pixels in the level2.evt file, extra rows are filled as -1
| Pixel properties | Quadrant properties | ||||||
|---|---|---|---|---|---|---|---|
| Quadrant | DetID | PixID | Counts | Sigma | Mean | Median | Sigma |
| A | 0 | 50 | 542960 | 8241.9 | 317 | 310 | 65.8 |
| A | 8 | 15 | 7284 | 105.92 | 317 | 310 | 65.8 |
| A | 0 | 226 | 3450 | 47.69 | 317 | 310 | 65.8 |
| B | 4 | 81 | 79952 | 1229.68 | 321 | 313 | 64.8 |
| B | 15 | 204 | 53548 | 821.98 | 321 | 313 | 64.8 |
| B | 15 | 85 | 23720 | 361.42 | 321 | 313 | 64.8 |
| C | 1 | 192 | 338681 | 4678.24 | 304 | 306 | 72.3 |
| C | 7 | 220 | 2853 | 35.21 | 304 | 306 | 72.3 |
| C | 13 | 61 | 2606 | 31.8 | 304 | 306 | 72.3 |
| D | 10 | 172 | 12593 | 162.52 | 310 | 301 | 75.6 |
| D | 13 | 137 | 12465 | 160.83 | 310 | 301 | 75.6 |
| D | 7 | 39 | 11199 | 144.09 | 310 | 301 | 75.6 |
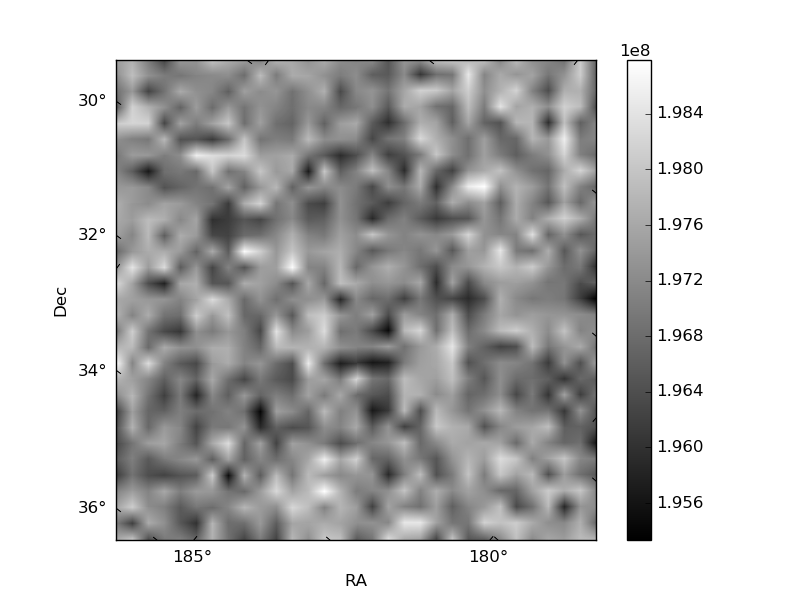
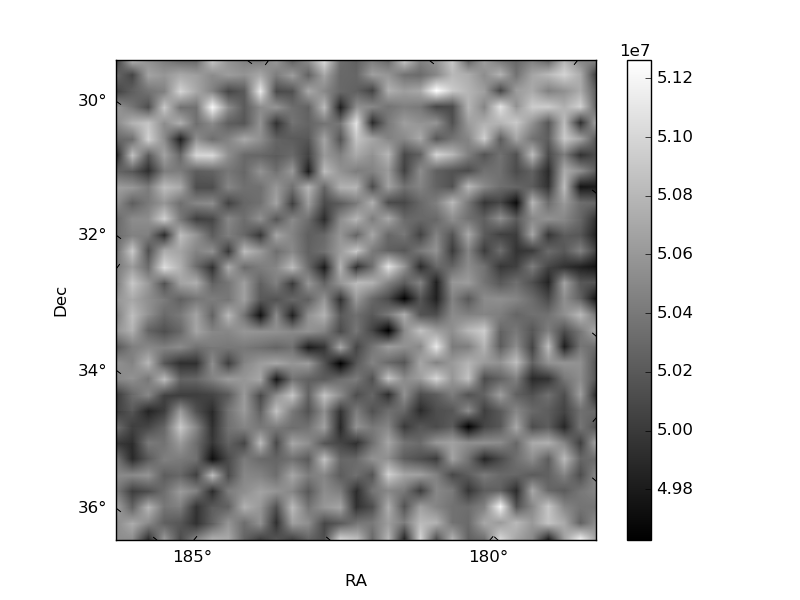
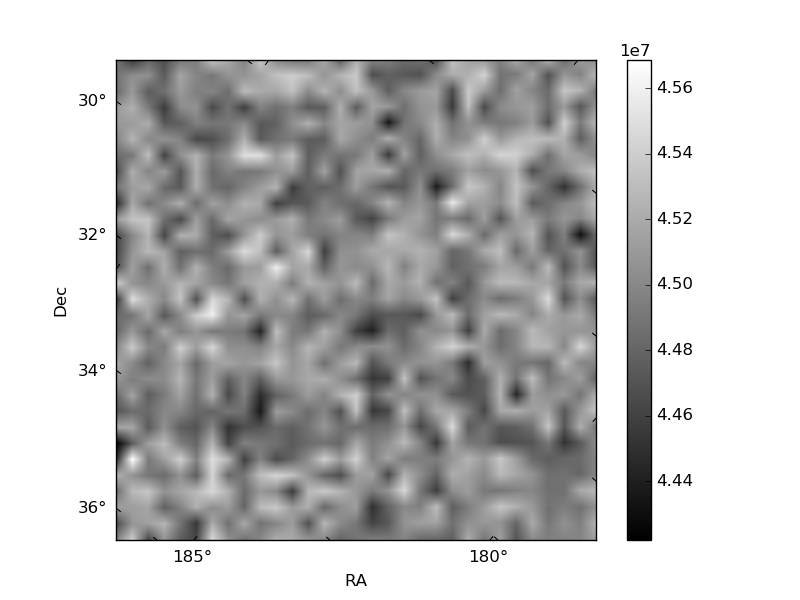
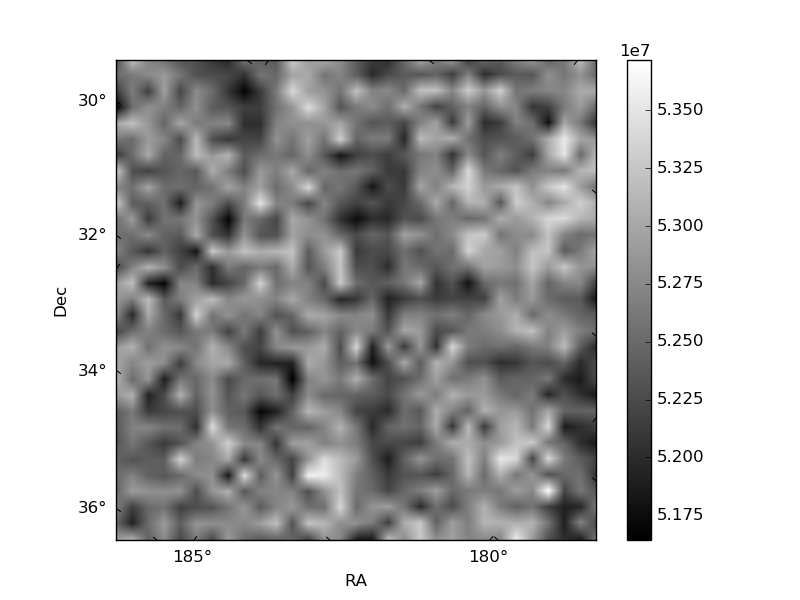
Histogram calculated using DETX and DETY for each event in the final _common_clean file
| Quadrant A | 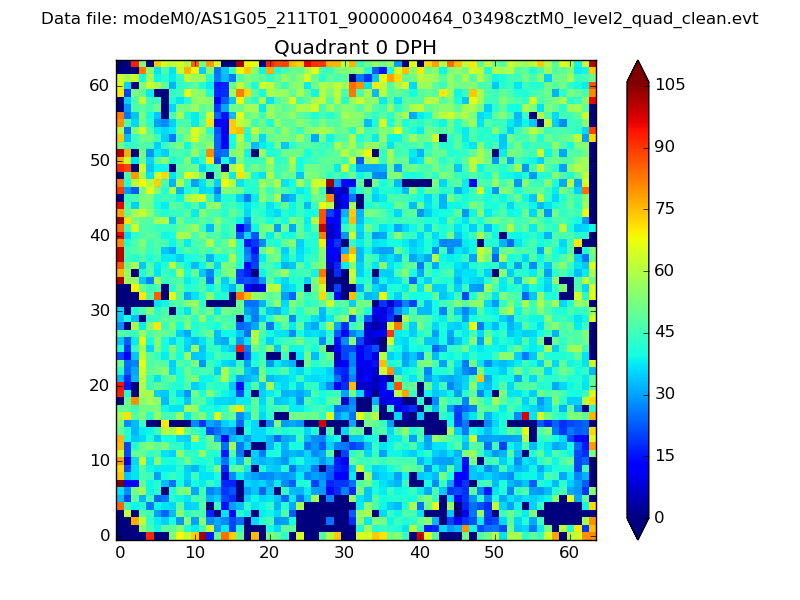 |
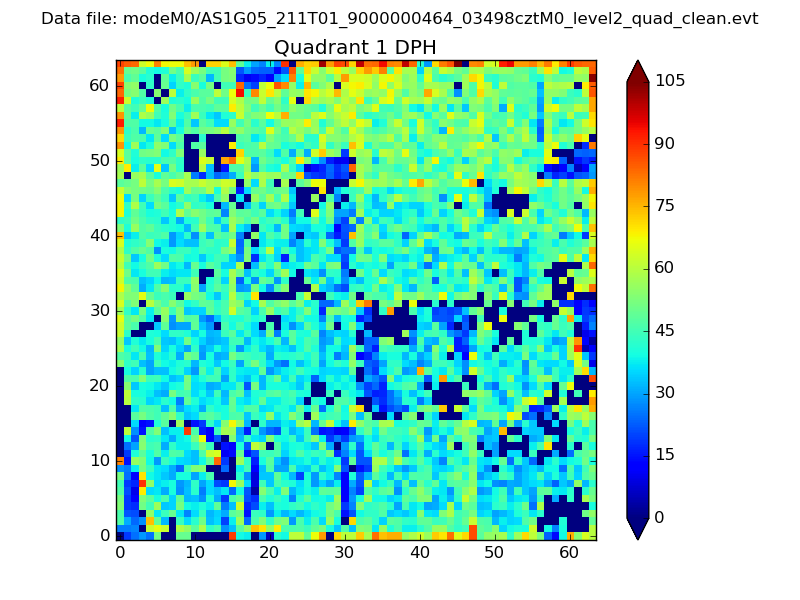 |
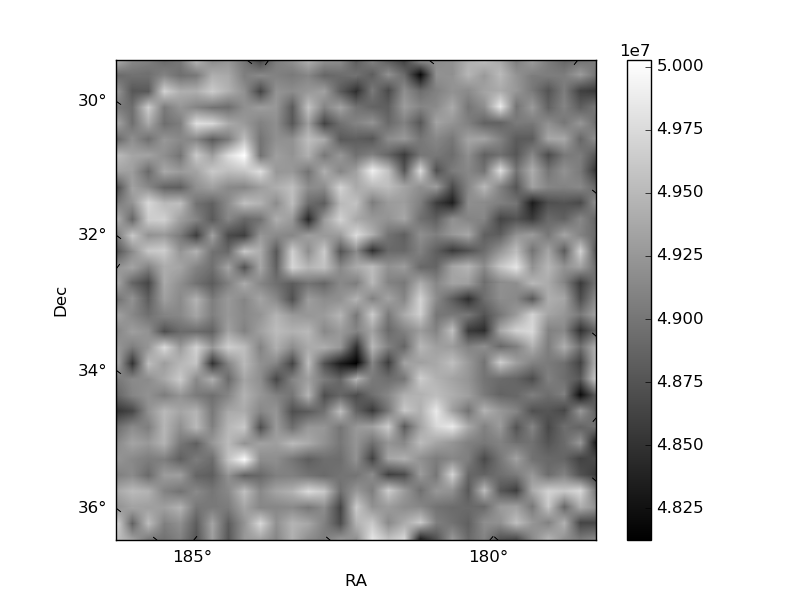
Quadrant B |
|---|---|---|---|
| Quadrant D | 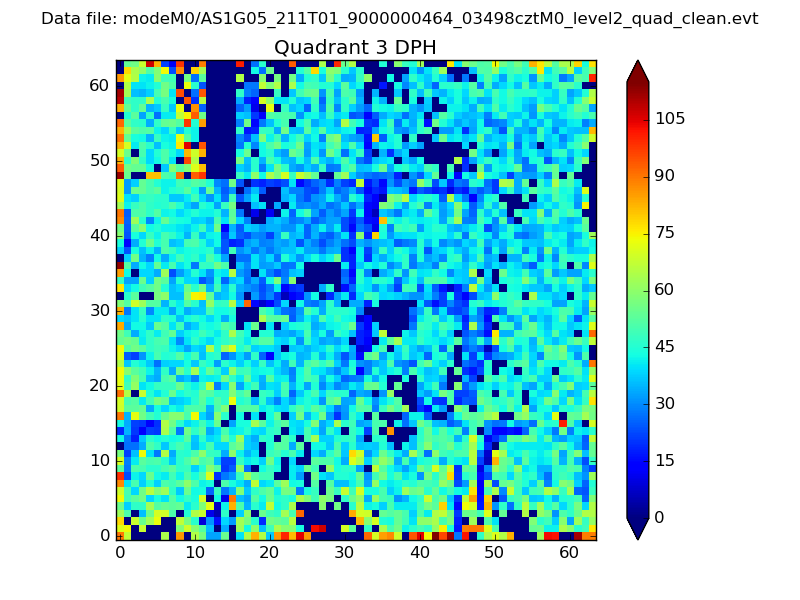 |
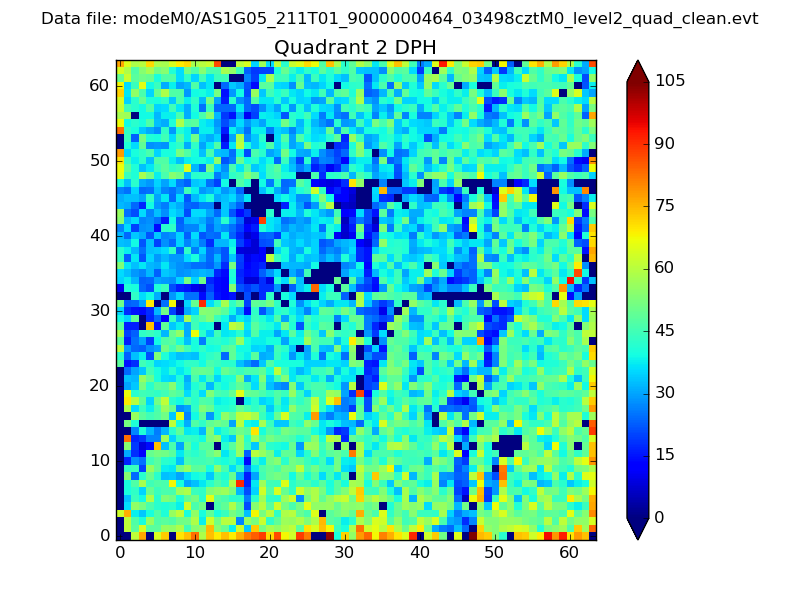 |
Quadrant C |
| Plot type | Count rate plots | Images |
|---|---|---|
| Comparison with Poisson distribution Blue bars denote a histogram of data divided into 1 sec bins. Red curve is a Poisson curve with rate = median count rate of data. |
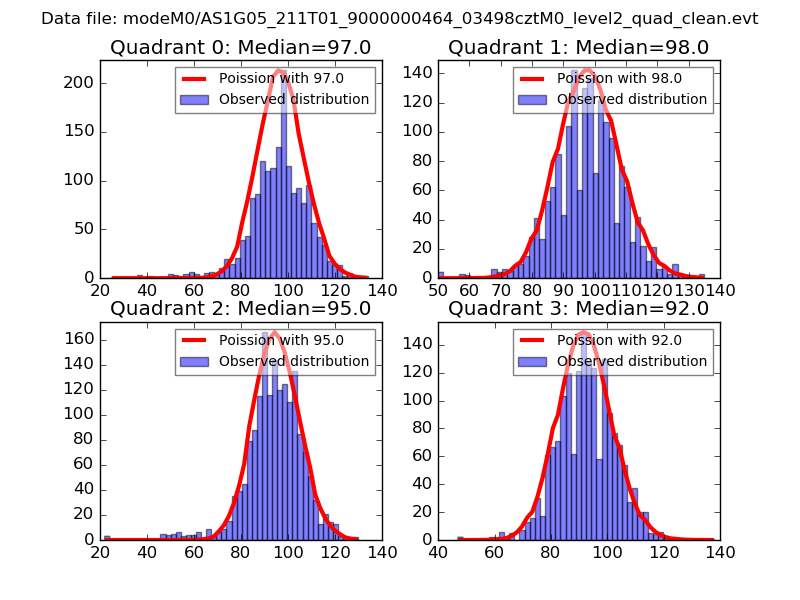 |
 |
| Quadrant-wise count rates Data is divided into 100 sec bins |
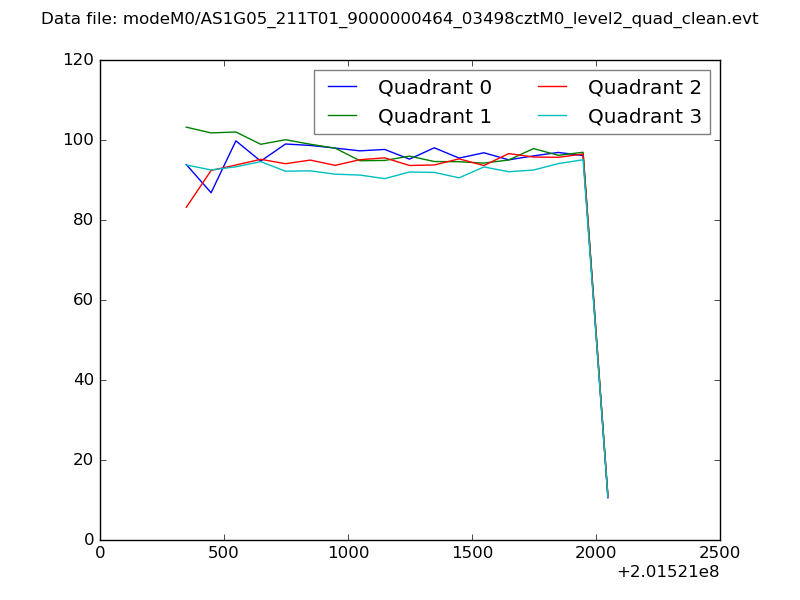 |
|
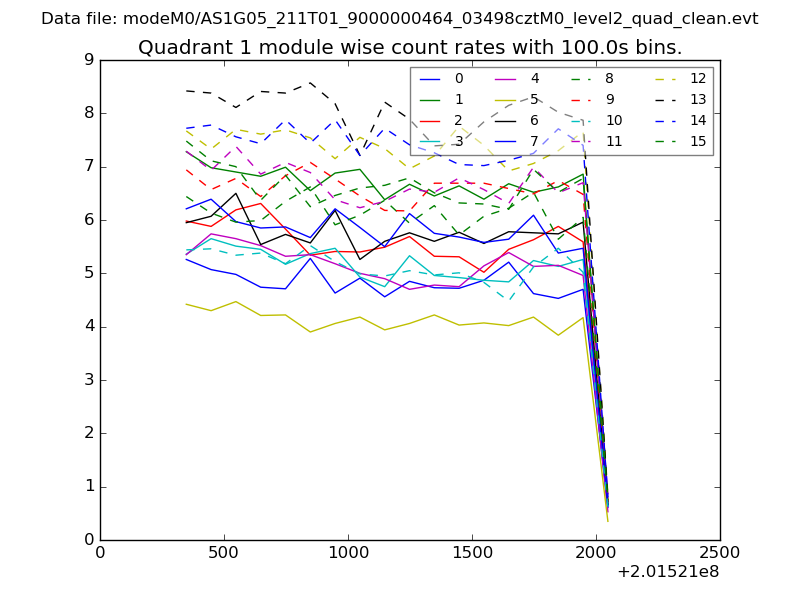
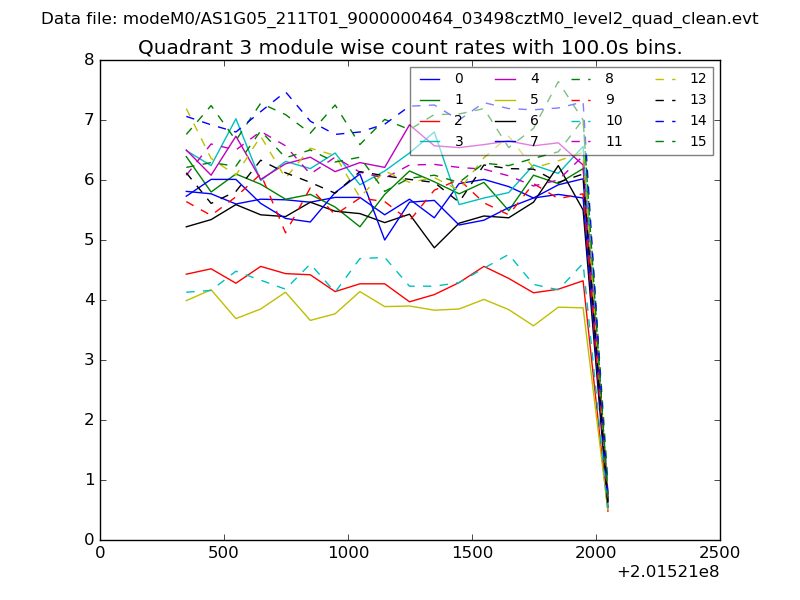
| Module-wise count rates for Quadrant A Data is divided into 100 sec bins |
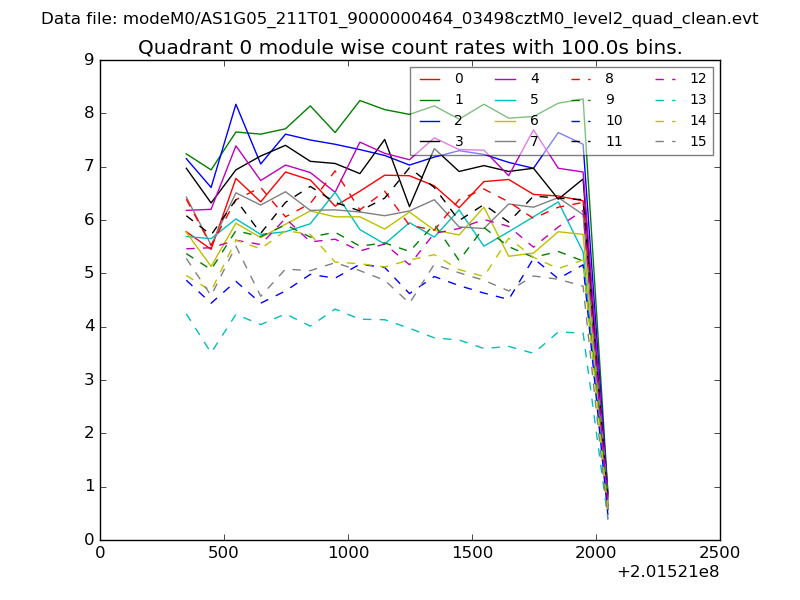 |
 |
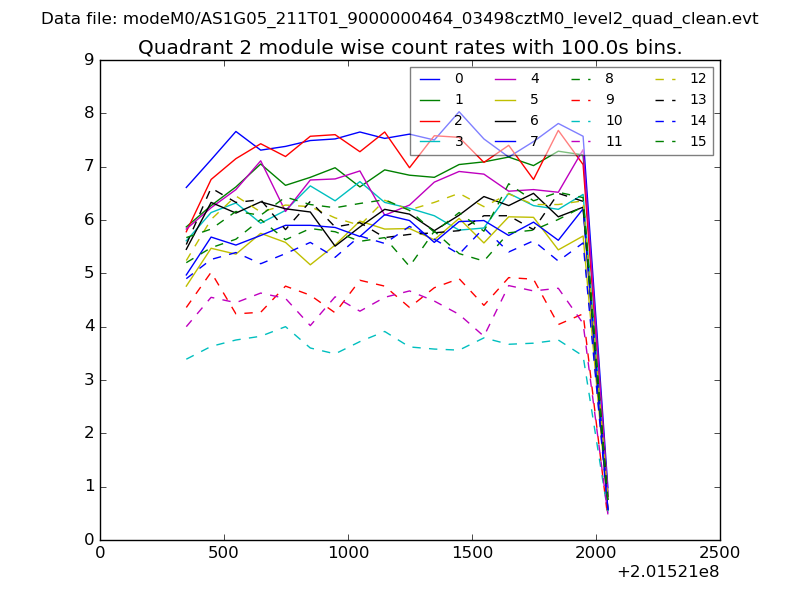
| Module-wise count rates for Quadrant B Data is divided into 100 sec bins |
 |
 |
| Module-wise count rates for Quadrant C Data is divided into 100 sec bins |
 |
 |
| Module-wise count rates for Quadrant D Data is divided into 100 sec bins |
 |
 |
| Parameter | Plot |
|---|---|
| CZT HV Monitor | 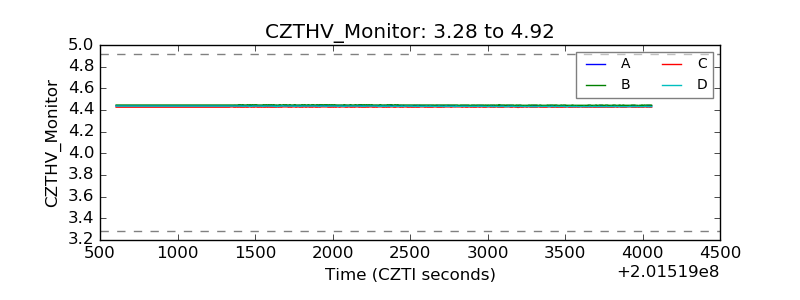 |
| D_VDD | 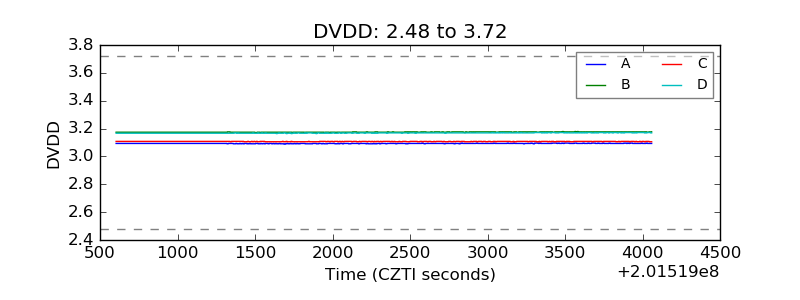 |
| Temperature 1 | 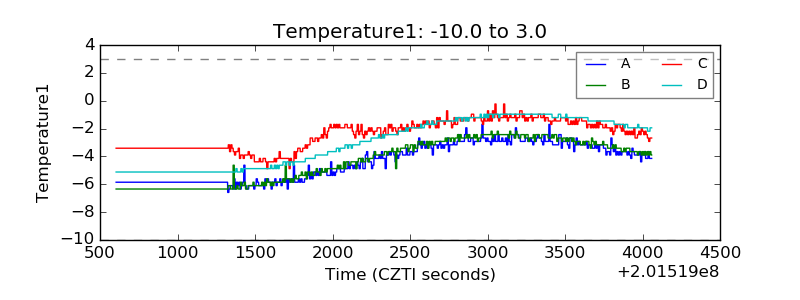 |
| Veto HV Monitor | 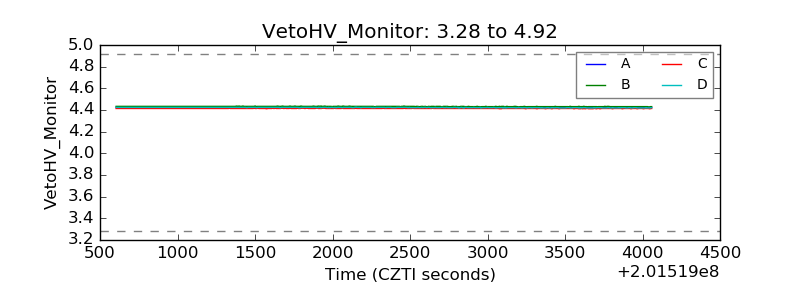 |
| Veto LLD |  |
| Alpha Counter | 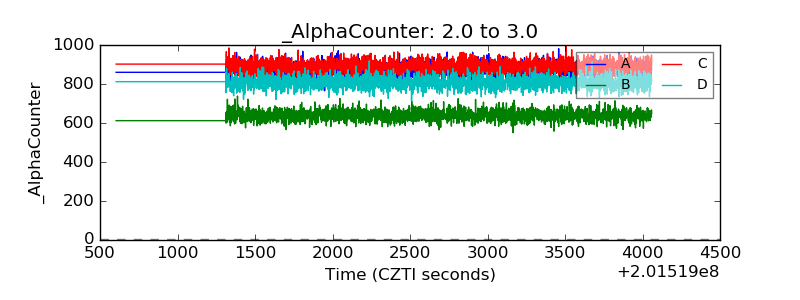 |
| _CPM_Rate | 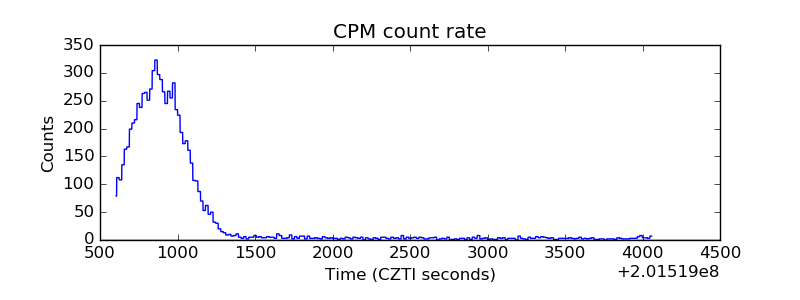 |
| CZT Counter | 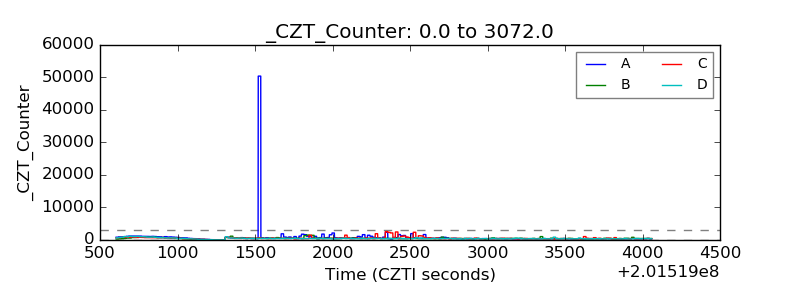 |
| +2.5 Volts monitor | 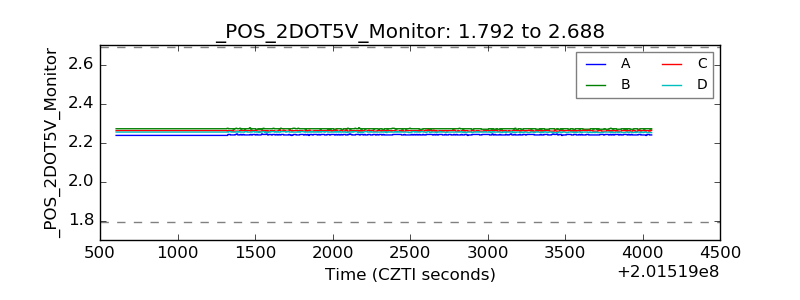 |
| +5 Volts monitor |  |
| Veto Counter | 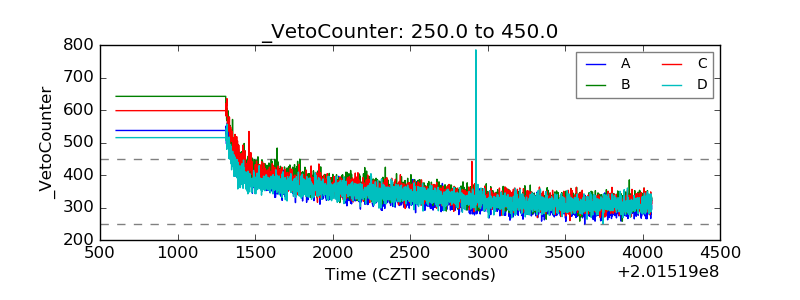 |