| Param | Original file | Final file |
|---|---|---|
| Filename | modeM0/AS1G05_192T01_9000000466cztM0_level2.fits | modeM0/AS1G05_192T01_9000000466cztM0_level2_quad_clean.evt |
| Size (bytes) | 421,320,960 | 464,359,680 |
| Size | 401.8 MB | 442.8 MB |
| Events in quadrant A | 2,519,138 | 2,833,642 |
| Events in quadrant B | 2,439,436 | 2,840,539 |
| Events in quadrant C | 2,513,234 | 2,735,812 |
| Events in quadrant D | 2,184,036 | 2,550,447 |
| Mode M9 | |||
|---|---|---|---|
| Quadrant | BADHDUFLAG | Total packets | Discarded packets |
| A | 0 | 85 | 0 |
| B | 0 | 85 | 0 |
| C | 0 | 85 | 0 |
| D | 0 | 85 | 0 |
| Mode SS | |||
|---|---|---|---|
| Quadrant | BADHDUFLAG | Total packets | Discarded packets |
| A | 0 | 920 | 0 |
| B | 0 | 920 | 0 |
| C | 0 | 920 | 0 |
| D | 0 | 920 | 0 |
| Mode M0 | |||
|---|---|---|---|
| Quadrant | BADHDUFLAG | Total packets | Discarded packets |
| A | 0 | 101242 | 0 |
| B | 0 | 103646 | 0 |
| C | 0 | 100181 | 0 |
| D | 0 | 95101 | 0 |
| Quadrant | Total seconds | Saturated seconds | Saturation percentage |
|---|---|---|---|
| A | 45216 | 832 | 1.840057% |
| B | 45216 | 656 | 1.450814% |
| C | 45216 | 727 | 1.607838% |
| D | 45216 | 478 | 1.057148% |
Noise dominated data is calculated using 1-second bins in cleaned event files. If a bin has >2000 counts, and if more than 50% of those come from <1% of pixels, then it is considered to be noise-dominated and hence unusable.
| Quadrant | # 1 sec bins | Bins with >0 counts | Bins with >2000 counts | High rate bins dominated by noise | Noise dominated (total time) | Noise dominated (detector-on time) | Marked lightcurve |
|---|---|---|---|---|---|---|---|
| A | 53736 | 45208 | 0 | 0 | 0.00% | 0.00% |  |
| B | 53736 | 45212 | 0 | 0 | 0.00% | 0.00% |  |
| C | 53736 | 45212 | 0 | 0 | 0.00% | 0.00% |  |
| D | 53736 | 45211 | 0 | 0 | 0.00% | 0.00% |  |
Top three noisy pixels from each quadrant. If the there are fewer than three noisy pixels in the level2.evt file, extra rows are filled as -1
| Pixel properties | Quadrant properties | ||||||
|---|---|---|---|---|---|---|---|
| Quadrant | DetID | PixID | Counts | Sigma | Mean | Median | Sigma |
| A | 0 | 29 | 2455 | 11.02 | 654 | 612 | 167.1 |
| A | 14 | 188 | 2447 | 10.98 | 654 | 612 | 167.1 |
| A | 14 | 204 | 2141 | 9.15 | 654 | 612 | 167.1 |
| B | 2 | 9 | 2078 | 11.17 | 645 | 614 | 131.1 |
| B | 12 | 226 | 1898 | 9.79 | 645 | 614 | 131.1 |
| B | 5 | 128 | 1730 | 8.51 | 645 | 614 | 131.1 |
| C | 9 | 188 | 1768 | 6.53 | 664 | 615 | 176.5 |
| C | 1 | 80 | 1755 | 6.46 | 664 | 615 | 176.5 |
| C | 1 | 81 | 1749 | 6.43 | 664 | 615 | 176.5 |
| D | 11 | 82 | 1982 | 8.4 | 622 | 565 | 168.7 |
| D | 7 | 5 | 1679 | 6.6 | 622 | 565 | 168.7 |
| D | 3 | 14 | 1627 | 6.3 | 622 | 565 | 168.7 |
Histogram calculated using DETX and DETY for each event in the final _common_clean file
| Quadrant A |  |
 |
Quadrant B |
|---|---|---|---|
| Quadrant D | 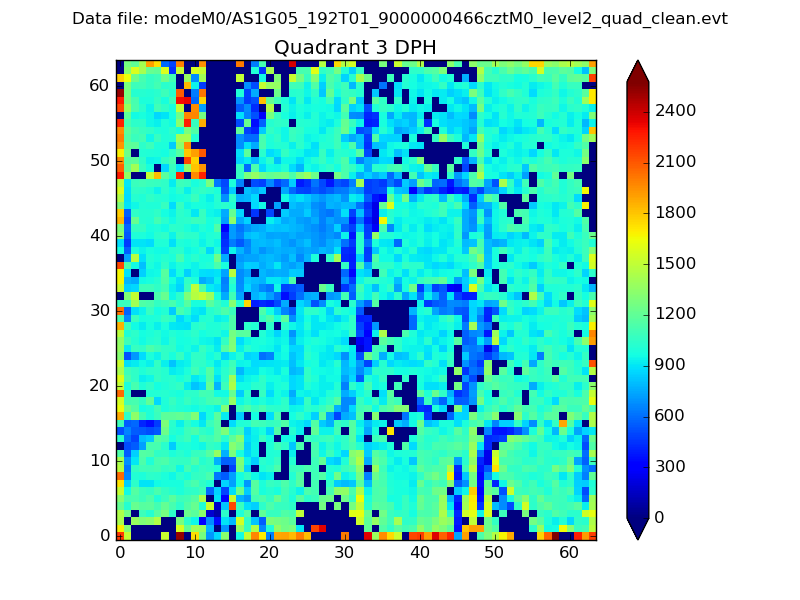 |
 |
Quadrant C |
| Plot type | Count rate plots | Images |
|---|---|---|
| Comparison with Poisson distribution Blue bars denote a histogram of data divided into 1 sec bins. Red curve is a Poisson curve with rate = median count rate of data. |
 |
 |
| Quadrant-wise count rates Data is divided into 100 sec bins |
 |
|
| Module-wise count rates for Quadrant A Data is divided into 100 sec bins |
 |
 |
| Module-wise count rates for Quadrant B Data is divided into 100 sec bins |
 |
 |
| Module-wise count rates for Quadrant C Data is divided into 100 sec bins |
 |
 |
| Module-wise count rates for Quadrant D Data is divided into 100 sec bins |
 |
 |
| Parameter | Plot |
|---|---|
| CZT HV Monitor |  |
| D_VDD |  |
| Temperature 1 |  |
| Veto HV Monitor |  |
| Veto LLD |  |
| Alpha Counter |  |
| _CPM_Rate |  |
| CZT Counter |  |
| +2.5 Volts monitor |  |
| +5 Volts monitor |  |
| _ROLL_ROT |  |
| _Roll_DEC |  |
| _Roll_RA |  |
| Veto Counter |  |