| Param | Original file | Final file |
|---|---|---|
| Filename | modeM0/AS1G05_192T01_9000000466_03500cztM0_level2.evt | modeM0/AS1G05_192T01_9000000466_03500cztM0_level2_quad_clean.evt |
| Size (bytes) | 476,916,480 | 58,861,440 |
| Size | 454.8 MB | 56.1 MB |
| Events in quadrant A | 3,723,667 | 334,504 |
| Events in quadrant B | 4,013,582 | 333,591 |
| Events in quadrant C | 3,228,728 | 332,242 |
| Events in quadrant D | 3,031,326 | 323,382 |
| Mode M9 | |||
|---|---|---|---|
| Quadrant | BADHDUFLAG | Total packets | Discarded packets |
| A | 0 | 17 | 0 |
| B | 0 | 17 | 0 |
| C | 0 | 17 | 0 |
| D | 0 | 18 | 0 |
| Mode SS | |||
|---|---|---|---|
| Quadrant | BADHDUFLAG | Total packets | Discarded packets |
| A | 0 | 132 | 0 |
| B | 0 | 132 | 0 |
| C | 0 | 132 | 0 |
| D | 0 | 132 | 0 |
| Mode M0 | |||
|---|---|---|---|
| Quadrant | BADHDUFLAG | Total packets | Discarded packets |
| A | 0 | 15408 | 3 |
| B | 0 | 16330 | 2 |
| C | 0 | 14037 | 2 |
| D | 0 | 13717 | 2 |
| Quadrant | Total seconds | Saturated seconds | Saturation percentage |
|---|---|---|---|
| A | 6576 | 157 | 2.387470% |
| B | 6576 | 103 | 1.566302% |
| C | 6576 | 85 | 1.292579% |
| D | 6576 | 78 | 1.186131% |
Noise dominated data is calculated using 1-second bins in cleaned event files. If a bin has >2000 counts, and if more than 50% of those come from <1% of pixels, then it is considered to be noise-dominated and hence unusable.
| Quadrant | # 1 sec bins | Bins with >0 counts | Bins with >2000 counts | High rate bins dominated by noise | Noise dominated (total time) | Noise dominated (detector-on time) | Marked lightcurve |
|---|---|---|---|---|---|---|---|
| A | 7731 | 6576 | 53 | 53 | 0.69% | 0.81% | 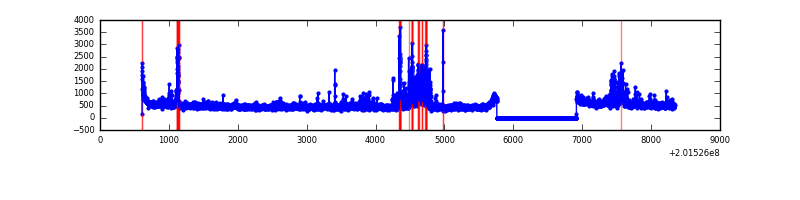 |
| B | 7731 | 6576 | 10 | 10 | 0.13% | 0.15% | 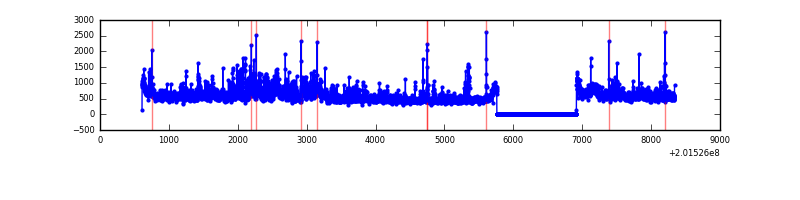 |
| C | 7731 | 6576 | 19 | 19 | 0.25% | 0.29% | 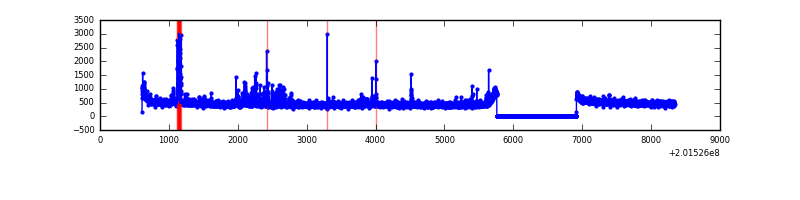 |
| D | 7731 | 6576 | 15 | 15 | 0.19% | 0.23% | 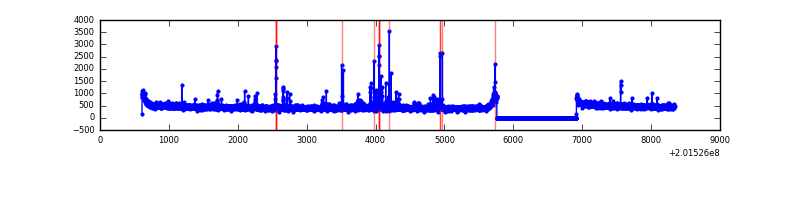 |
Top three noisy pixels from each quadrant. If the there are fewer than three noisy pixels in the level2.evt file, extra rows are filled as -1
| Pixel properties | Quadrant properties | ||||||
|---|---|---|---|---|---|---|---|
| Quadrant | DetID | PixID | Counts | Sigma | Mean | Median | Sigma |
| A | 0 | 50 | 359871 | 2216.47 | 792 | 776 | 162.0 |
| A | 14 | 238 | 162171 | 996.19 | 792 | 776 | 162.0 |
| A | 8 | 15 | 103935 | 636.74 | 792 | 776 | 162.0 |
| B | 15 | 204 | 736309 | 4809.56 | 799 | 781 | 152.9 |
| B | 4 | 81 | 73446 | 475.15 | 799 | 781 | 152.9 |
| B | 15 | 85 | 29394 | 187.1 | 799 | 781 | 152.9 |
| C | 1 | 192 | 192220 | 1083.83 | 763 | 768 | 176.6 |
| C | 1 | 16 | 20389 | 111.08 | 763 | 768 | 176.6 |
| C | 15 | 208 | 17524 | 94.86 | 763 | 768 | 176.6 |
| D | 13 | 223 | 49064 | 262.01 | 766 | 744 | 184.4 |
| D | 7 | 39 | 25031 | 131.69 | 766 | 744 | 184.4 |
| D | 13 | 239 | 22341 | 117.11 | 766 | 744 | 184.4 |
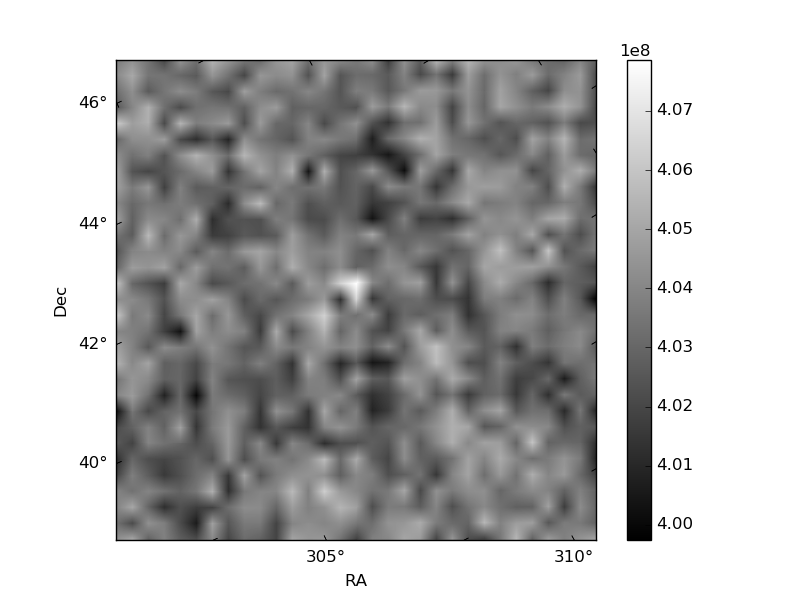
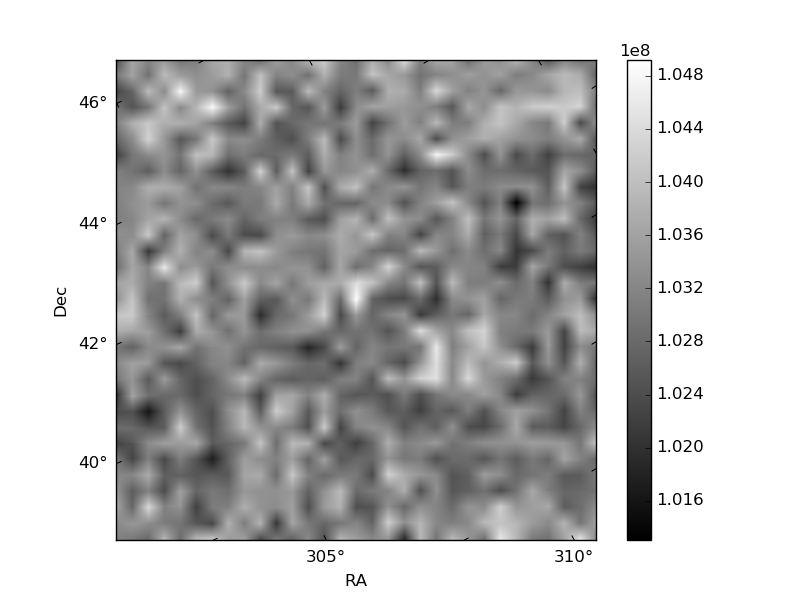
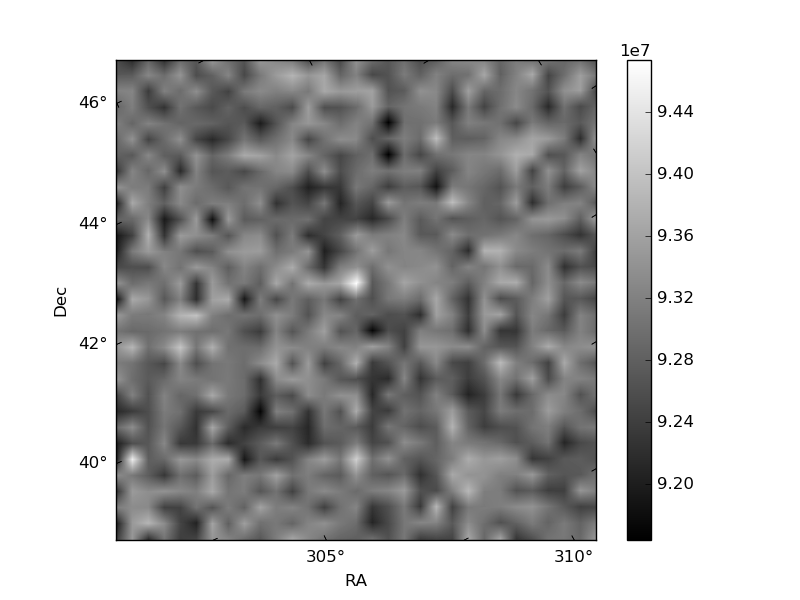
Histogram calculated using DETX and DETY for each event in the final _common_clean file
| Quadrant A | 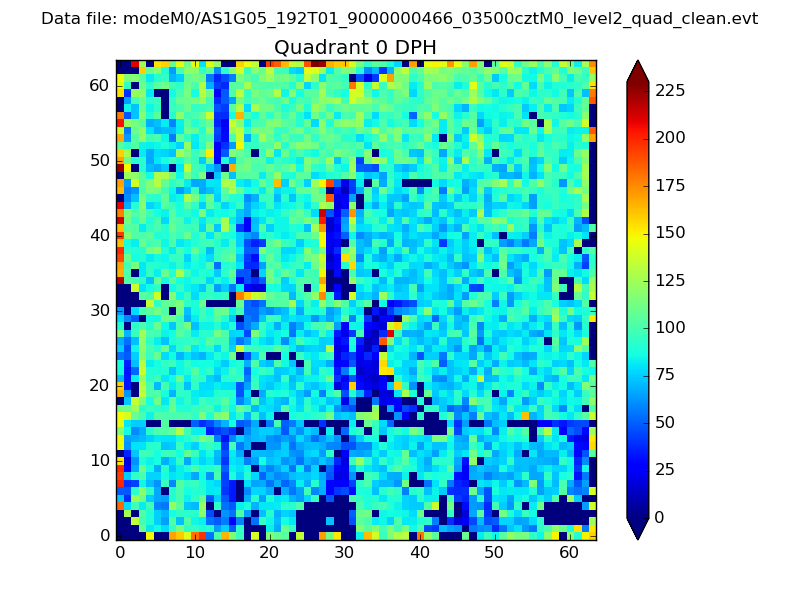 |
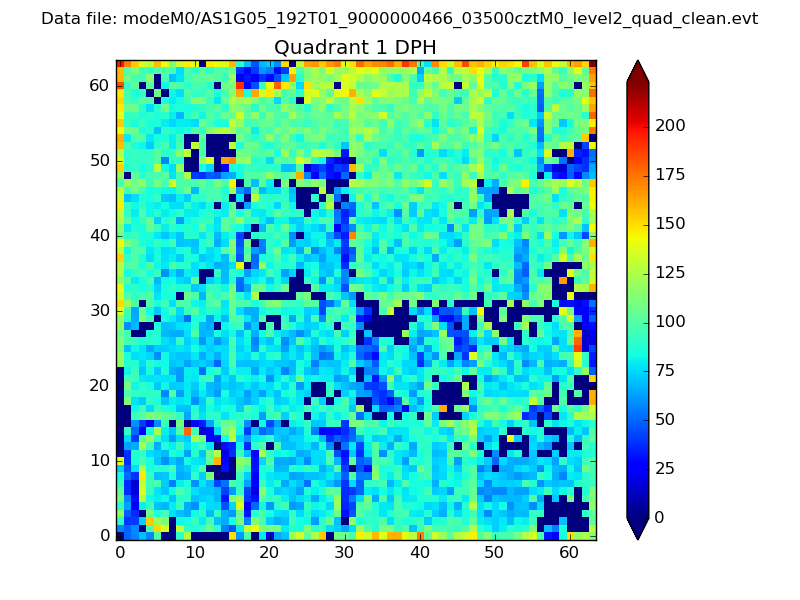 |
Quadrant B |
|---|---|---|---|
| Quadrant D | 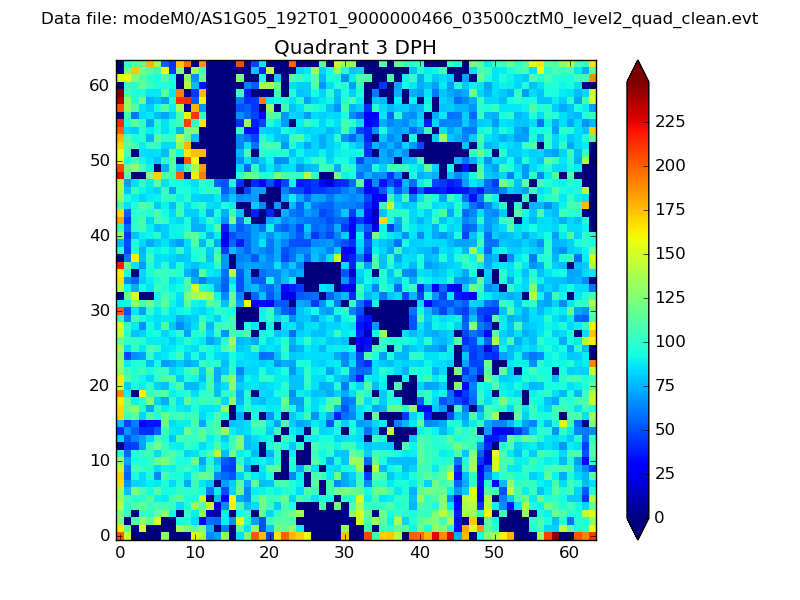 |
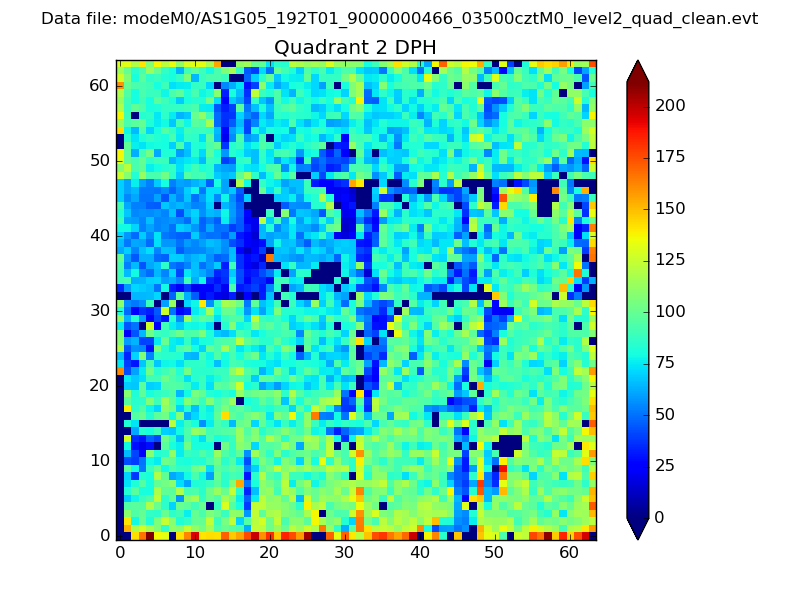 |
Quadrant C |
| Plot type | Count rate plots | Images |
|---|---|---|
| Comparison with Poisson distribution Blue bars denote a histogram of data divided into 1 sec bins. Red curve is a Poisson curve with rate = median count rate of data. |
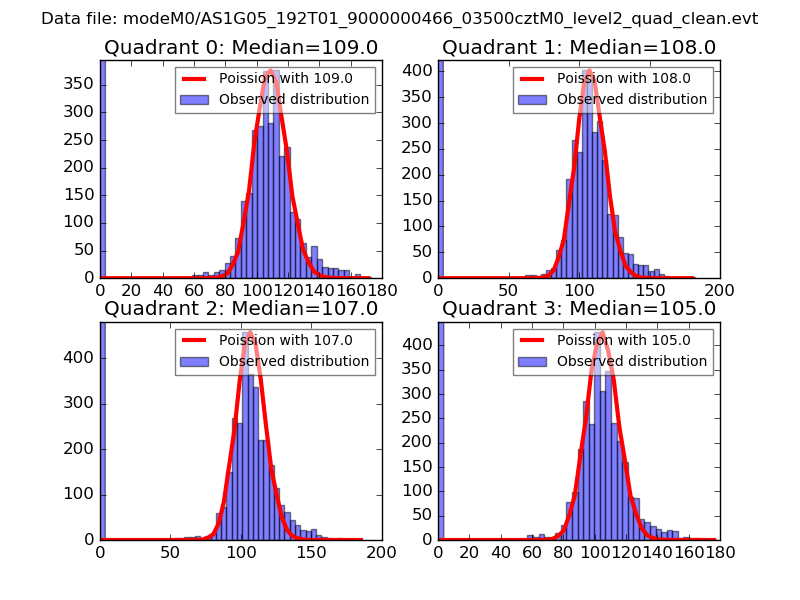 |
 |
| Quadrant-wise count rates Data is divided into 100 sec bins |
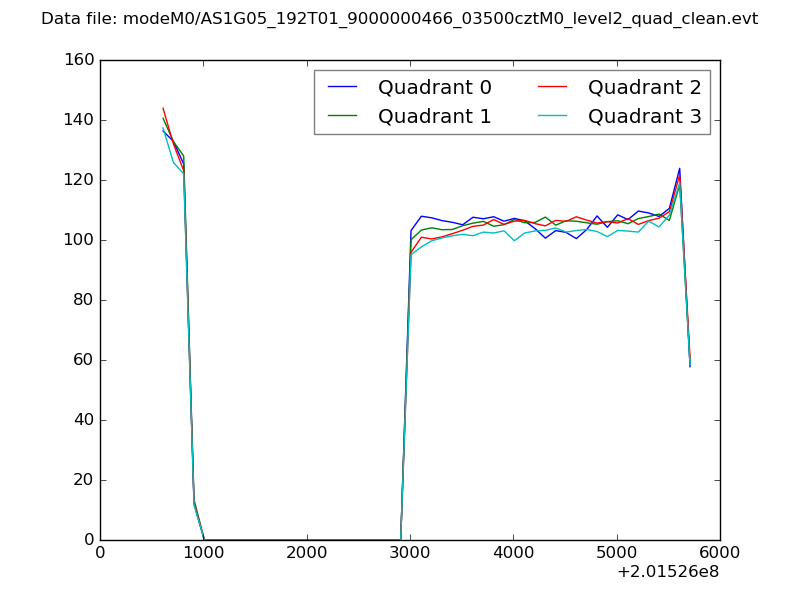 |
|
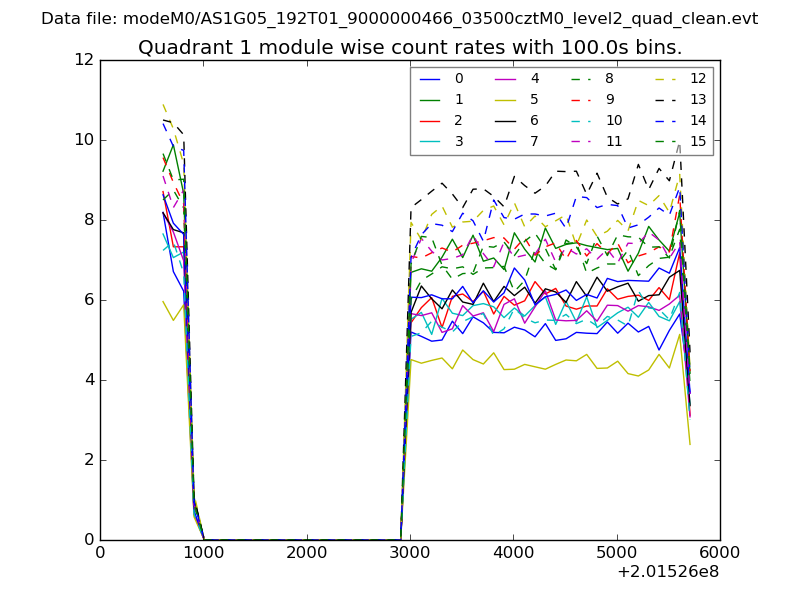
| Module-wise count rates for Quadrant A Data is divided into 100 sec bins |
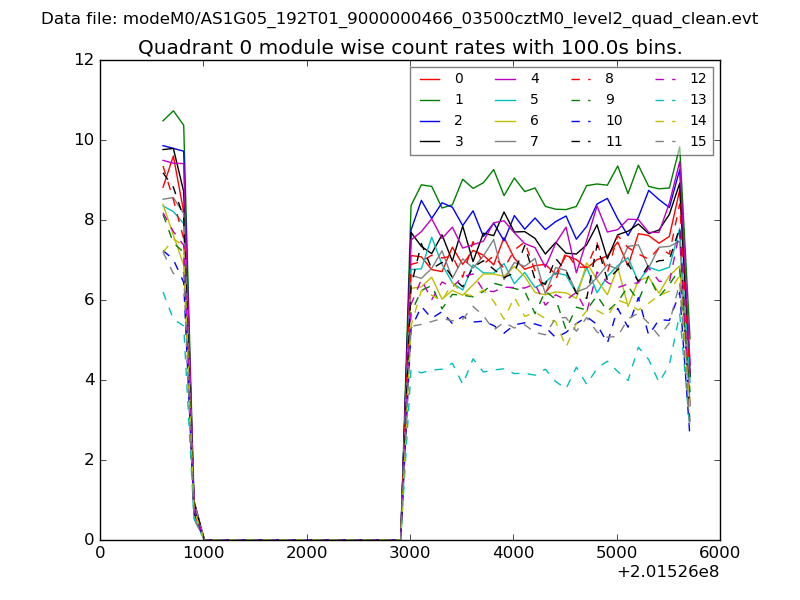 |
 |
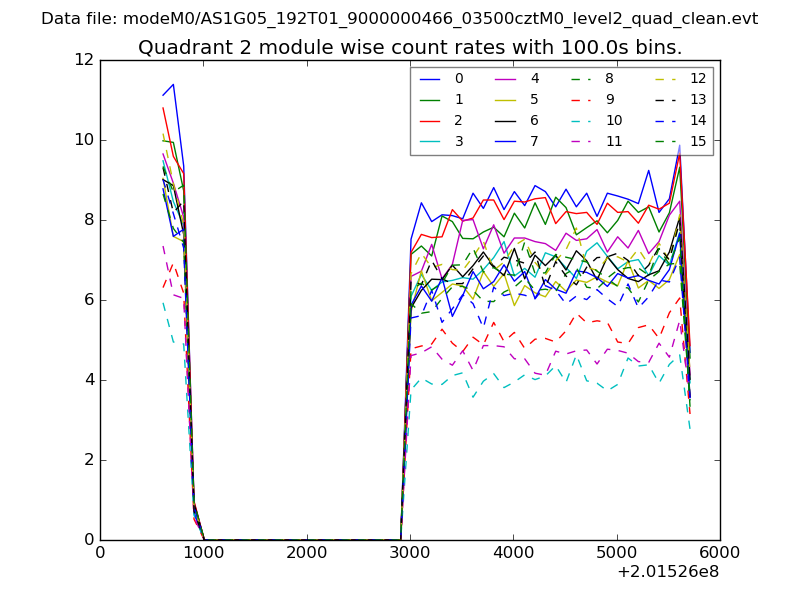
| Module-wise count rates for Quadrant B Data is divided into 100 sec bins |
 |
 |
| Module-wise count rates for Quadrant C Data is divided into 100 sec bins |
 |
 |
| Module-wise count rates for Quadrant D Data is divided into 100 sec bins |
 |
 |
| Parameter | Plot |
|---|---|
| CZT HV Monitor | 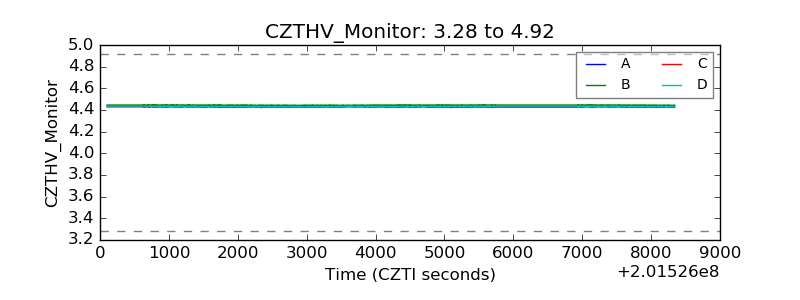 |
| D_VDD | 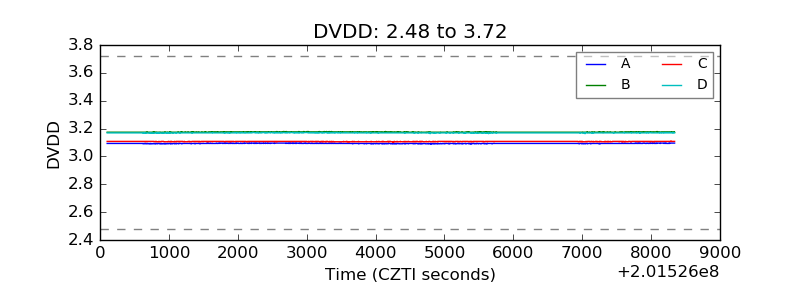 |
| Temperature 1 | 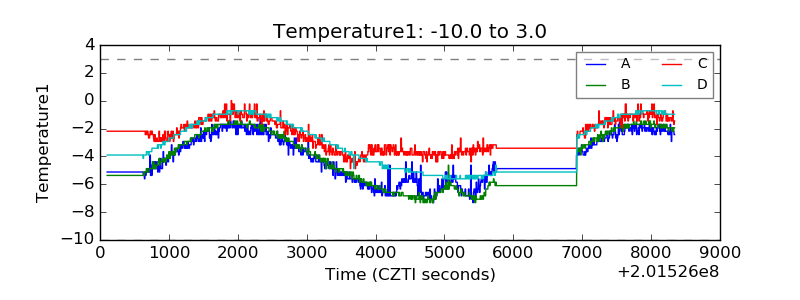 |
| Veto HV Monitor | 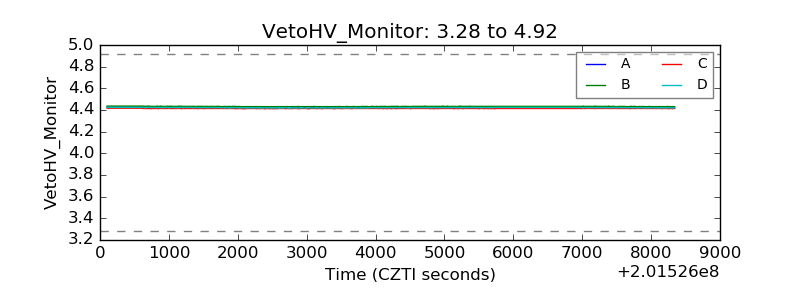 |
| Veto LLD | 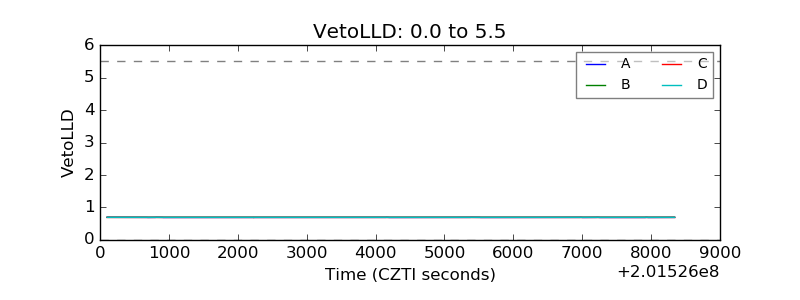 |
| Alpha Counter | 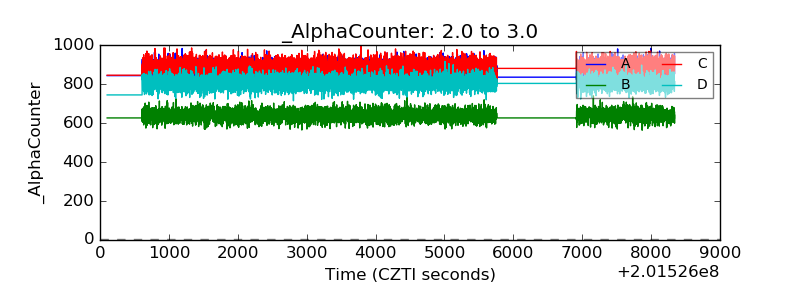 |
| _CPM_Rate | 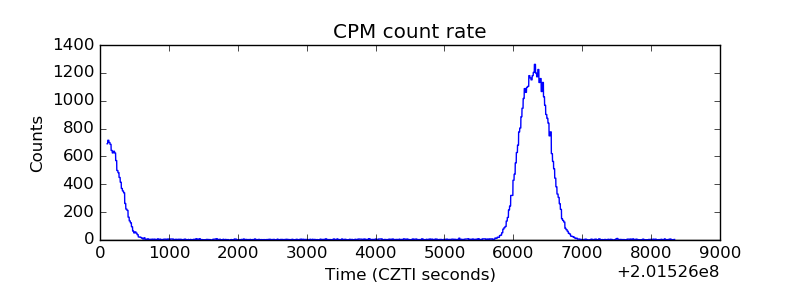 |
| CZT Counter | 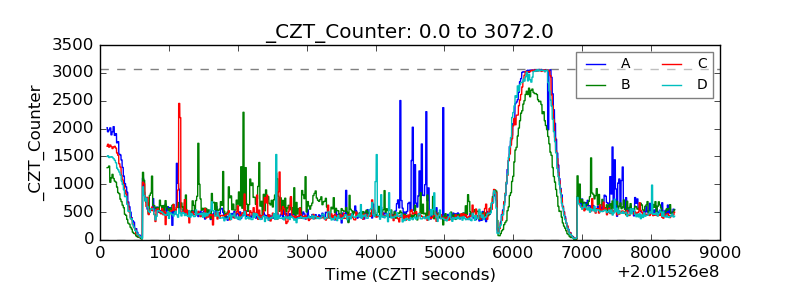 |
| +2.5 Volts monitor |  |
| +5 Volts monitor |  |
| Veto Counter | 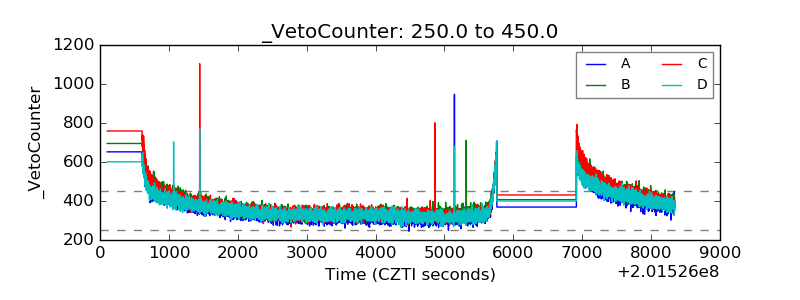 |