| Param | Original file | Final file |
|---|---|---|
| Filename | modeM0/AS1G05_192T01_9000000466_03501cztM0_level2.evt | modeM0/AS1G05_192T01_9000000466_03501cztM0_level2_quad_clean.evt |
| Size (bytes) | 476,222,400 | 58,720,320 |
| Size | 454.2 MB | 56.0 MB |
| Events in quadrant A | 3,791,732 | 331,391 |
| Events in quadrant B | 3,931,813 | 334,843 |
| Events in quadrant C | 3,190,522 | 334,382 |
| Events in quadrant D | 3,070,640 | 327,193 |
| Mode M9 | |||
|---|---|---|---|
| Quadrant | BADHDUFLAG | Total packets | Discarded packets |
| A | 0 | 18 | 0 |
| B | 0 | 18 | 0 |
| C | 0 | 18 | 0 |
| D | 0 | 19 | 0 |
| Mode SS | |||
|---|---|---|---|
| Quadrant | BADHDUFLAG | Total packets | Discarded packets |
| A | 0 | 130 | 0 |
| B | 0 | 130 | 0 |
| C | 0 | 130 | 0 |
| D | 0 | 130 | 0 |
| Mode M0 | |||
|---|---|---|---|
| Quadrant | BADHDUFLAG | Total packets | Discarded packets |
| A | 0 | 15485 | 3 |
| B | 0 | 16004 | 2 |
| C | 0 | 13734 | 2 |
| D | 0 | 13581 | 2 |
| Quadrant | Total seconds | Saturated seconds | Saturation percentage |
|---|---|---|---|
| A | 6449 | 206 | 3.194294% |
| B | 6449 | 115 | 1.783222% |
| C | 6449 | 65 | 1.007908% |
| D | 6449 | 77 | 1.193984% |
Noise dominated data is calculated using 1-second bins in cleaned event files. If a bin has >2000 counts, and if more than 50% of those come from <1% of pixels, then it is considered to be noise-dominated and hence unusable.
| Quadrant | # 1 sec bins | Bins with >0 counts | Bins with >2000 counts | High rate bins dominated by noise | Noise dominated (total time) | Noise dominated (detector-on time) | Marked lightcurve |
|---|---|---|---|---|---|---|---|
| A | 7684 | 6449 | 101 | 101 | 1.31% | 1.57% | 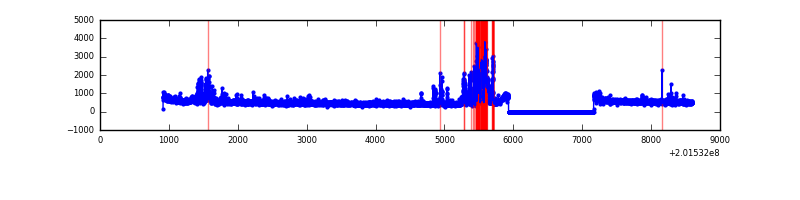 |
| B | 7684 | 6449 | 14 | 14 | 0.18% | 0.22% | 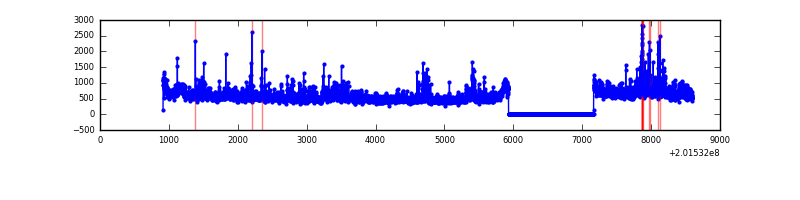 |
| C | 7684 | 6449 | 6 | 6 | 0.08% | 0.09% | 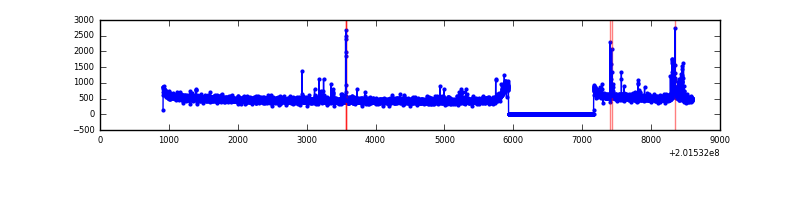 |
| D | 7684 | 6449 | 11 | 11 | 0.14% | 0.17% |  |
Top three noisy pixels from each quadrant. If the there are fewer than three noisy pixels in the level2.evt file, extra rows are filled as -1
| Pixel properties | Quadrant properties | ||||||
|---|---|---|---|---|---|---|---|
| Quadrant | DetID | PixID | Counts | Sigma | Mean | Median | Sigma |
| A | 0 | 50 | 391313 | 2400.18 | 801 | 785 | 162.7 |
| A | 14 | 238 | 149041 | 911.18 | 801 | 785 | 162.7 |
| A | 8 | 15 | 104260 | 635.96 | 801 | 785 | 162.7 |
| B | 15 | 204 | 532001 | 3474.84 | 811 | 794 | 152.9 |
| B | 4 | 81 | 88830 | 575.88 | 811 | 794 | 152.9 |
| B | 2 | 249 | 63831 | 412.35 | 811 | 794 | 152.9 |
| C | 7 | 220 | 63358 | 347.37 | 781 | 786 | 180.1 |
| C | 1 | 192 | 35443 | 192.4 | 781 | 786 | 180.1 |
| C | 1 | 16 | 29242 | 157.97 | 781 | 786 | 180.1 |
| D | 13 | 223 | 62700 | 329.17 | 780 | 759 | 188.2 |
| D | 5 | 233 | 17708 | 90.07 | 780 | 759 | 188.2 |
| D | 13 | 239 | 15337 | 77.47 | 780 | 759 | 188.2 |
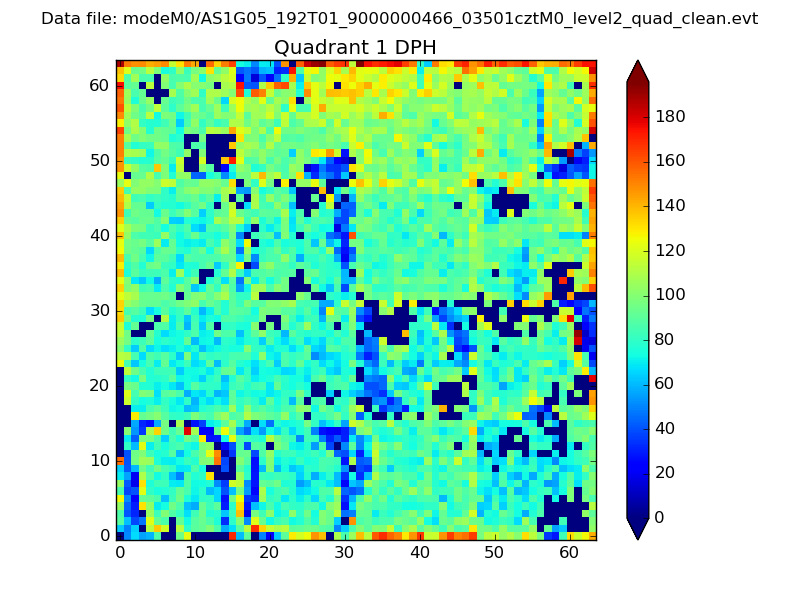
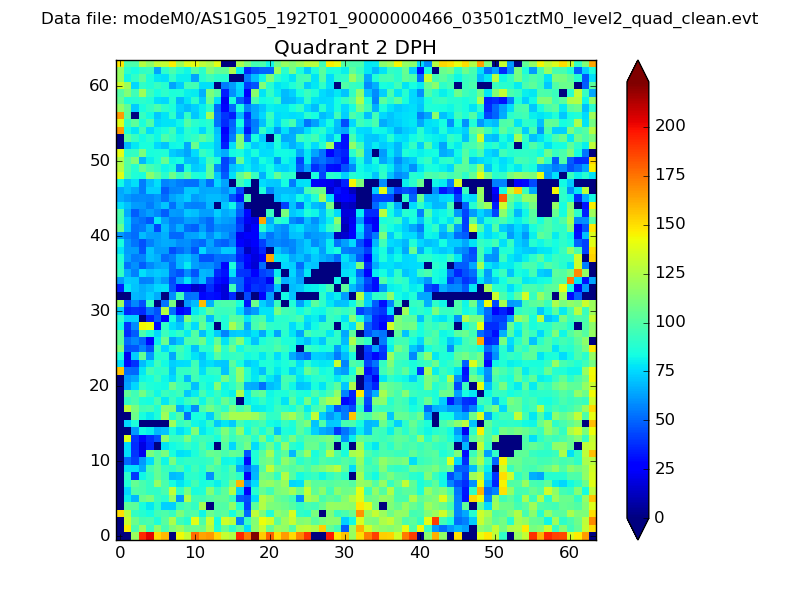
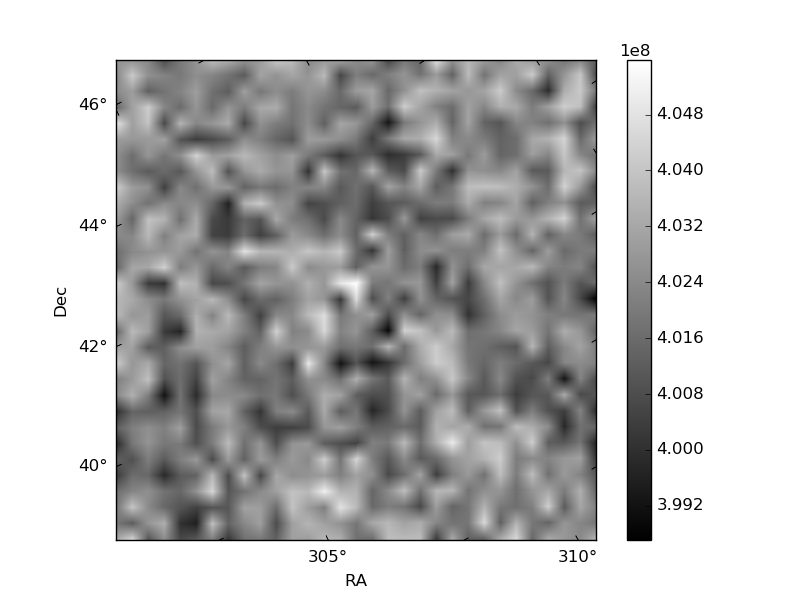
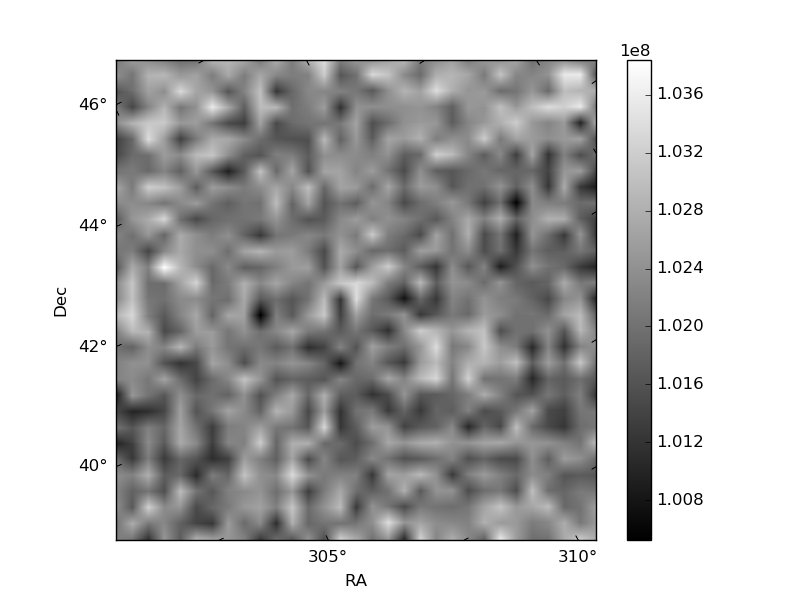
Histogram calculated using DETX and DETY for each event in the final _common_clean file
| Quadrant A | 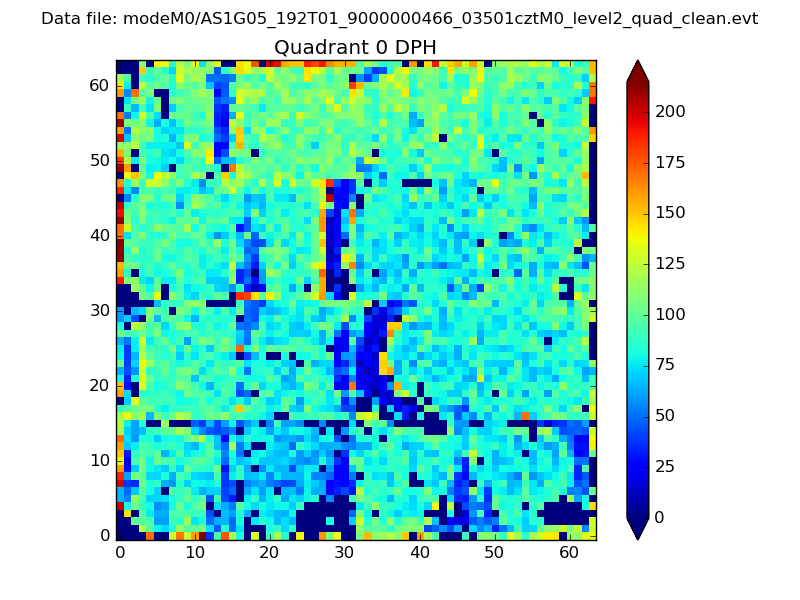 |
 |
Quadrant B |
|---|---|---|---|
| Quadrant D | 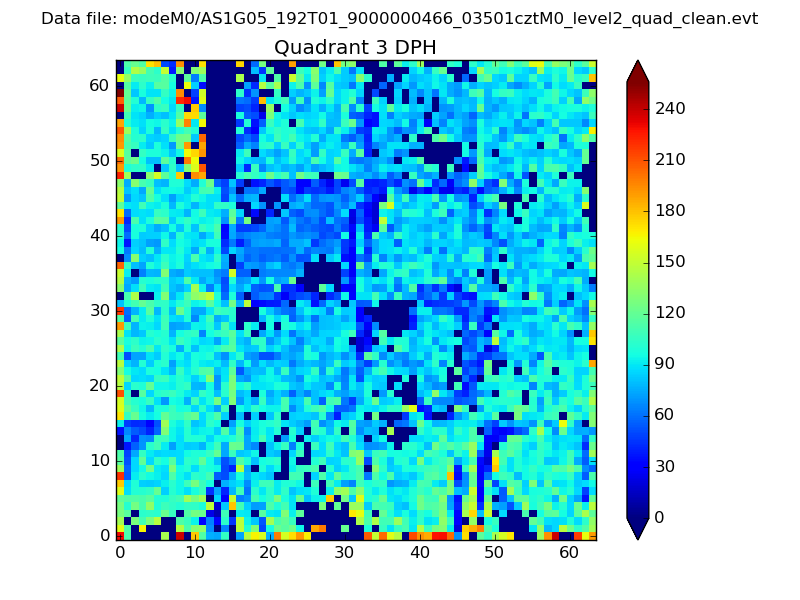 |
 |
Quadrant C |
| Plot type | Count rate plots | Images |
|---|---|---|
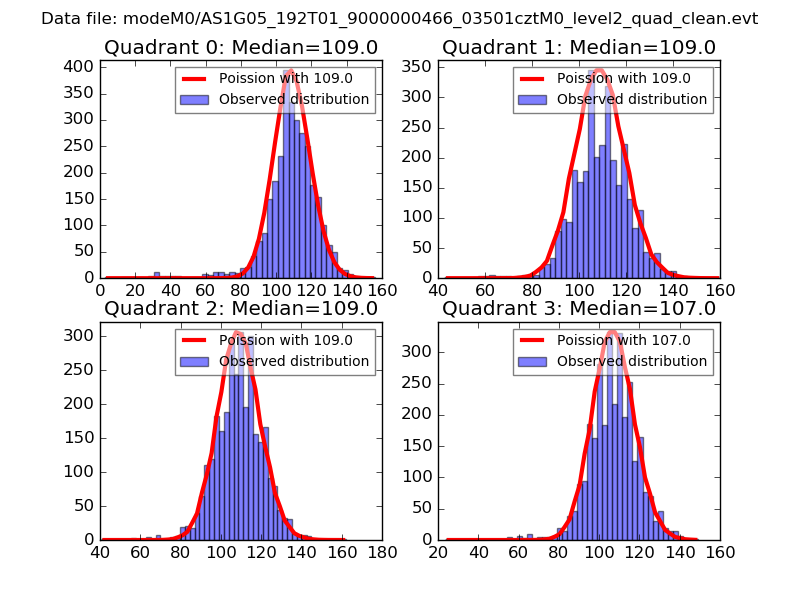
| Comparison with Poisson distribution Blue bars denote a histogram of data divided into 1 sec bins. Red curve is a Poisson curve with rate = median count rate of data. |
 |
 |
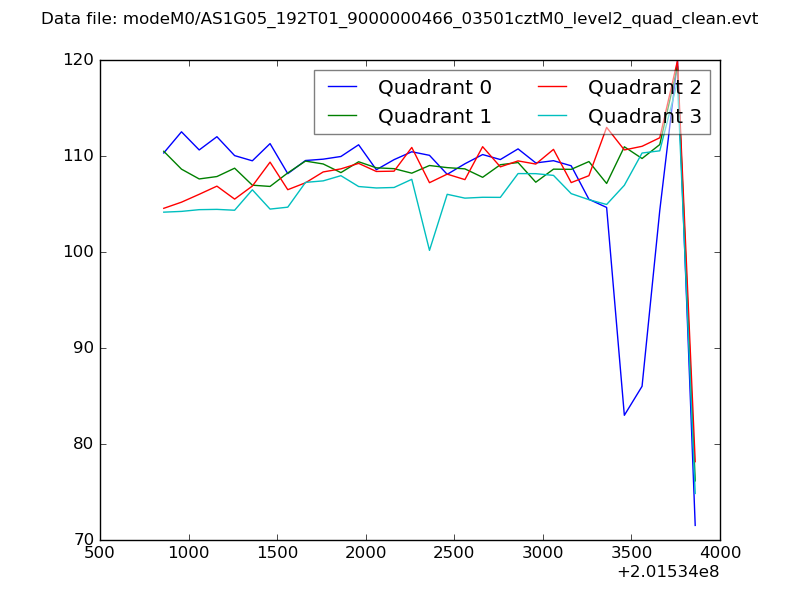
| Quadrant-wise count rates Data is divided into 100 sec bins |
 |
|
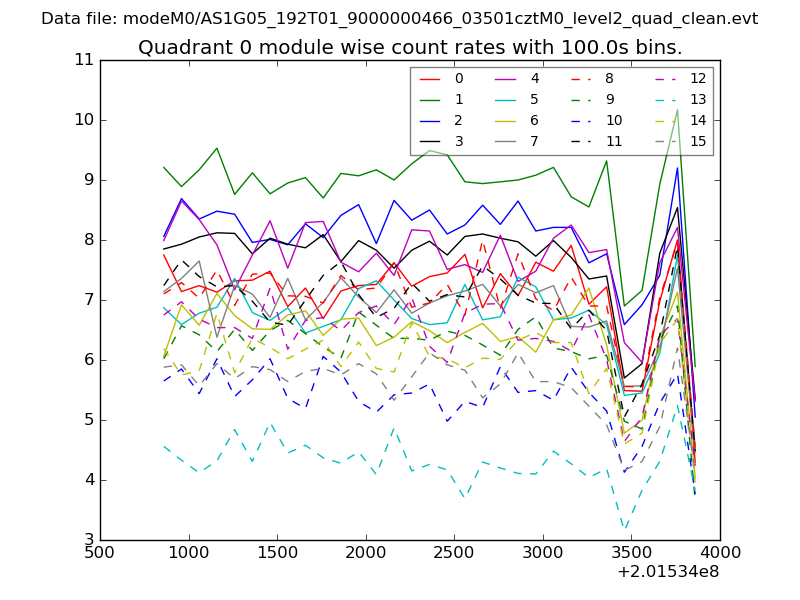
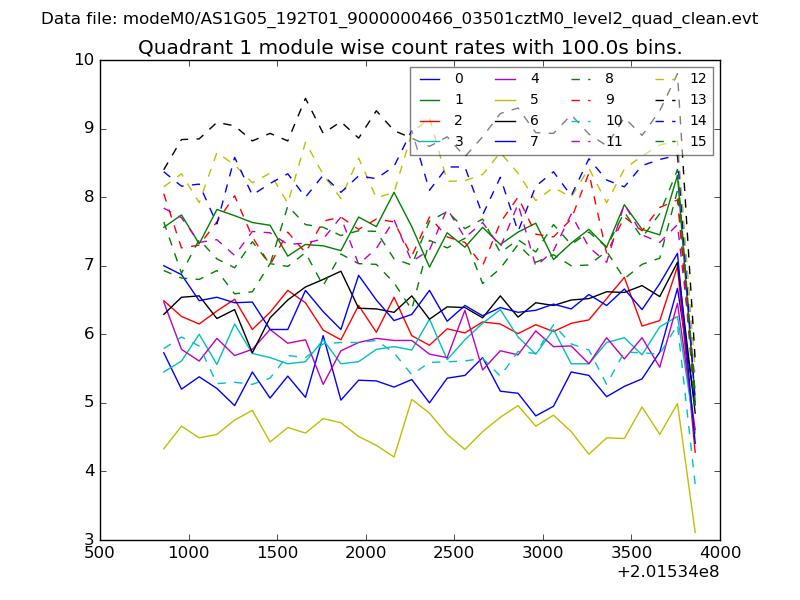
| Module-wise count rates for Quadrant A Data is divided into 100 sec bins |
 |
 |
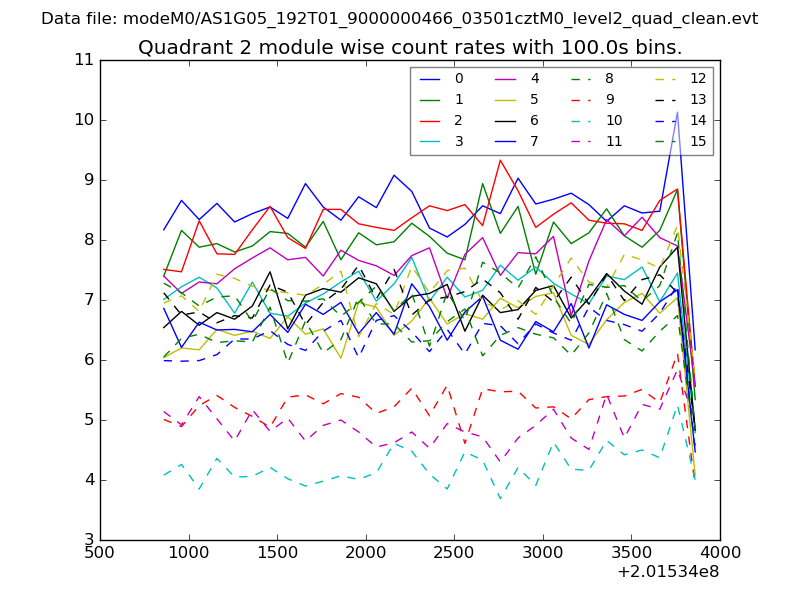
| Module-wise count rates for Quadrant B Data is divided into 100 sec bins |
 |
 |
| Module-wise count rates for Quadrant C Data is divided into 100 sec bins |
 |
 |
| Module-wise count rates for Quadrant D Data is divided into 100 sec bins |
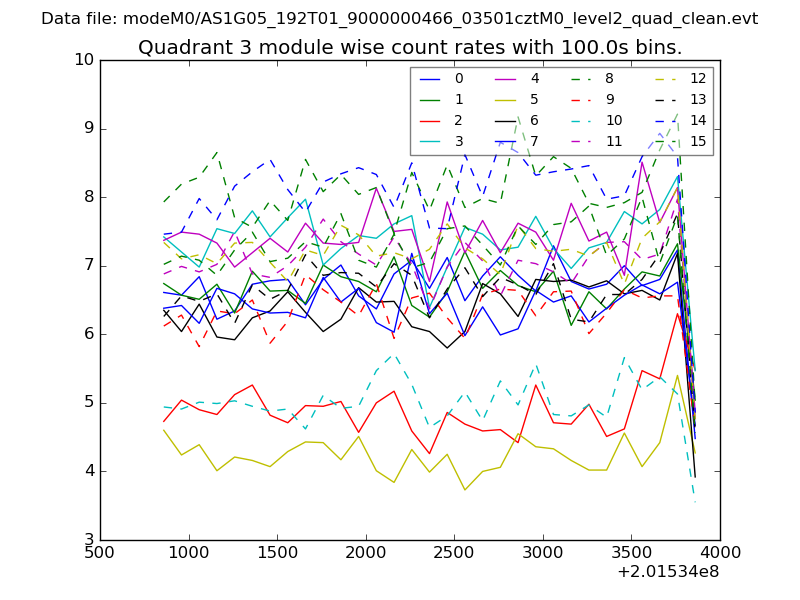 |
 |
| Parameter | Plot |
|---|---|
| CZT HV Monitor | 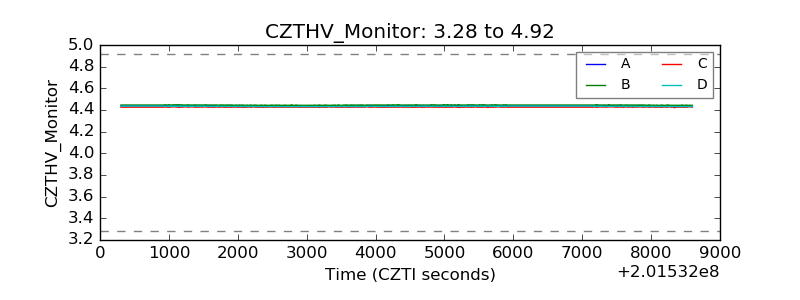 |
| D_VDD | 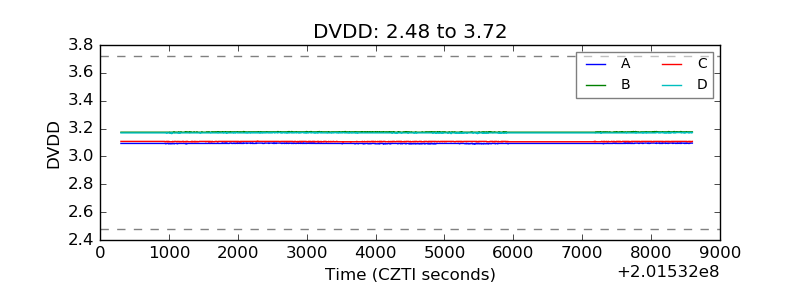 |
| Temperature 1 | 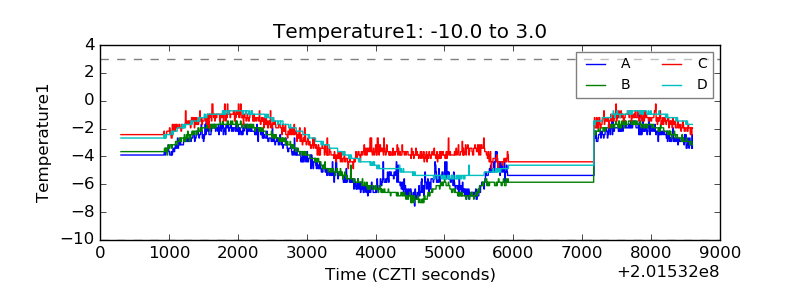 |
| Veto HV Monitor | 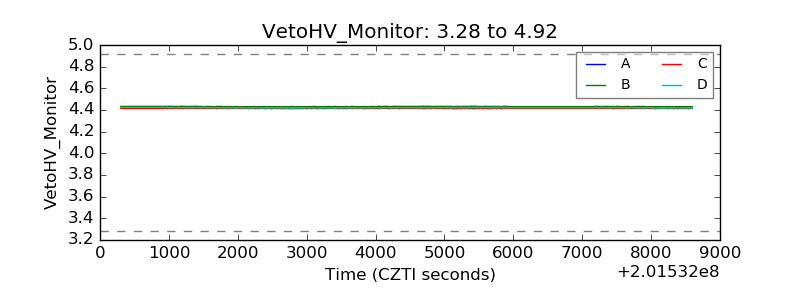 |
| Veto LLD | 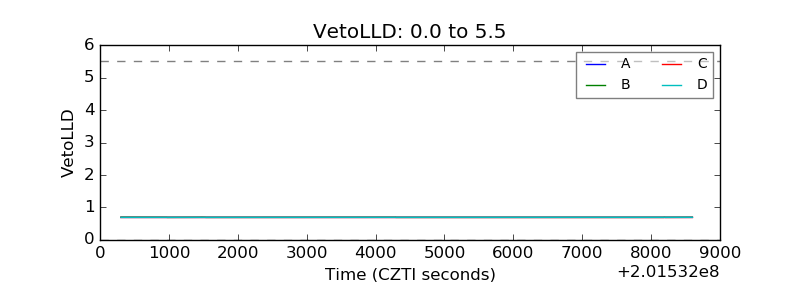 |
| Alpha Counter | 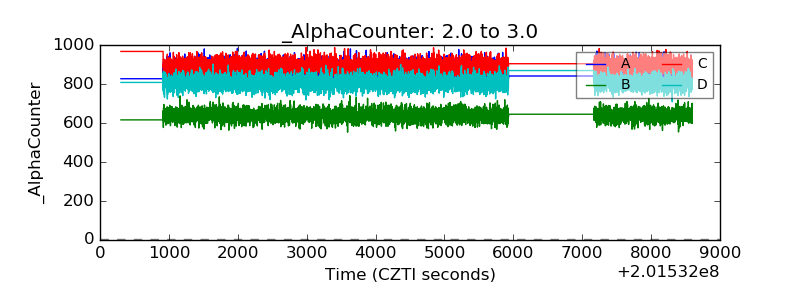 |
| _CPM_Rate | 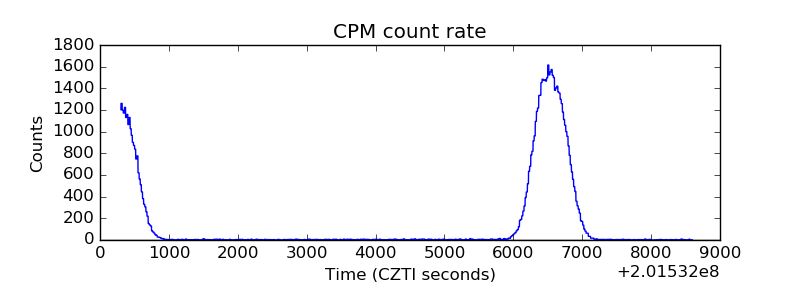 |
| CZT Counter | 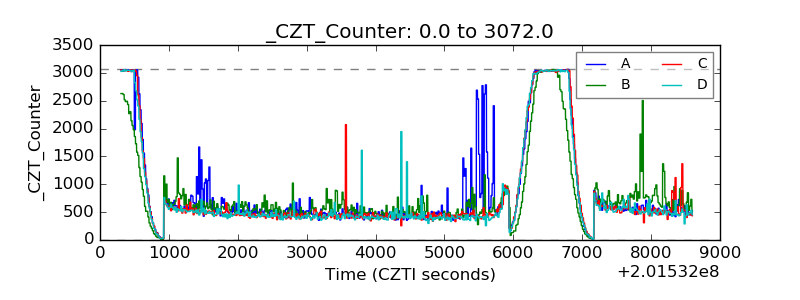 |
| +2.5 Volts monitor |  |
| +5 Volts monitor | 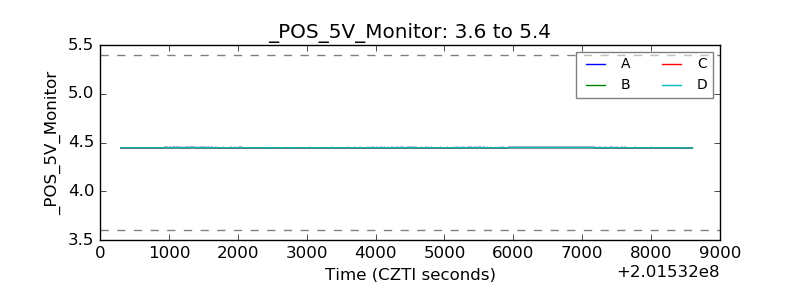 |
| Veto Counter | 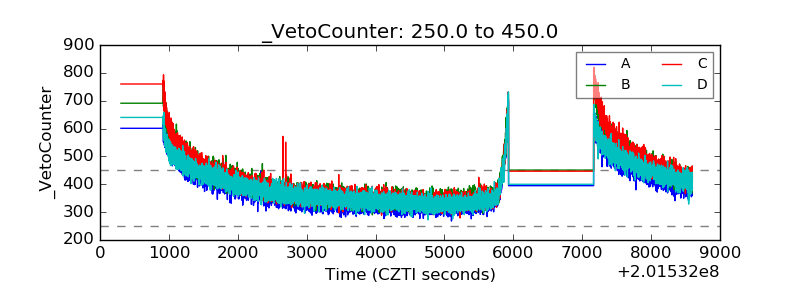 |