| Param | Original file | Final file |
|---|---|---|
| Filename | modeM0/AS1G05_192T01_9000000466_03503cztM0_level2.evt | modeM0/AS1G05_192T01_9000000466_03503cztM0_level2_quad_clean.evt |
| Size (bytes) | 397,108,800 | 78,909,120 |
| Size | 378.7 MB | 75.3 MB |
| Events in quadrant A | 2,849,462 | 498,800 |
| Events in quadrant B | 3,084,126 | 503,773 |
| Events in quadrant C | 2,994,999 | 502,039 |
| Events in quadrant D | 2,708,212 | 484,367 |
| Mode M9 | |||
|---|---|---|---|
| Quadrant | BADHDUFLAG | Total packets | Discarded packets |
| A | 0 | 13 | 0 |
| B | 0 | 13 | 0 |
| C | 0 | 13 | 0 |
| D | 0 | 13 | 0 |
| Mode SS | |||
|---|---|---|---|
| Quadrant | BADHDUFLAG | Total packets | Discarded packets |
| A | 0 | 118 | 0 |
| B | 0 | 118 | 0 |
| C | 0 | 118 | 0 |
| D | 0 | 118 | 0 |
| Mode M0 | |||
|---|---|---|---|
| Quadrant | BADHDUFLAG | Total packets | Discarded packets |
| A | 0 | 12280 | 2 |
| B | 0 | 12931 | 1 |
| C | 0 | 12608 | 1 |
| D | 0 | 12058 | 1 |
| Quadrant | Total seconds | Saturated seconds | Saturation percentage |
|---|---|---|---|
| A | 5722 | 94 | 1.642782% |
| B | 5722 | 55 | 0.961202% |
| C | 5722 | 56 | 0.978679% |
| D | 5722 | 44 | 0.768962% |
Noise dominated data is calculated using 1-second bins in cleaned event files. If a bin has >2000 counts, and if more than 50% of those come from <1% of pixels, then it is considered to be noise-dominated and hence unusable.
| Quadrant | # 1 sec bins | Bins with >0 counts | Bins with >2000 counts | High rate bins dominated by noise | Noise dominated (total time) | Noise dominated (detector-on time) | Marked lightcurve |
|---|---|---|---|---|---|---|---|
| A | 7067 | 5723 | 33 | 33 | 0.47% | 0.58% | 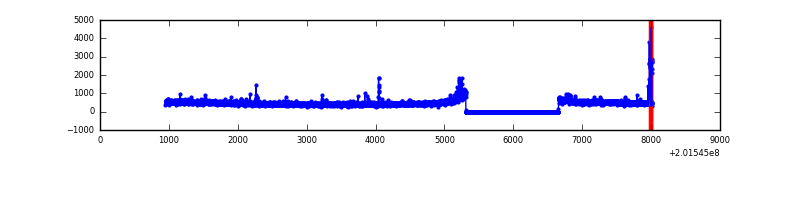 |
| B | 7067 | 5723 | 2 | 2 | 0.03% | 0.03% | 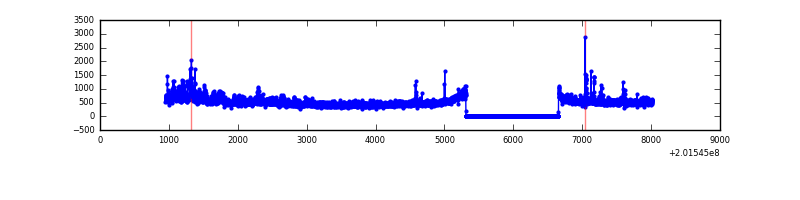 |
| C | 7067 | 5723 | 12 | 12 | 0.17% | 0.21% | 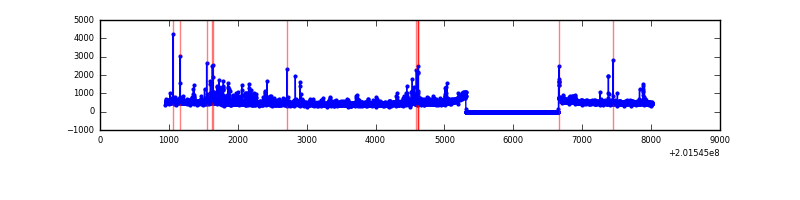 |
| D | 7067 | 5723 | 14 | 14 | 0.20% | 0.24% | 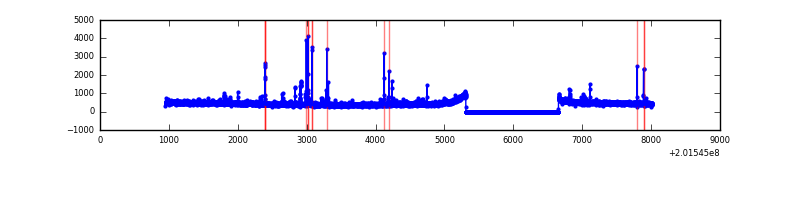 |
Top three noisy pixels from each quadrant. If the there are fewer than three noisy pixels in the level2.evt file, extra rows are filled as -1
| Pixel properties | Quadrant properties | ||||||
|---|---|---|---|---|---|---|---|
| Quadrant | DetID | PixID | Counts | Sigma | Mean | Median | Sigma |
| A | 8 | 15 | 111552 | 796.04 | 688 | 676 | 139.3 |
| A | 0 | 50 | 45204 | 319.69 | 688 | 676 | 139.3 |
| A | 14 | 238 | 16807 | 115.81 | 688 | 676 | 139.3 |
| B | 15 | 204 | 238423 | 1762.22 | 707 | 692 | 134.9 |
| B | 4 | 81 | 34023 | 247.07 | 707 | 692 | 134.9 |
| B | 4 | 200 | 22770 | 163.66 | 707 | 692 | 134.9 |
| C | 15 | 208 | 135200 | 851.63 | 684 | 689 | 157.9 |
| C | 1 | 16 | 60169 | 376.58 | 684 | 689 | 157.9 |
| C | 7 | 220 | 56411 | 352.79 | 684 | 689 | 157.9 |
| D | 13 | 223 | 55154 | 335.58 | 678 | 661 | 162.4 |
| D | 13 | 239 | 22138 | 132.26 | 678 | 661 | 162.4 |
| D | 12 | 110 | 17162 | 101.62 | 678 | 661 | 162.4 |
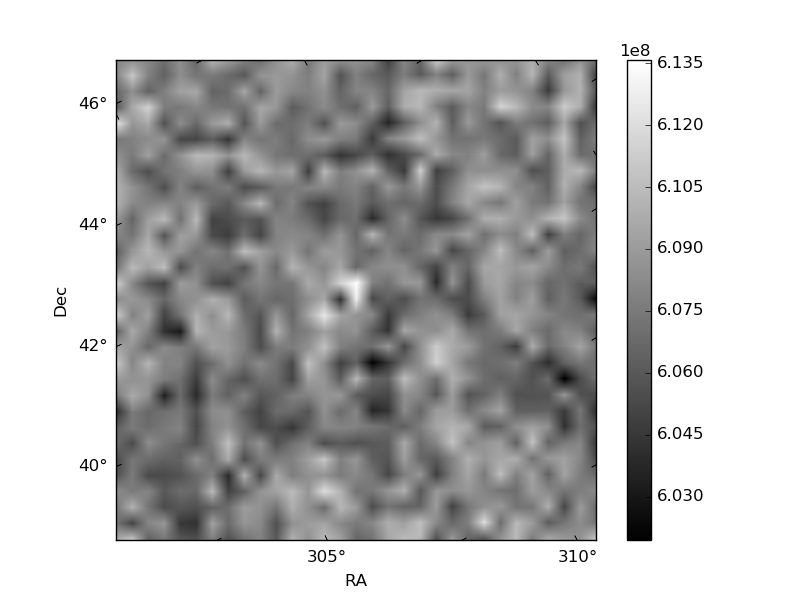
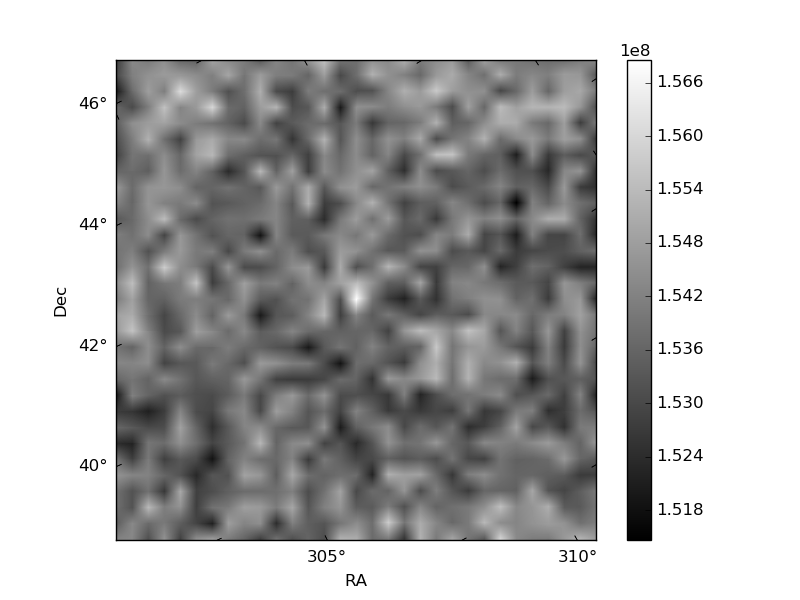
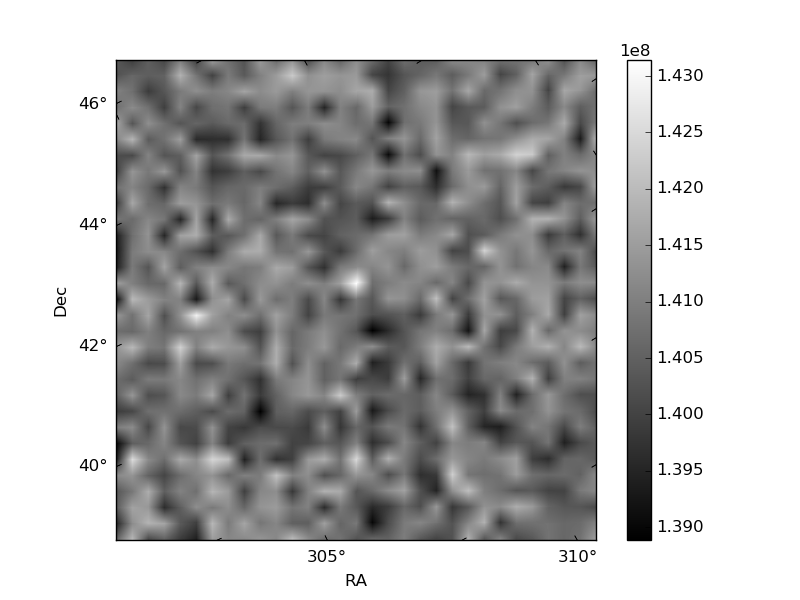
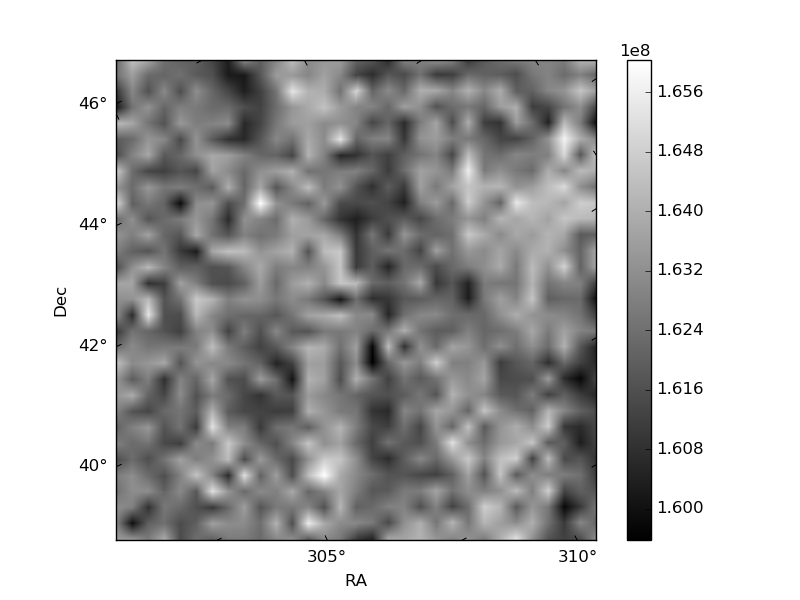
Histogram calculated using DETX and DETY for each event in the final _common_clean file
| Quadrant A | 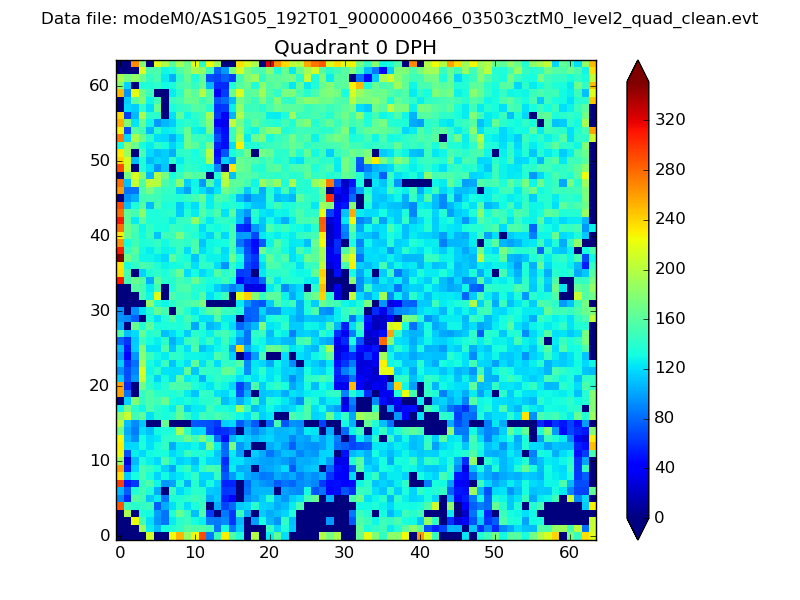 |
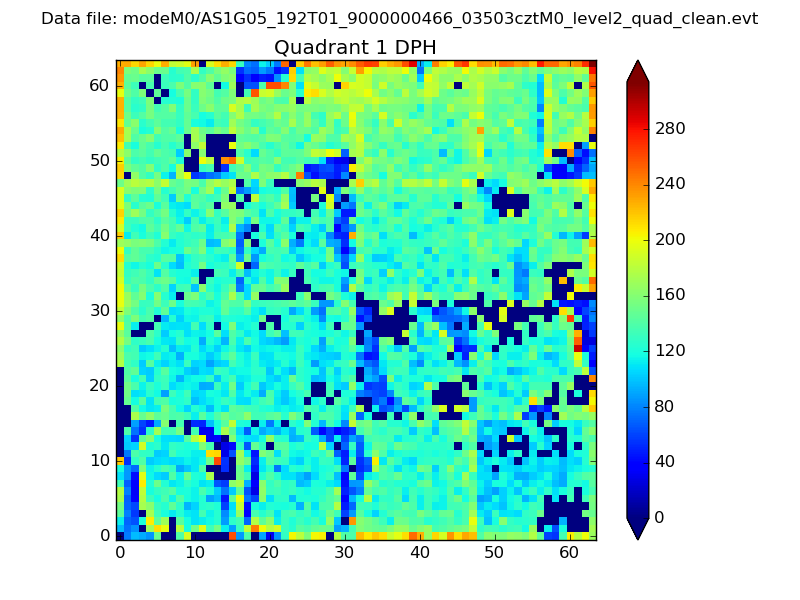 |
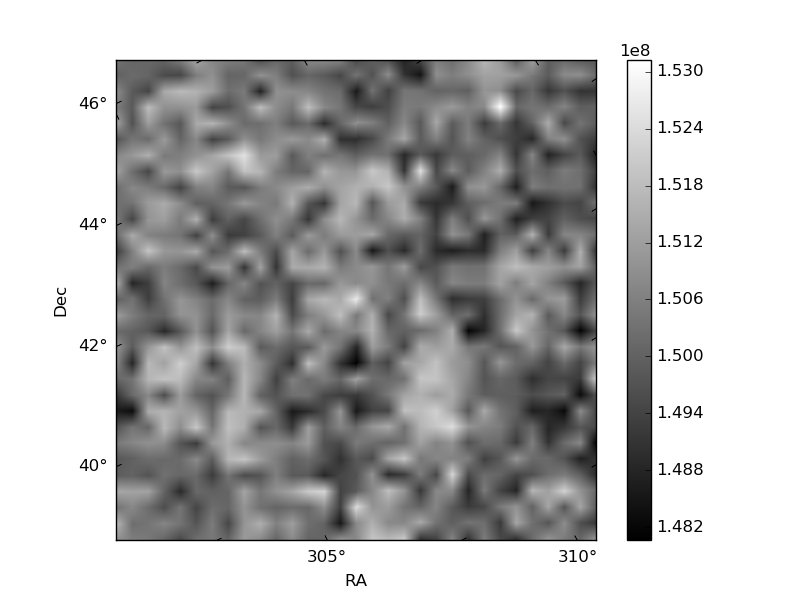
Quadrant B |
|---|---|---|---|
| Quadrant D | 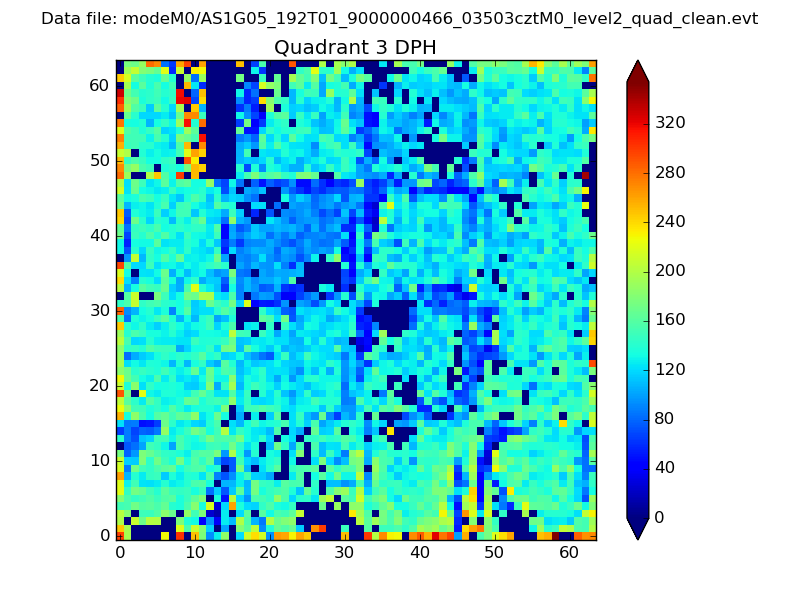 |
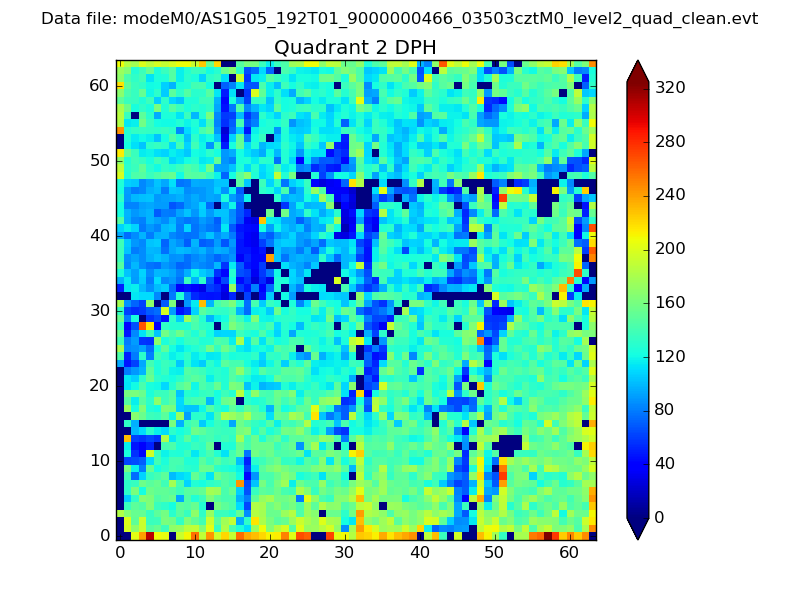 |
Quadrant C |
| Plot type | Count rate plots | Images |
|---|---|---|
| Comparison with Poisson distribution Blue bars denote a histogram of data divided into 1 sec bins. Red curve is a Poisson curve with rate = median count rate of data. |
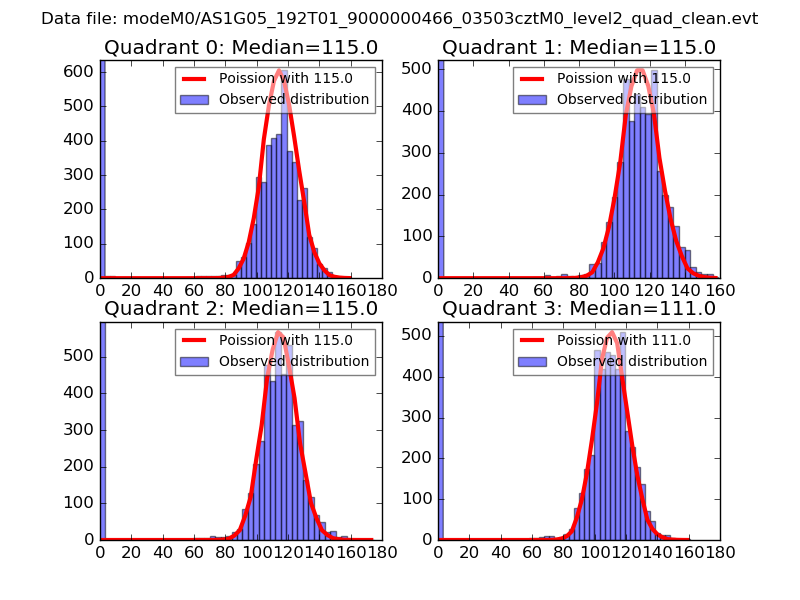 |
 |
| Quadrant-wise count rates Data is divided into 100 sec bins |
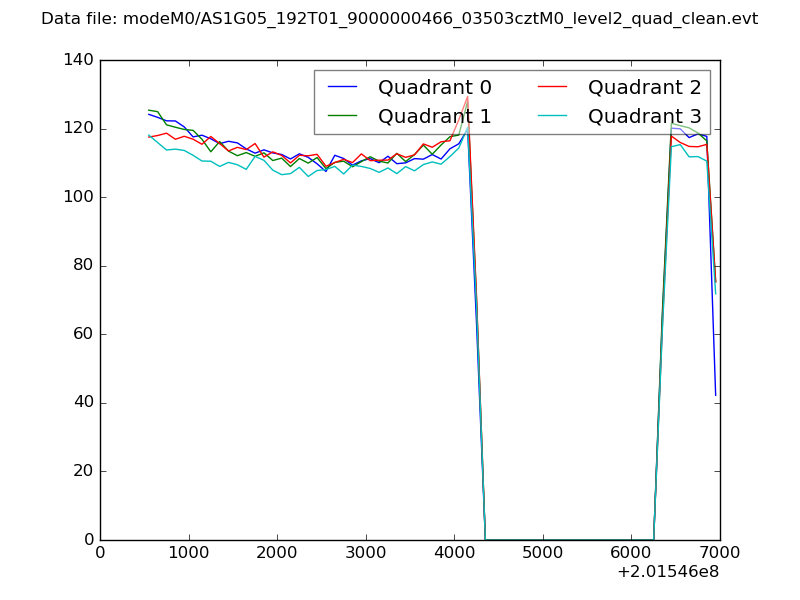 |
|
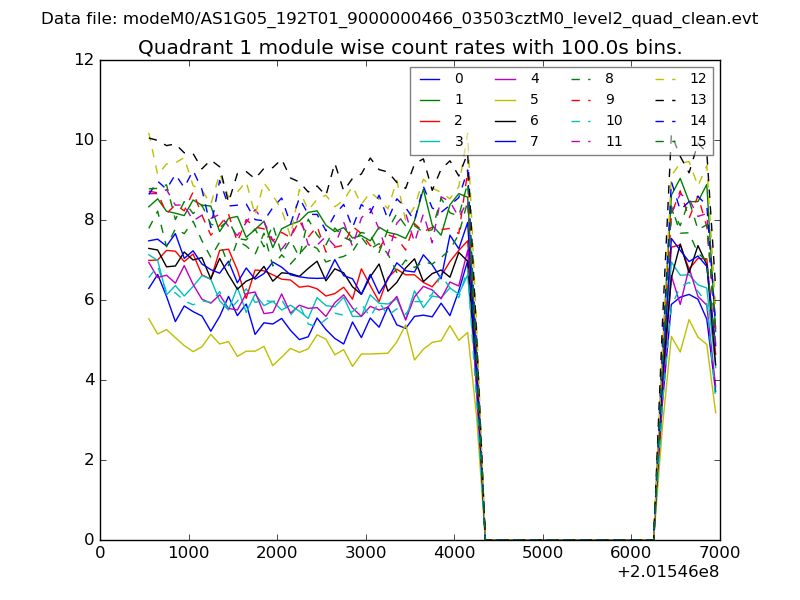
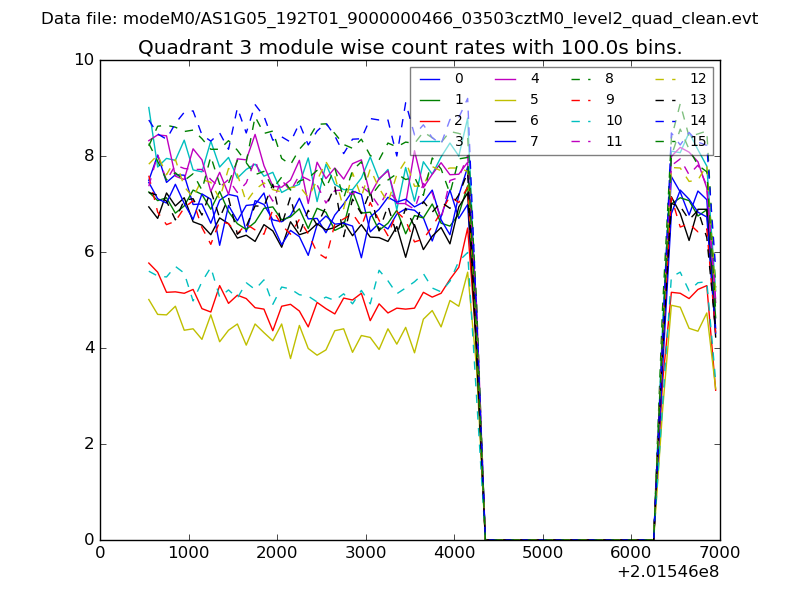
| Module-wise count rates for Quadrant A Data is divided into 100 sec bins |
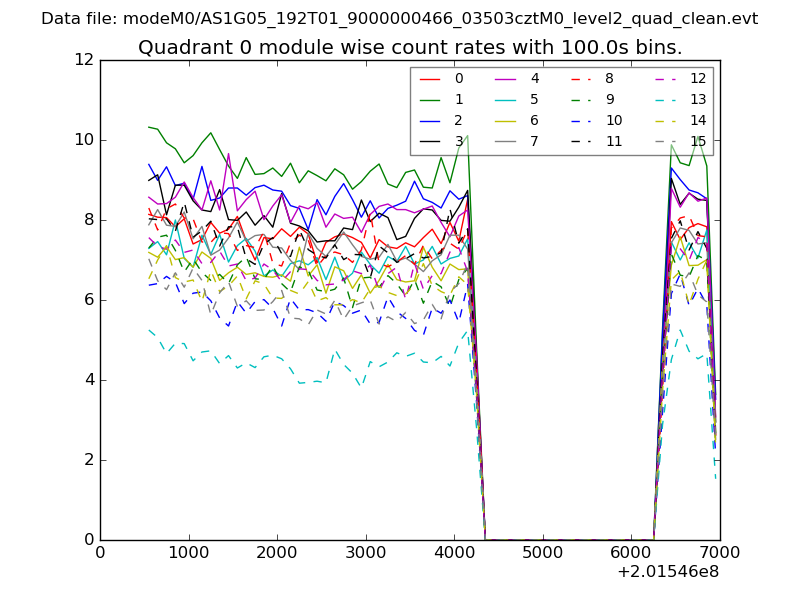 |
 |
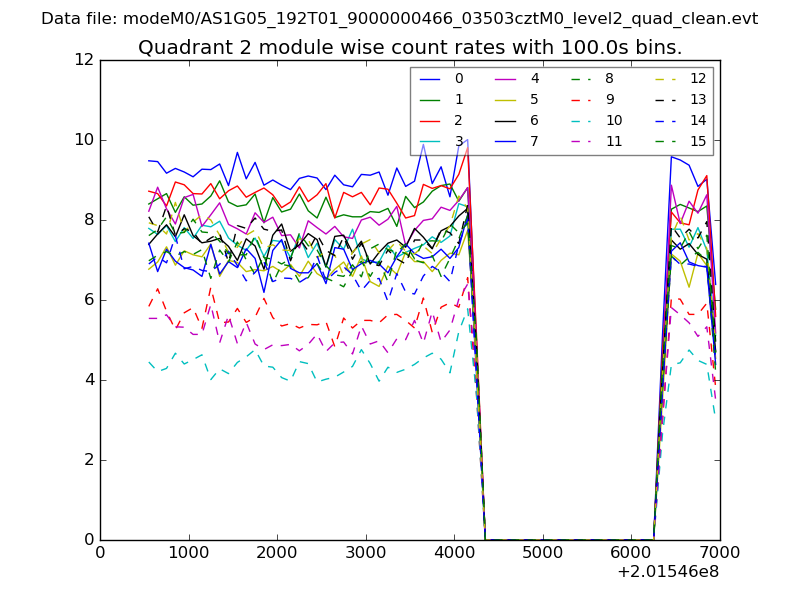
| Module-wise count rates for Quadrant B Data is divided into 100 sec bins |
 |
 |
| Module-wise count rates for Quadrant C Data is divided into 100 sec bins |
 |
 |
| Module-wise count rates for Quadrant D Data is divided into 100 sec bins |
 |
 |
| Parameter | Plot |
|---|---|
| CZT HV Monitor | 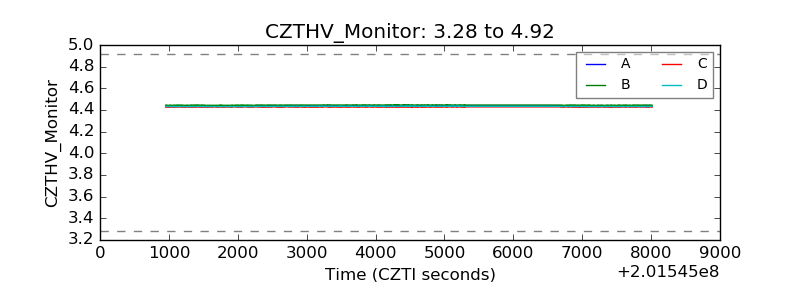 |
| D_VDD | 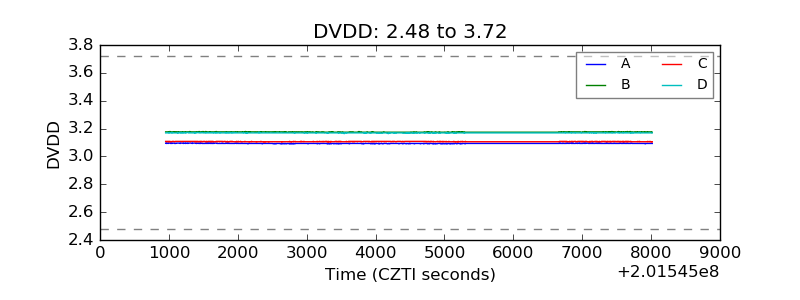 |
| Temperature 1 | 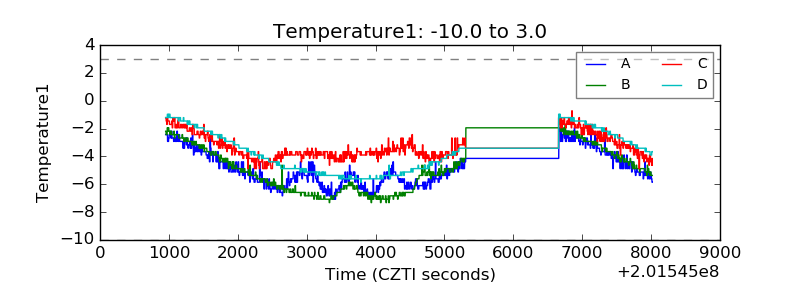 |
| Veto HV Monitor | 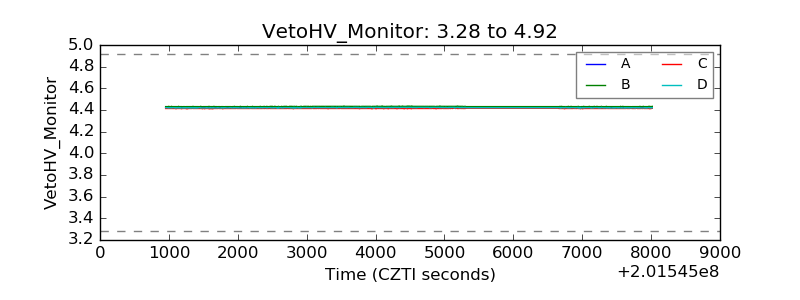 |
| Veto LLD | 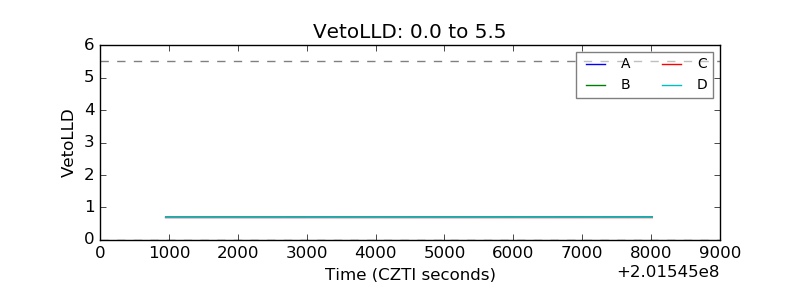 |
| Alpha Counter | 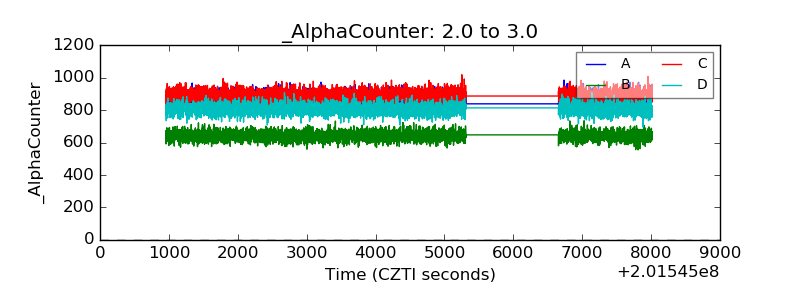 |
| _CPM_Rate | 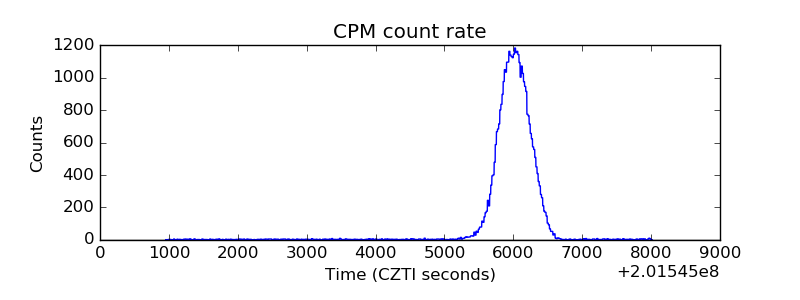 |
| CZT Counter | 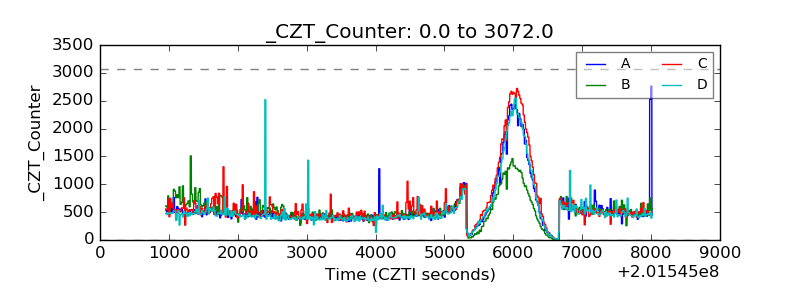 |
| +2.5 Volts monitor |  |
| +5 Volts monitor |  |
| Veto Counter | 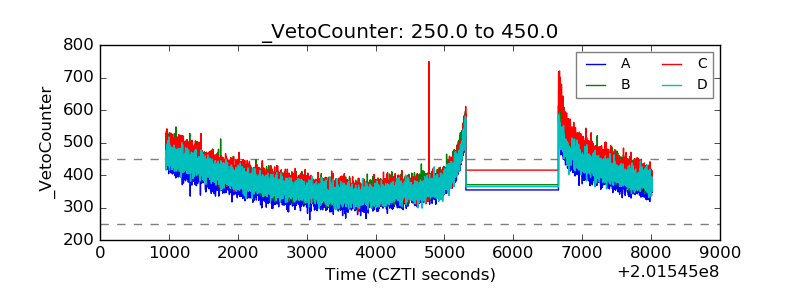 |