| Param | Original file | Final file |
|---|---|---|
| Filename | modeM0/AS1G05_192T01_9000000466_03504cztM0_level2.evt | modeM0/AS1G05_192T01_9000000466_03504cztM0_level2_quad_clean.evt |
| Size (bytes) | 405,861,120 | 82,851,840 |
| Size | 387.1 MB | 79.0 MB |
| Events in quadrant A | 3,179,071 | 519,705 |
| Events in quadrant B | 3,045,910 | 528,530 |
| Events in quadrant C | 2,892,968 | 527,226 |
| Events in quadrant D | 2,761,352 | 510,445 |
| Mode M9 | |||
|---|---|---|---|
| Quadrant | BADHDUFLAG | Total packets | Discarded packets |
| A | 0 | 12 | 0 |
| B | 0 | 12 | 0 |
| C | 0 | 12 | 0 |
| D | 0 | 12 | 0 |
| Mode SS | |||
|---|---|---|---|
| Quadrant | BADHDUFLAG | Total packets | Discarded packets |
| A | 0 | 122 | 0 |
| B | 0 | 122 | 0 |
| C | 0 | 122 | 0 |
| D | 0 | 122 | 0 |
| Mode M0 | |||
|---|---|---|---|
| Quadrant | BADHDUFLAG | Total packets | Discarded packets |
| A | 0 | 13482 | 2 |
| B | 0 | 13052 | 1 |
| C | 0 | 12722 | 1 |
| D | 0 | 12668 | 1 |
| Quadrant | Total seconds | Saturated seconds | Saturation percentage |
|---|---|---|---|
| A | 6062 | 125 | 2.062026% |
| B | 6062 | 71 | 1.171231% |
| C | 6062 | 68 | 1.121742% |
| D | 6062 | 75 | 1.237215% |
Noise dominated data is calculated using 1-second bins in cleaned event files. If a bin has >2000 counts, and if more than 50% of those come from <1% of pixels, then it is considered to be noise-dominated and hence unusable.
| Quadrant | # 1 sec bins | Bins with >0 counts | Bins with >2000 counts | High rate bins dominated by noise | Noise dominated (total time) | Noise dominated (detector-on time) | Marked lightcurve |
|---|---|---|---|---|---|---|---|
| A | 7262 | 6063 | 56 | 56 | 0.77% | 0.92% | 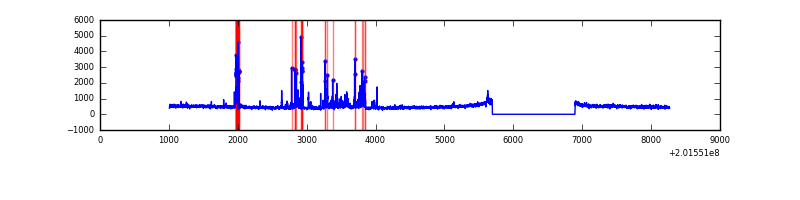 |
| B | 7262 | 6063 | 3 | 3 | 0.04% | 0.05% | 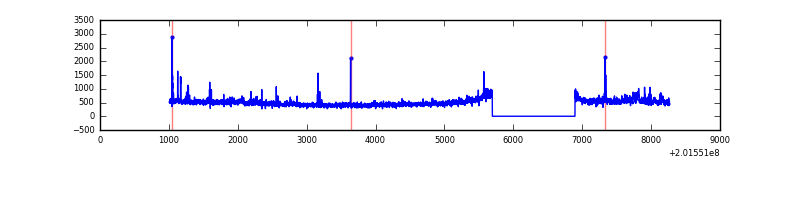 |
| C | 7262 | 6063 | 4 | 4 | 0.06% | 0.07% | 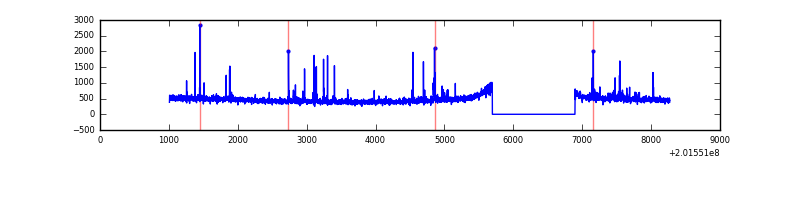 |
| D | 7262 | 6063 | 16 | 16 | 0.22% | 0.26% | 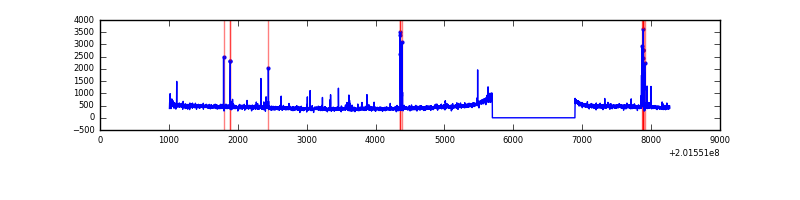 |
Top three noisy pixels from each quadrant. If the there are fewer than three noisy pixels in the level2.evt file, extra rows are filled as -1
| Pixel properties | Quadrant properties | ||||||
|---|---|---|---|---|---|---|---|
| Quadrant | DetID | PixID | Counts | Sigma | Mean | Median | Sigma |
| A | 0 | 50 | 257874 | 1777.96 | 708 | 692 | 144.6 |
| A | 8 | 15 | 155100 | 1067.46 | 708 | 692 | 144.6 |
| A | 14 | 238 | 31509 | 213.05 | 708 | 692 | 144.6 |
| B | 15 | 204 | 155088 | 1099.35 | 726 | 709 | 140.4 |
| B | 4 | 172 | 25093 | 173.64 | 726 | 709 | 140.4 |
| B | 4 | 200 | 24737 | 171.11 | 726 | 709 | 140.4 |
| C | 1 | 192 | 55206 | 332.31 | 705 | 709 | 164.0 |
| C | 1 | 16 | 39151 | 234.41 | 705 | 709 | 164.0 |
| C | 15 | 208 | 36593 | 218.81 | 705 | 709 | 164.0 |
| D | 13 | 223 | 67242 | 400.72 | 696 | 678 | 166.1 |
| D | 7 | 46 | 25543 | 149.69 | 696 | 678 | 166.1 |
| D | 5 | 233 | 16181 | 93.33 | 696 | 678 | 166.1 |
Histogram calculated using DETX and DETY for each event in the final _common_clean file
| Quadrant A |  |
 |
Quadrant B |
|---|---|---|---|
| Quadrant D |  |
 |
Quadrant C |
| Plot type | Count rate plots | Images |
|---|---|---|
| Comparison with Poisson distribution Blue bars denote a histogram of data divided into 1 sec bins. Red curve is a Poisson curve with rate = median count rate of data. |
 |
 |
| Quadrant-wise count rates Data is divided into 100 sec bins |
 |
|
| Module-wise count rates for Quadrant A Data is divided into 100 sec bins |
 |
 |
| Module-wise count rates for Quadrant B Data is divided into 100 sec bins |
 |
 |
| Module-wise count rates for Quadrant C Data is divided into 100 sec bins |
 |
 |
| Module-wise count rates for Quadrant D Data is divided into 100 sec bins |
 |
 |
| Parameter | Plot |
|---|---|
| CZT HV Monitor |  |
| D_VDD | 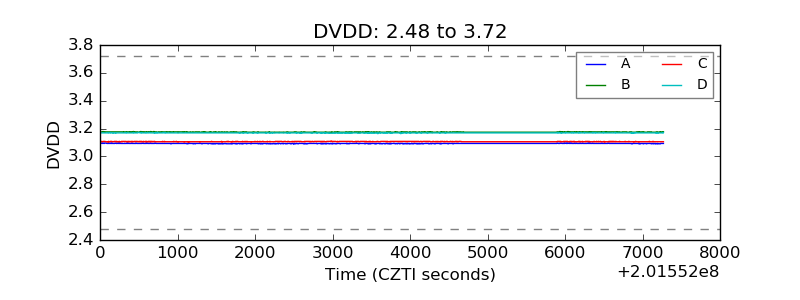 |
| Temperature 1 |  |
| Veto HV Monitor |  |
| Veto LLD |  |
| Alpha Counter |  |
| _CPM_Rate |  |
| CZT Counter |  |
| +2.5 Volts monitor |  |
| +5 Volts monitor |  |
| _ROLL_ROT |  |
| _Roll_DEC |  |
| _Roll_RA |  |
| Veto Counter |  |