| Param | Original file | Final file |
|---|---|---|
| Filename | modeM0/AS1G05_192T01_9000000466_03505cztM0_level2.evt | modeM0/AS1G05_192T01_9000000466_03505cztM0_level2_quad_clean.evt |
| Size (bytes) | 430,041,600 | 87,281,280 |
| Size | 410.1 MB | 83.2 MB |
| Events in quadrant A | 3,401,836 | 549,192 |
| Events in quadrant B | 3,221,850 | 551,522 |
| Events in quadrant C | 3,079,152 | 552,653 |
| Events in quadrant D | 2,877,036 | 534,616 |
| Mode M9 | |||
|---|---|---|---|
| Quadrant | BADHDUFLAG | Total packets | Discarded packets |
| A | 0 | 8 | 0 |
| B | 0 | 8 | 0 |
| C | 0 | 8 | 0 |
| D | 0 | 8 | 0 |
| Mode SS | |||
|---|---|---|---|
| Quadrant | BADHDUFLAG | Total packets | Discarded packets |
| A | 0 | 134 | 0 |
| B | 0 | 134 | 0 |
| C | 0 | 134 | 0 |
| D | 0 | 134 | 0 |
| Mode M0 | |||
|---|---|---|---|
| Quadrant | BADHDUFLAG | Total packets | Discarded packets |
| A | 0 | 14549 | 2 |
| B | 0 | 14083 | 1 |
| C | 0 | 13790 | 1 |
| D | 0 | 13572 | 1 |
| Quadrant | Total seconds | Saturated seconds | Saturation percentage |
|---|---|---|---|
| A | 6522 | 67 | 1.027292% |
| B | 6522 | 48 | 0.735971% |
| C | 6522 | 49 | 0.751303% |
| D | 6522 | 40 | 0.613309% |
Noise dominated data is calculated using 1-second bins in cleaned event files. If a bin has >2000 counts, and if more than 50% of those come from <1% of pixels, then it is considered to be noise-dominated and hence unusable.
| Quadrant | # 1 sec bins | Bins with >0 counts | Bins with >2000 counts | High rate bins dominated by noise | Noise dominated (total time) | Noise dominated (detector-on time) | Marked lightcurve |
|---|---|---|---|---|---|---|---|
| A | 7382 | 6523 | 18 | 18 | 0.24% | 0.28% | 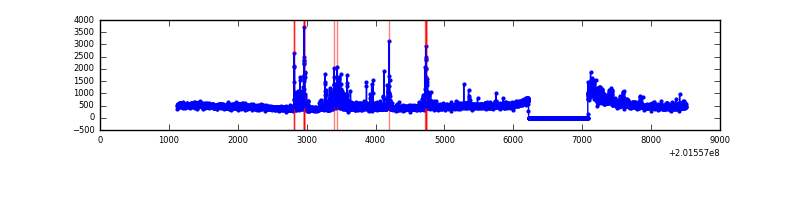 |
| B | 7382 | 6523 | 2 | 2 | 0.03% | 0.03% | 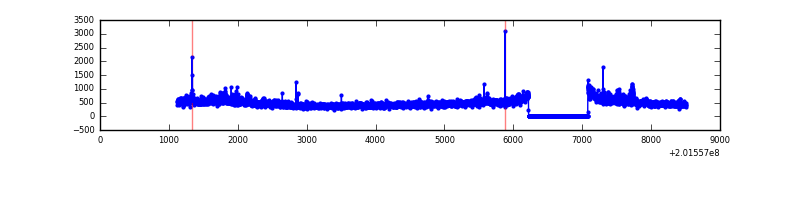 |
| C | 7382 | 6523 | 9 | 9 | 0.12% | 0.14% | 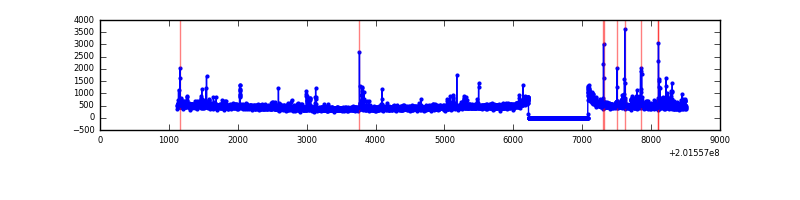 |
| D | 7382 | 6523 | 22 | 22 | 0.30% | 0.34% | 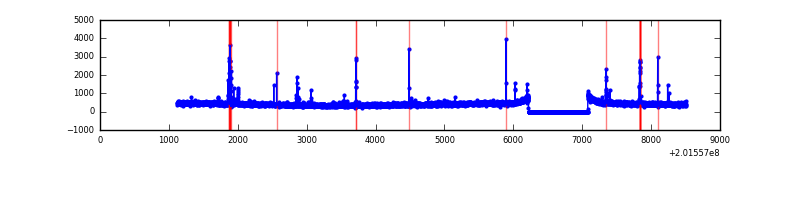 |
Top three noisy pixels from each quadrant. If the there are fewer than three noisy pixels in the level2.evt file, extra rows are filled as -1
| Pixel properties | Quadrant properties | ||||||
|---|---|---|---|---|---|---|---|
| Quadrant | DetID | PixID | Counts | Sigma | Mean | Median | Sigma |
| A | 0 | 50 | 305378 | 2029.03 | 740 | 725 | 150.1 |
| A | 14 | 238 | 169245 | 1122.37 | 740 | 725 | 150.1 |
| A | 8 | 15 | 34656 | 225.99 | 740 | 725 | 150.1 |
| B | 15 | 204 | 254610 | 1733.02 | 756 | 738 | 146.5 |
| B | 0 | 229 | 11976 | 76.71 | 756 | 738 | 146.5 |
| B | 4 | 200 | 11102 | 70.75 | 756 | 738 | 146.5 |
| C | 1 | 192 | 158521 | 931.31 | 730 | 734 | 169.4 |
| C | 15 | 208 | 48250 | 280.45 | 730 | 734 | 169.4 |
| C | 1 | 16 | 16888 | 95.35 | 730 | 734 | 169.4 |
| D | 13 | 223 | 68456 | 387.33 | 723 | 701 | 174.9 |
| D | 13 | 239 | 37040 | 207.74 | 723 | 701 | 174.9 |
| D | 5 | 233 | 23931 | 132.8 | 723 | 701 | 174.9 |
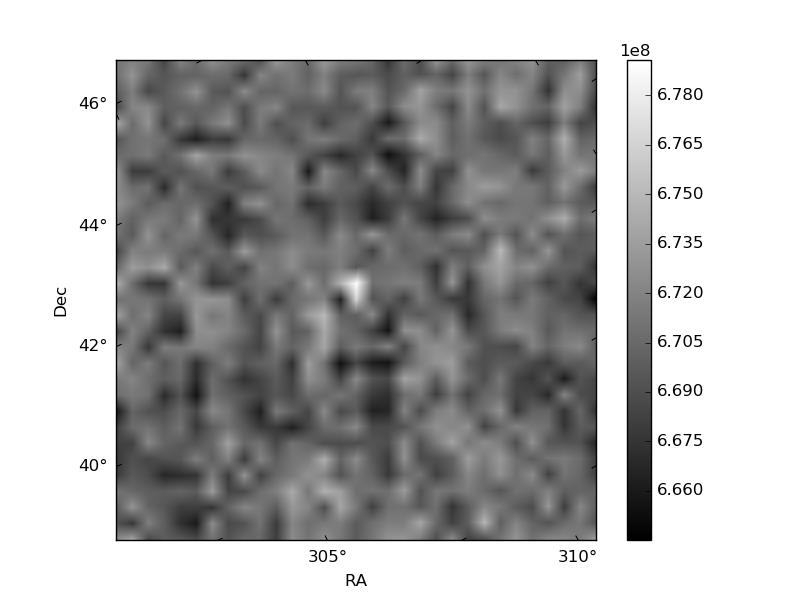
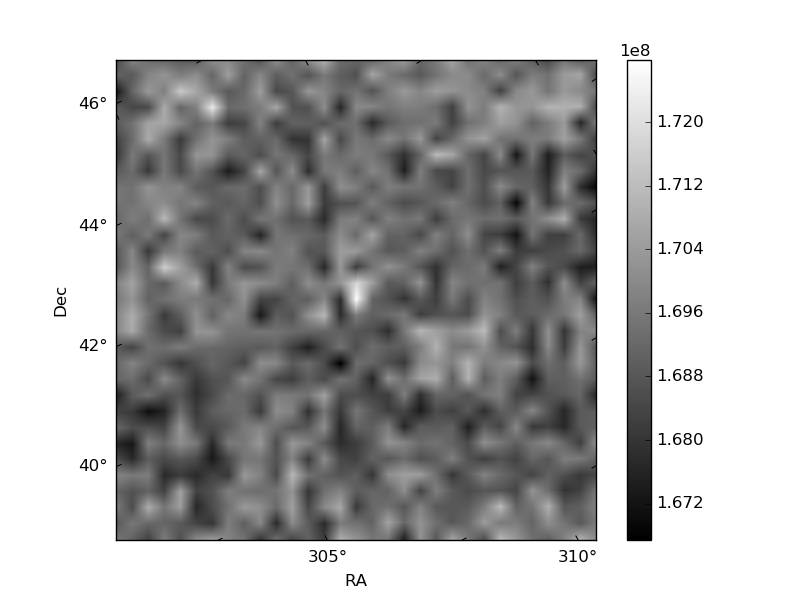
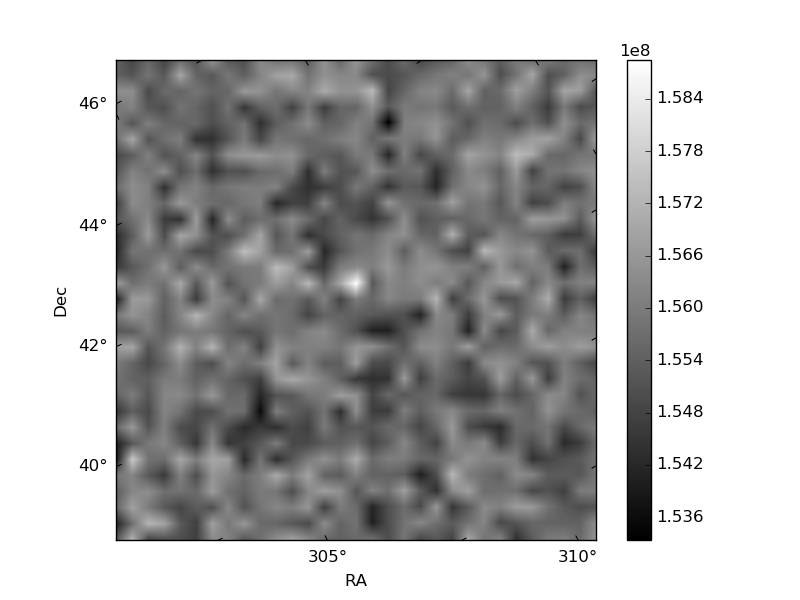
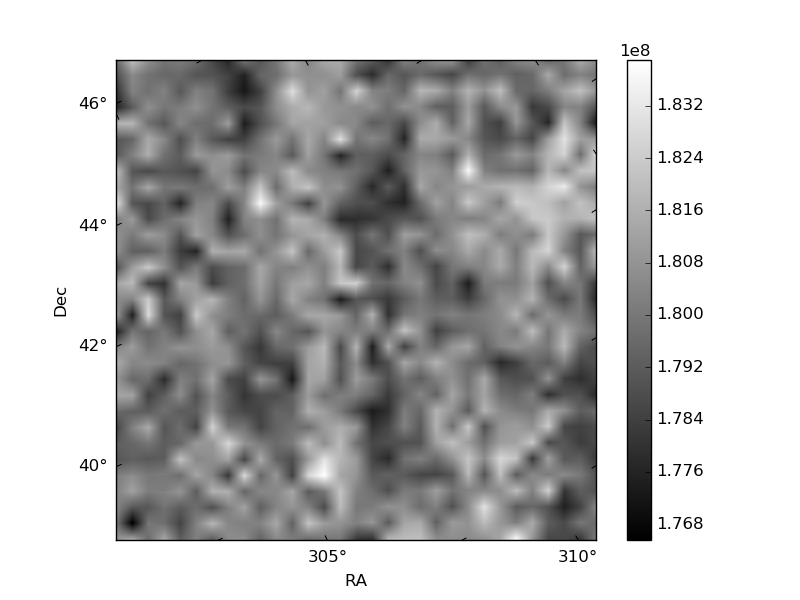
Histogram calculated using DETX and DETY for each event in the final _common_clean file
| Quadrant A | 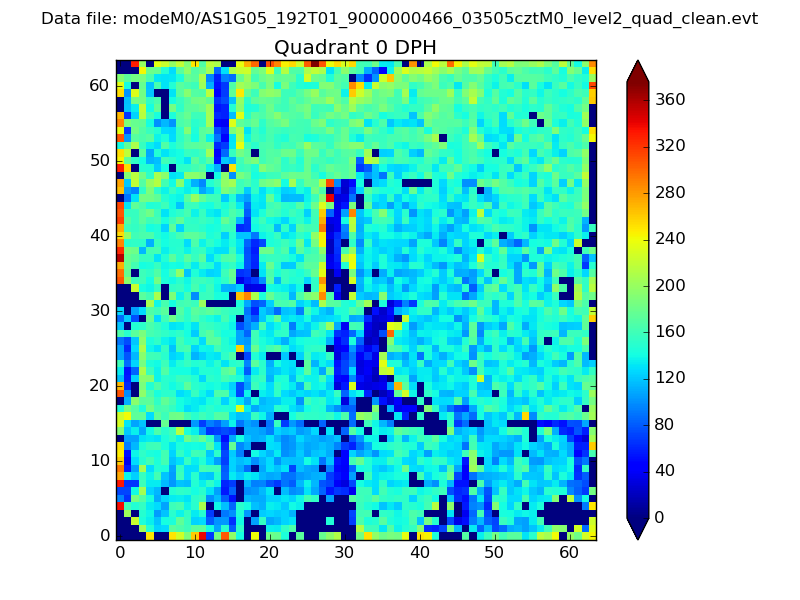 |
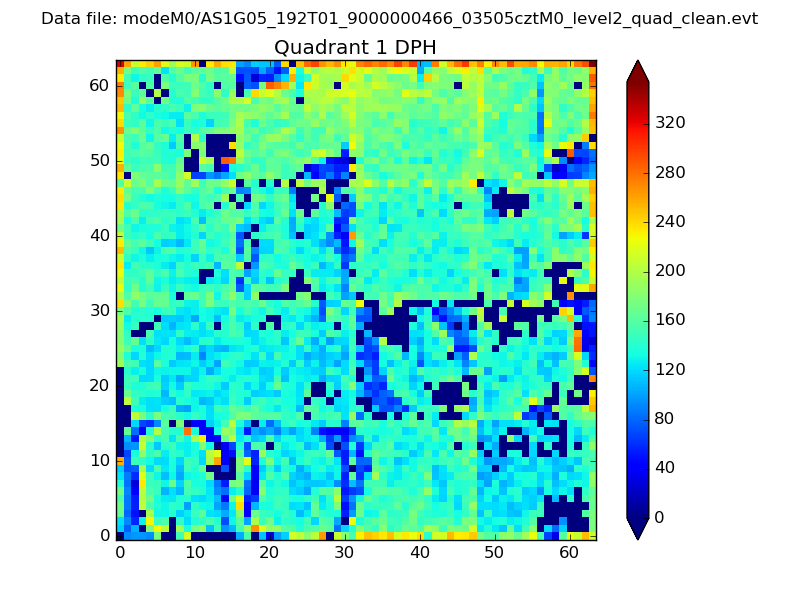 |
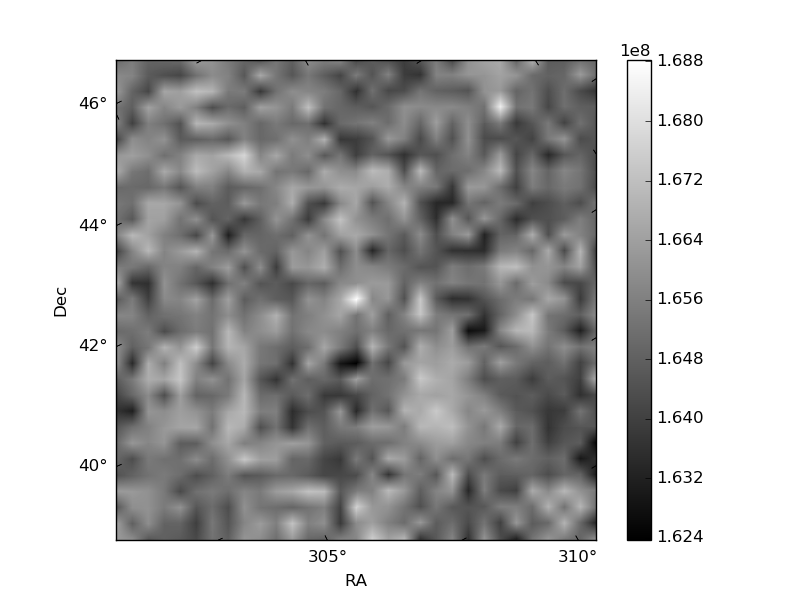
Quadrant B |
|---|---|---|---|
| Quadrant D | 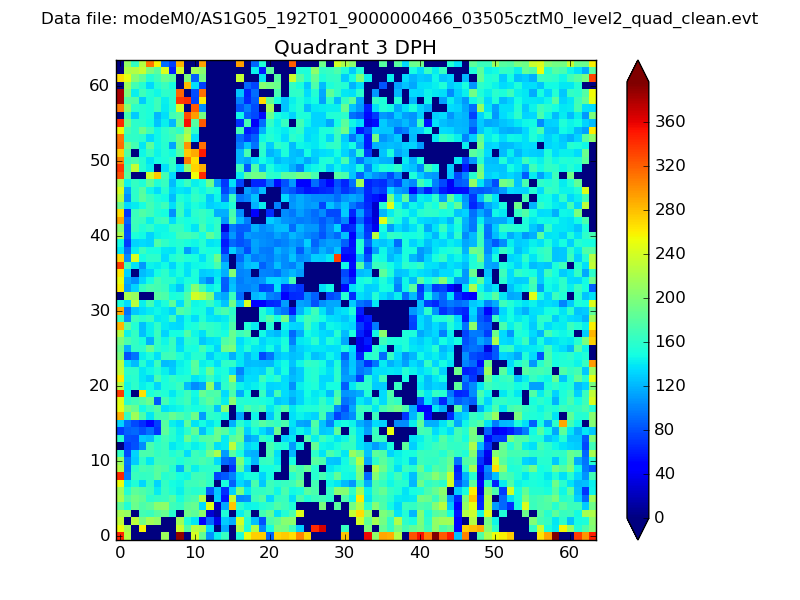 |
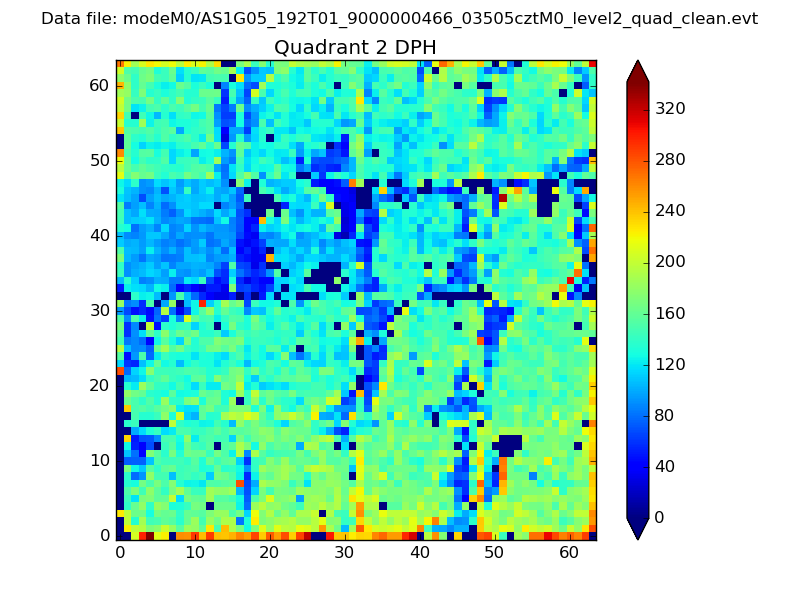 |
Quadrant C |
| Plot type | Count rate plots | Images |
|---|---|---|
| Comparison with Poisson distribution Blue bars denote a histogram of data divided into 1 sec bins. Red curve is a Poisson curve with rate = median count rate of data. |
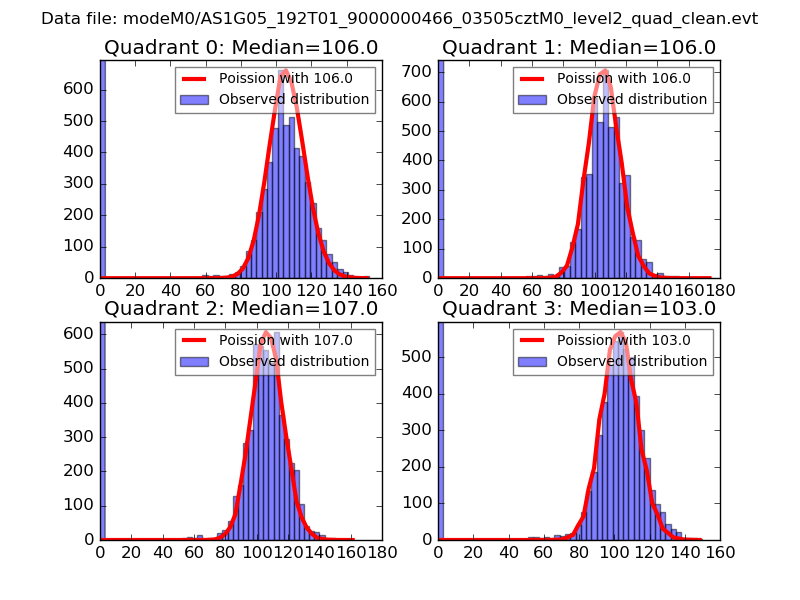 |
 |
| Quadrant-wise count rates Data is divided into 100 sec bins |
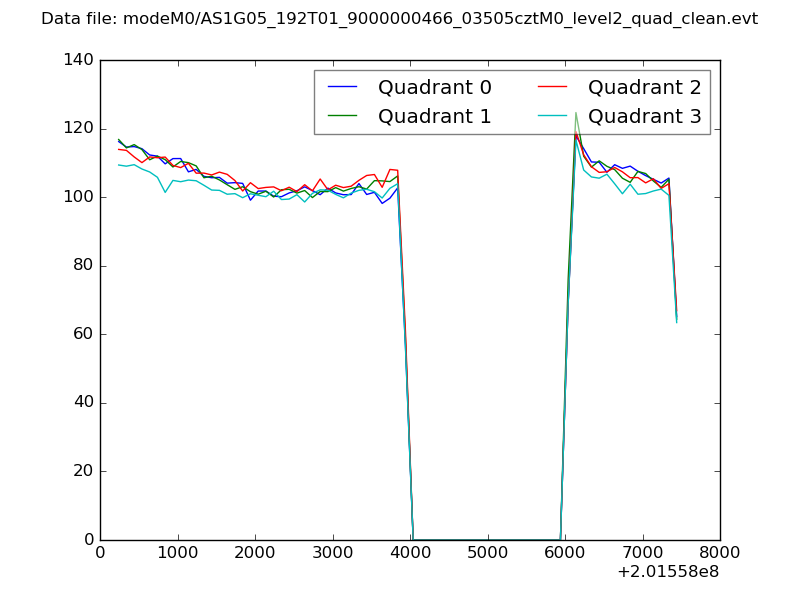 |
|
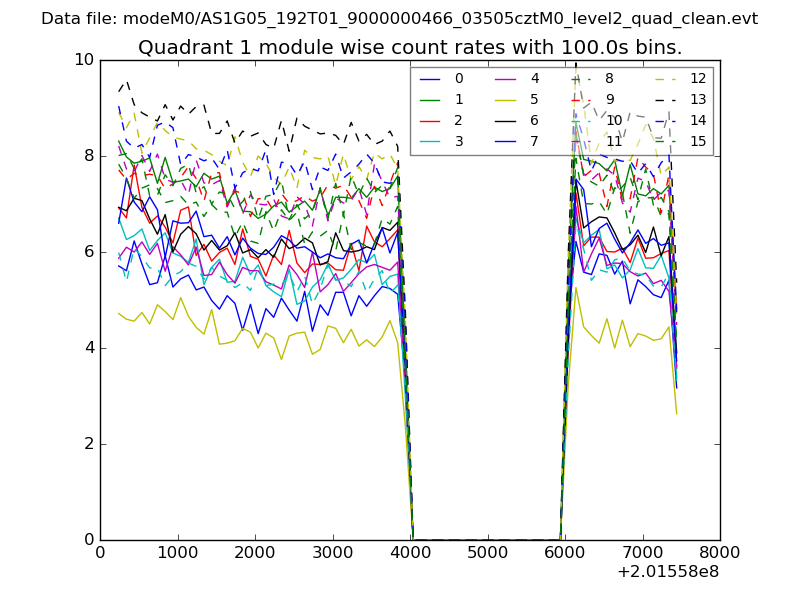
| Module-wise count rates for Quadrant A Data is divided into 100 sec bins |
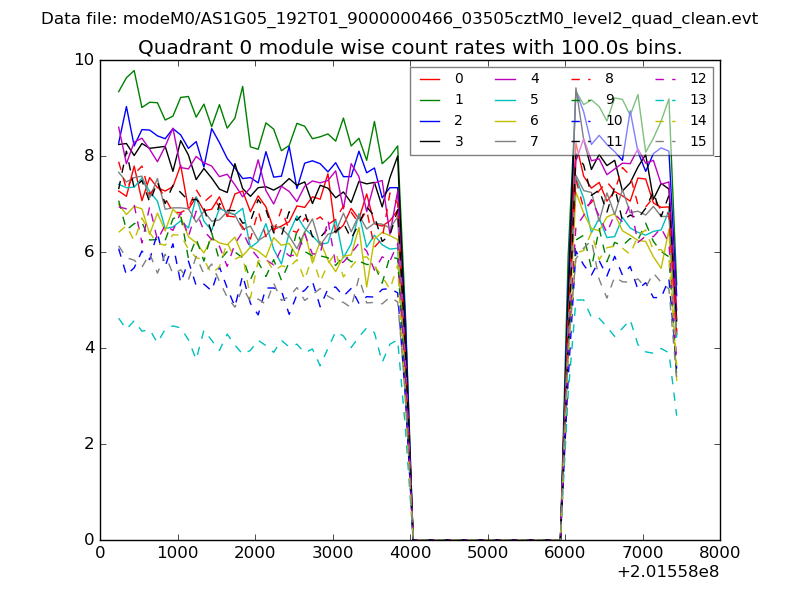 |
 |
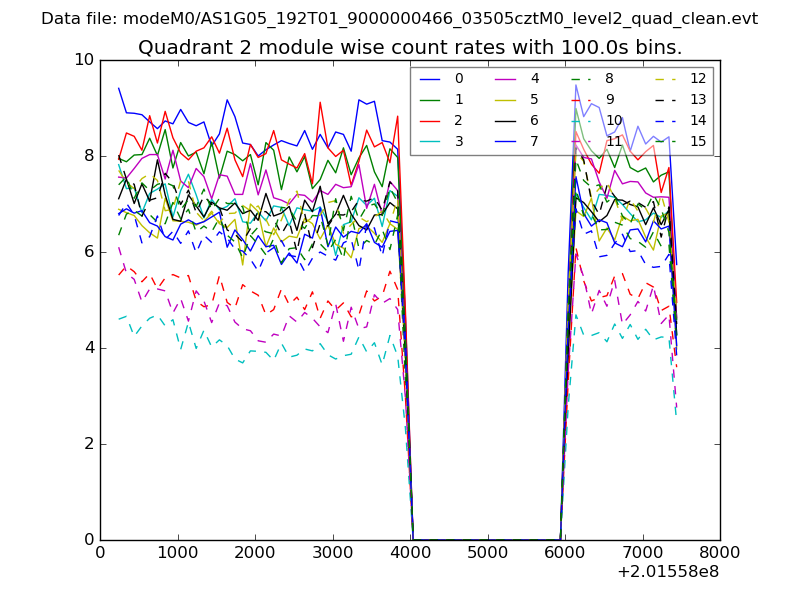
| Module-wise count rates for Quadrant B Data is divided into 100 sec bins |
 |
 |
| Module-wise count rates for Quadrant C Data is divided into 100 sec bins |
 |
 |
| Module-wise count rates for Quadrant D Data is divided into 100 sec bins |
 |
 |
| Parameter | Plot |
|---|---|
| CZT HV Monitor | 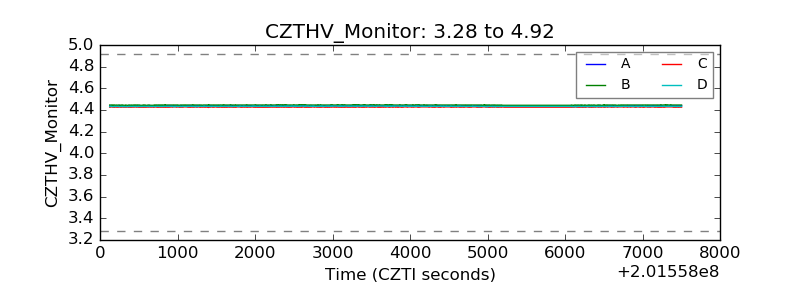 |
| D_VDD | 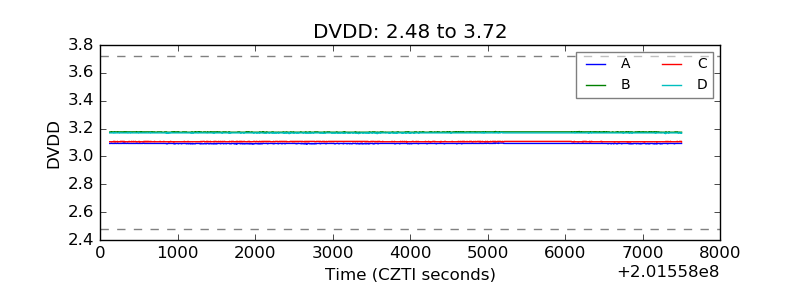 |
| Temperature 1 | 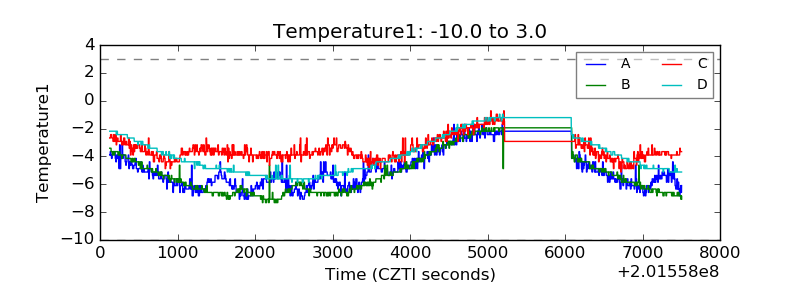 |
| Veto HV Monitor | 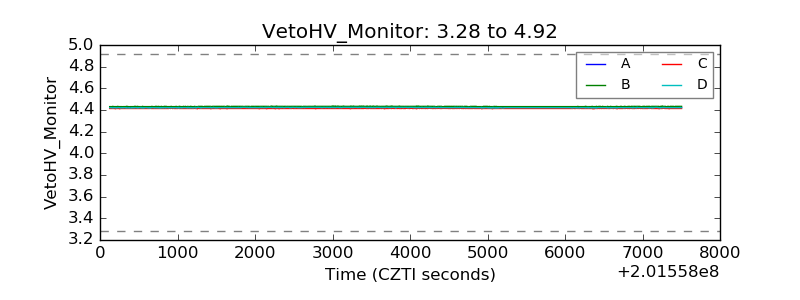 |
| Veto LLD | 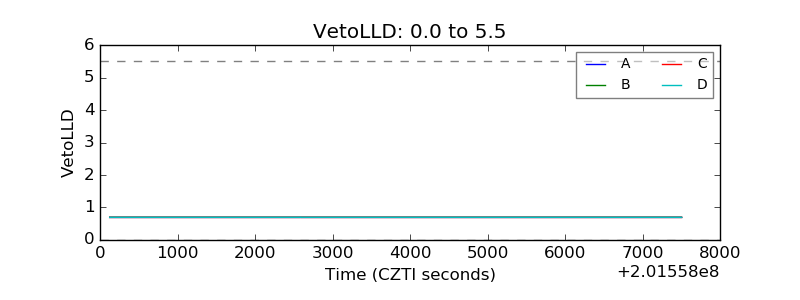 |
| Alpha Counter | 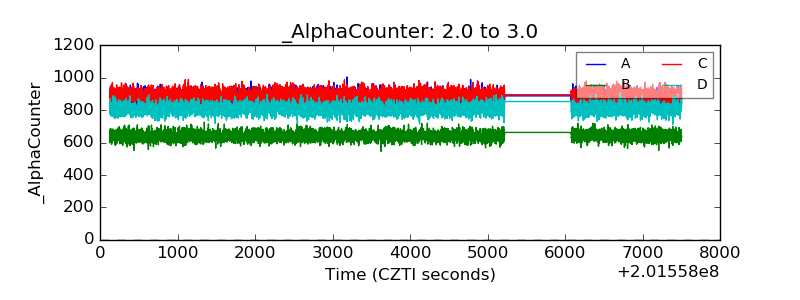 |
| _CPM_Rate | 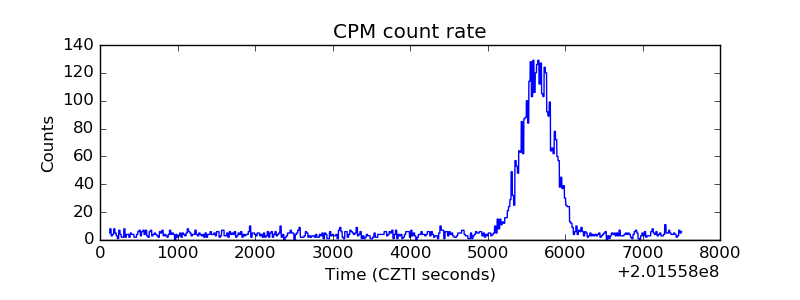 |
| CZT Counter | 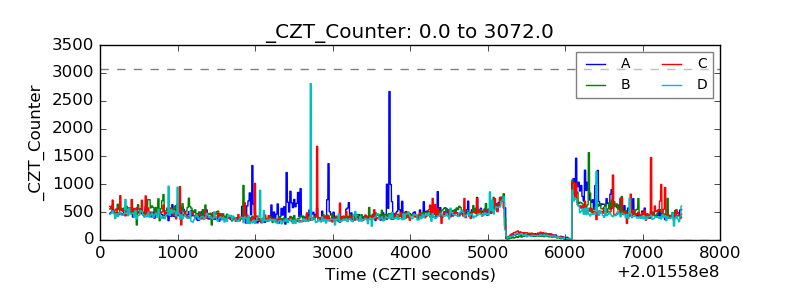 |
| +2.5 Volts monitor |  |
| +5 Volts monitor |  |
| Veto Counter | 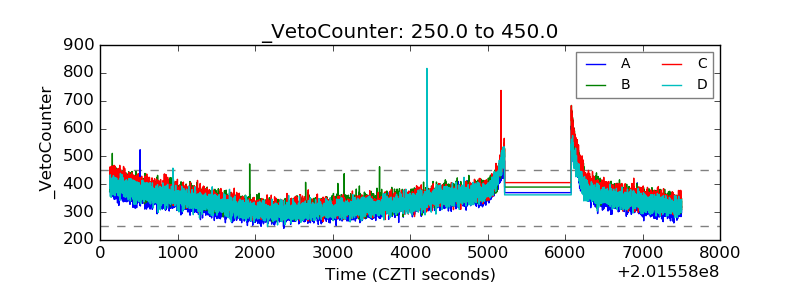 |