| Param | Original file | Final file |
|---|---|---|
| Filename | modeM0/AS1G05_192T01_9000000466_03506cztM0_level2.evt | modeM0/AS1G05_192T01_9000000466_03506cztM0_level2_quad_clean.evt |
| Size (bytes) | 488,203,200 | 88,453,440 |
| Size | 465.6 MB | 84.4 MB |
| Events in quadrant A | 3,860,694 | 546,829 |
| Events in quadrant B | 3,627,044 | 546,464 |
| Events in quadrant C | 3,644,278 | 547,312 |
| Events in quadrant D | 3,158,464 | 530,906 |
| Mode M9 | |||
|---|---|---|---|
| Quadrant | BADHDUFLAG | Total packets | Discarded packets |
| A | 0 | 4 | 0 |
| B | 0 | 4 | 0 |
| C | 0 | 4 | 0 |
| D | 0 | 4 | 0 |
| Mode SS | |||
|---|---|---|---|
| Quadrant | BADHDUFLAG | Total packets | Discarded packets |
| A | 0 | 148 | 0 |
| B | 0 | 148 | 0 |
| C | 0 | 148 | 0 |
| D | 0 | 148 | 0 |
| Mode M0 | |||
|---|---|---|---|
| Quadrant | BADHDUFLAG | Total packets | Discarded packets |
| A | 0 | 16590 | 2 |
| B | 0 | 15873 | 1 |
| C | 0 | 16129 | 1 |
| D | 0 | 15174 | 1 |
| Quadrant | Total seconds | Saturated seconds | Saturation percentage |
|---|---|---|---|
| A | 7283 | 76 | 1.043526% |
| B | 7283 | 38 | 0.521763% |
| C | 7283 | 71 | 0.974873% |
| D | 7283 | 28 | 0.384457% |
Noise dominated data is calculated using 1-second bins in cleaned event files. If a bin has >2000 counts, and if more than 50% of those come from <1% of pixels, then it is considered to be noise-dominated and hence unusable.
| Quadrant | # 1 sec bins | Bins with >0 counts | Bins with >2000 counts | High rate bins dominated by noise | Noise dominated (total time) | Noise dominated (detector-on time) | Marked lightcurve |
|---|---|---|---|---|---|---|---|
| A | 7698 | 7284 | 22 | 22 | 0.29% | 0.30% | 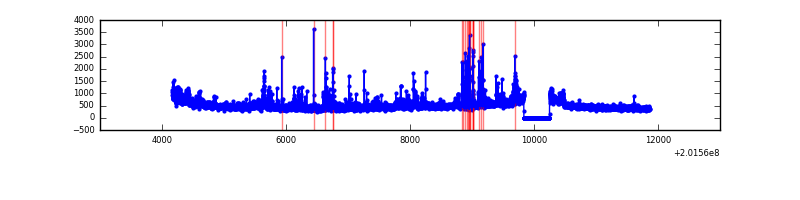 |
| B | 7698 | 7284 | 3 | 3 | 0.04% | 0.04% | 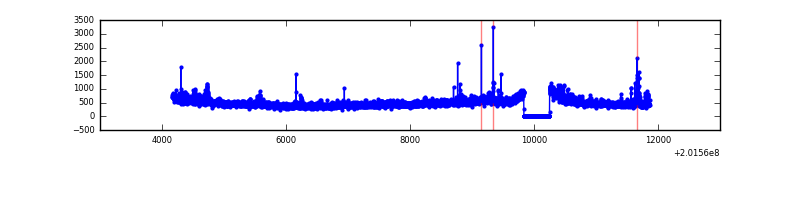 |
| C | 7698 | 7283 | 32 | 32 | 0.42% | 0.44% | 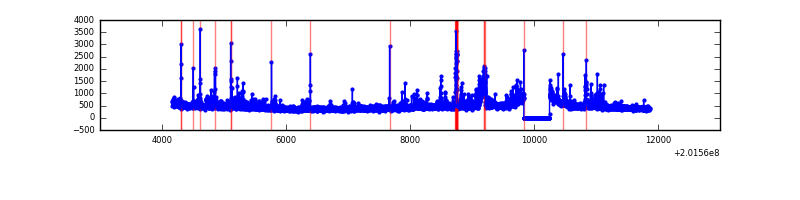 |
| D | 7698 | 7284 | 17 | 17 | 0.22% | 0.23% | 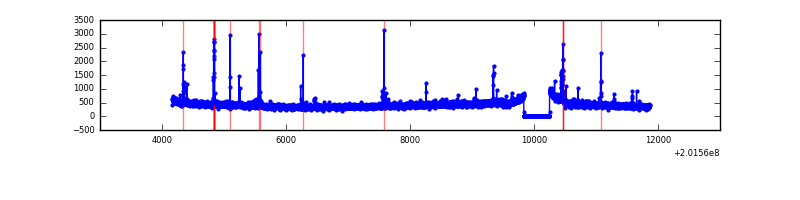 |
Top three noisy pixels from each quadrant. If the there are fewer than three noisy pixels in the level2.evt file, extra rows are filled as -1
| Pixel properties | Quadrant properties | ||||||
|---|---|---|---|---|---|---|---|
| Quadrant | DetID | PixID | Counts | Sigma | Mean | Median | Sigma |
| A | 8 | 15 | 395192 | 2312.42 | 825 | 809 | 170.5 |
| A | 14 | 238 | 181765 | 1061.02 | 825 | 809 | 170.5 |
| A | 0 | 118 | 45784 | 263.71 | 825 | 809 | 170.5 |
| B | 15 | 204 | 249325 | 1502.29 | 843 | 822 | 165.4 |
| B | 4 | 200 | 48972 | 291.08 | 843 | 822 | 165.4 |
| B | 0 | 229 | 19777 | 114.59 | 843 | 822 | 165.4 |
| C | 1 | 192 | 418052 | 2209.65 | 808 | 813 | 188.8 |
| C | 15 | 208 | 40758 | 211.54 | 808 | 813 | 188.8 |
| C | 1 | 16 | 14268 | 71.26 | 808 | 813 | 188.8 |
| D | 13 | 223 | 65549 | 331.3 | 803 | 779 | 195.5 |
| D | 13 | 239 | 23256 | 114.97 | 803 | 779 | 195.5 |
| D | 5 | 233 | 22985 | 113.58 | 803 | 779 | 195.5 |
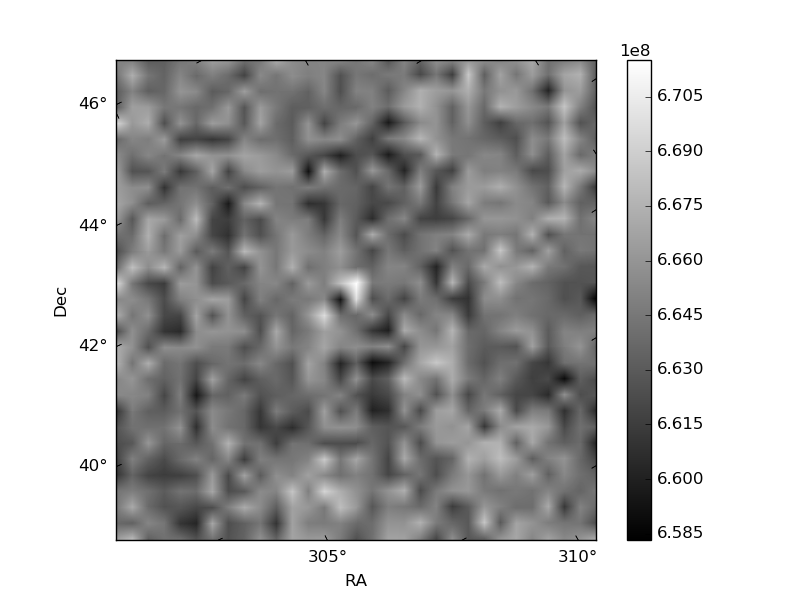
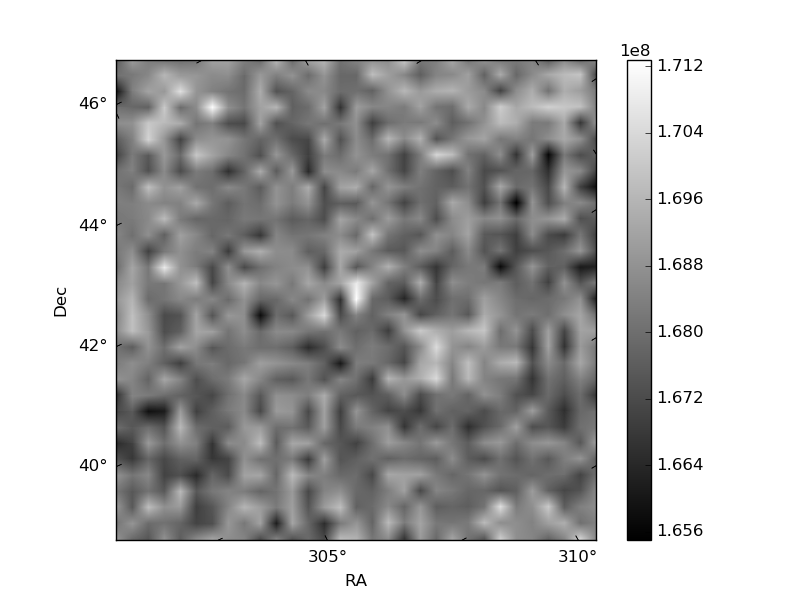
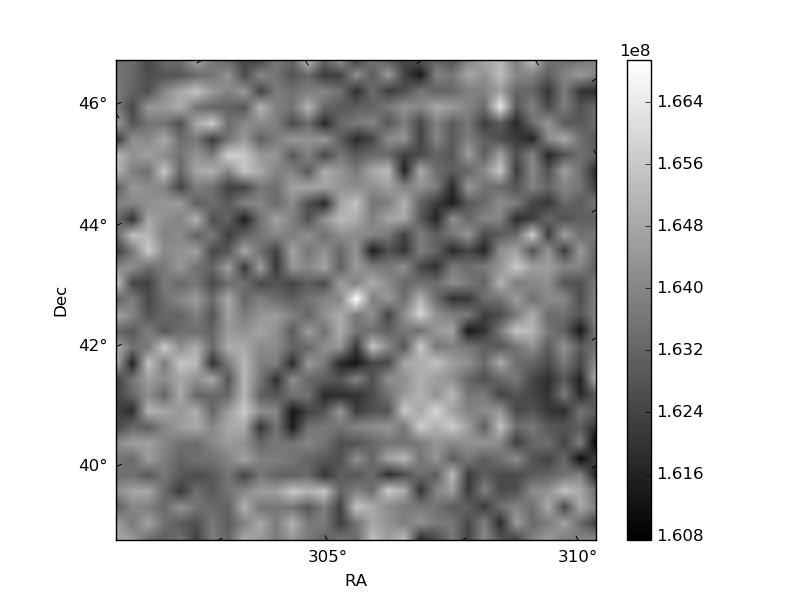
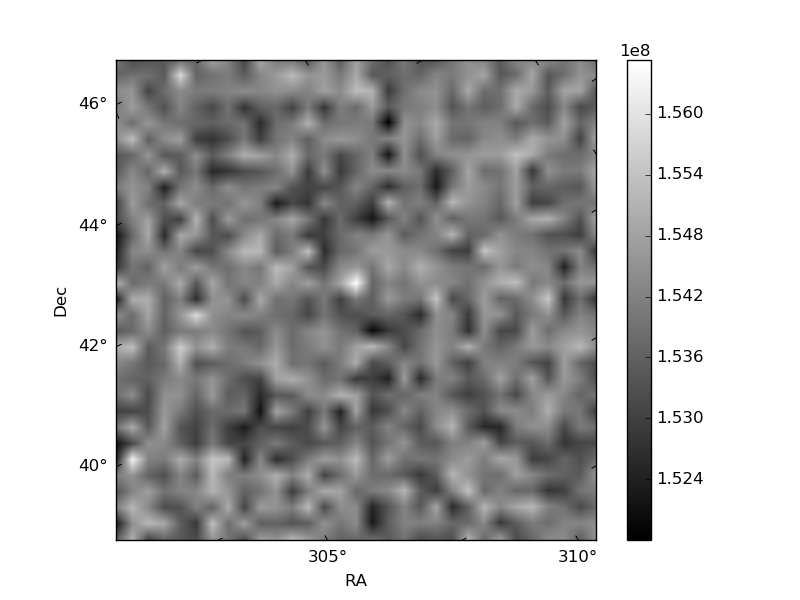
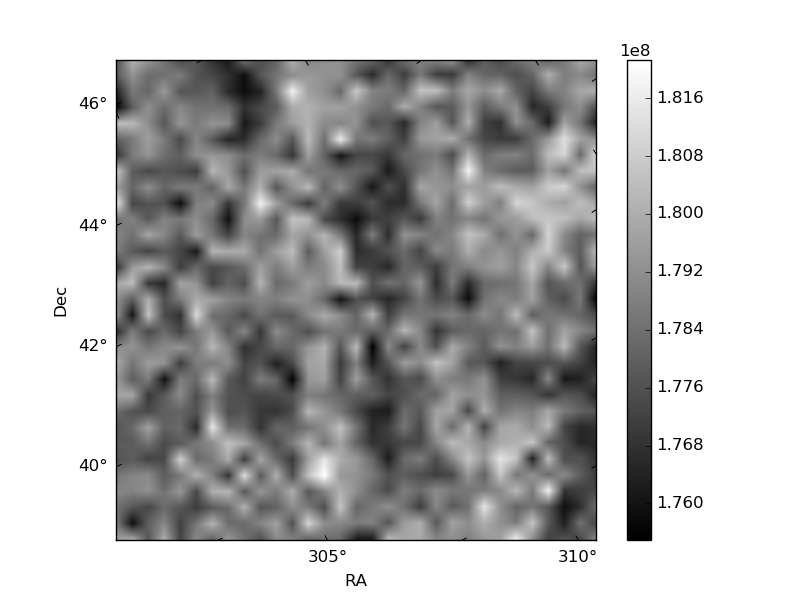
Histogram calculated using DETX and DETY for each event in the final _common_clean file
| Quadrant A | 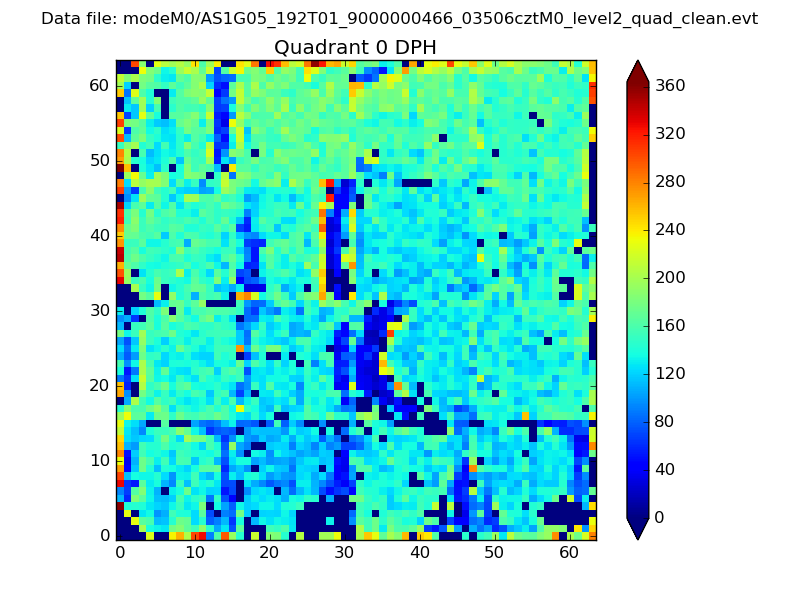 |
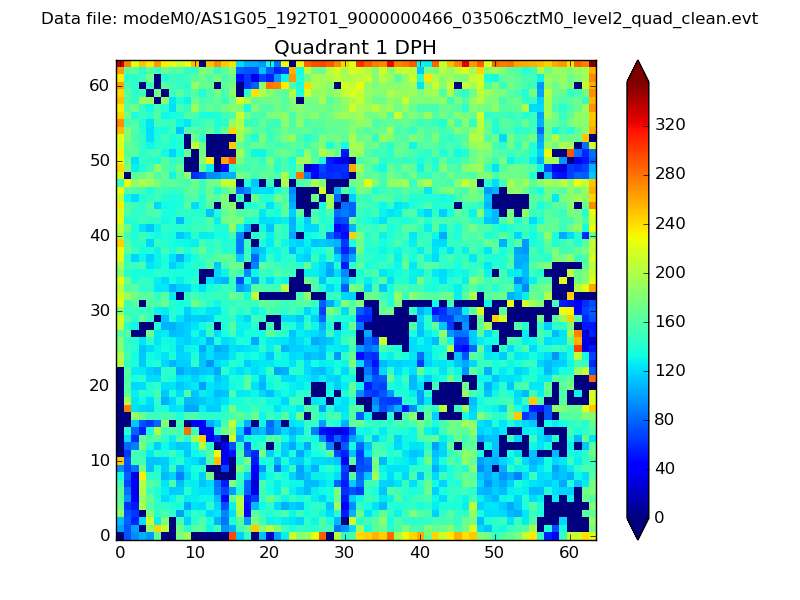 |
Quadrant B |
|---|---|---|---|
| Quadrant D | 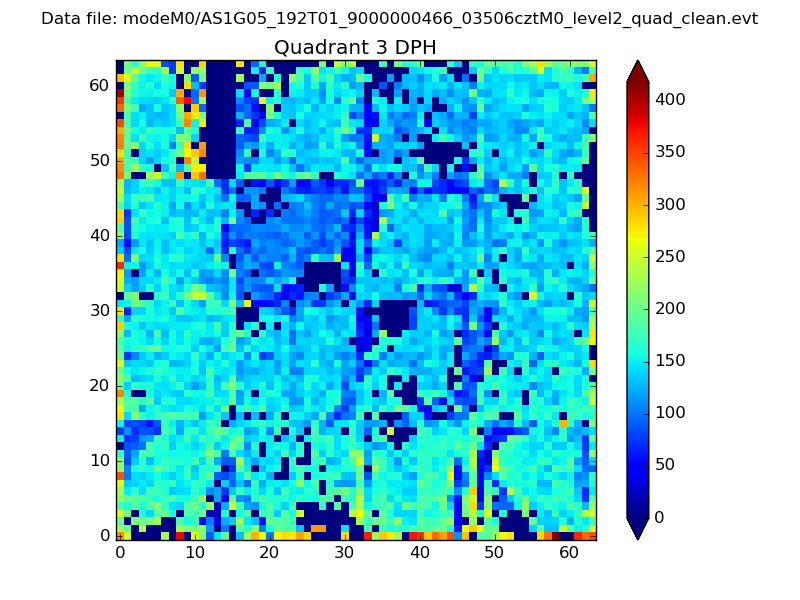 |
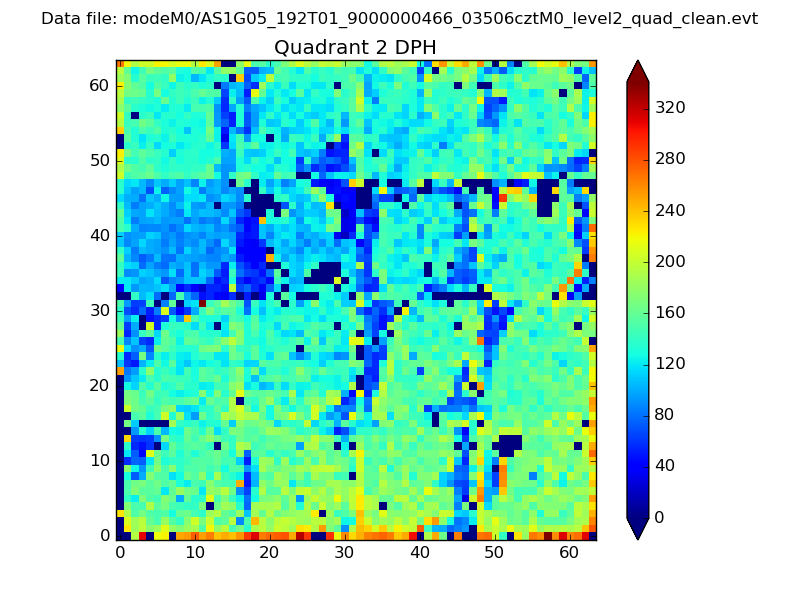 |
Quadrant C |
| Plot type | Count rate plots | Images |
|---|---|---|
| Comparison with Poisson distribution Blue bars denote a histogram of data divided into 1 sec bins. Red curve is a Poisson curve with rate = median count rate of data. |
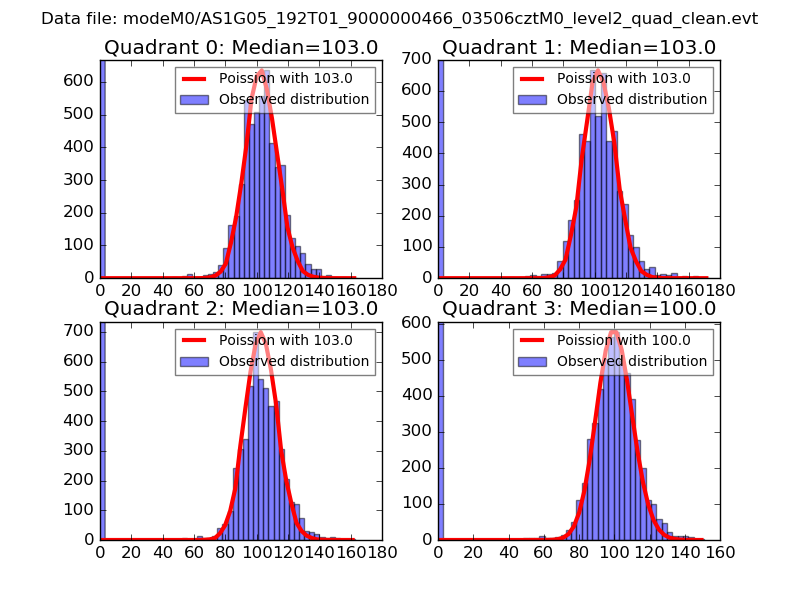 |
 |
| Quadrant-wise count rates Data is divided into 100 sec bins |
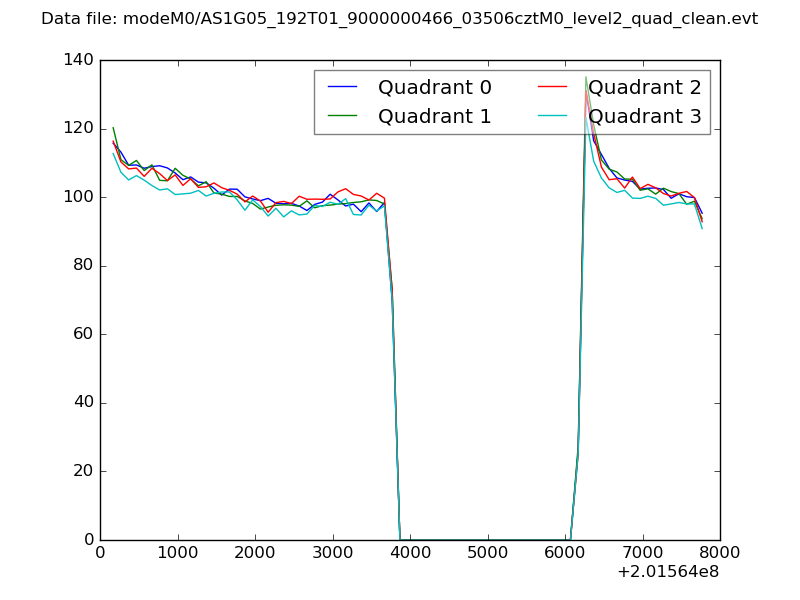 |
|
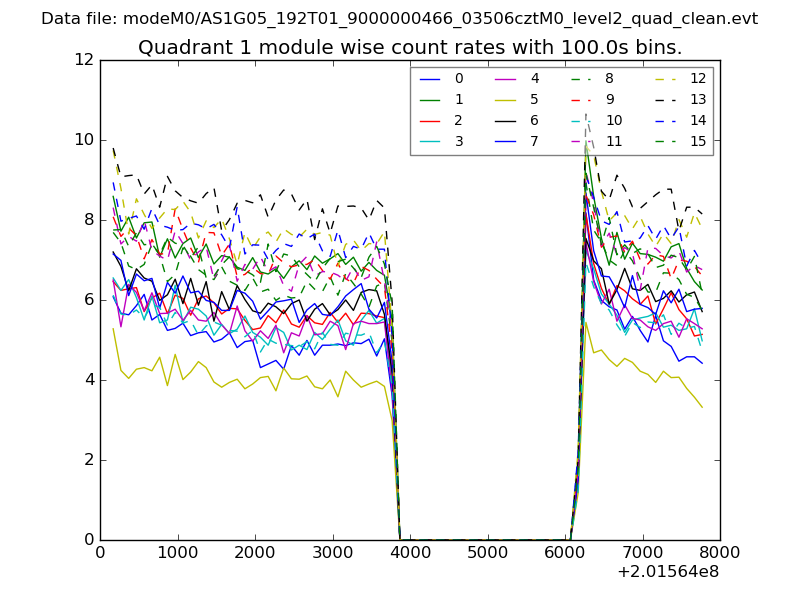
| Module-wise count rates for Quadrant A Data is divided into 100 sec bins |
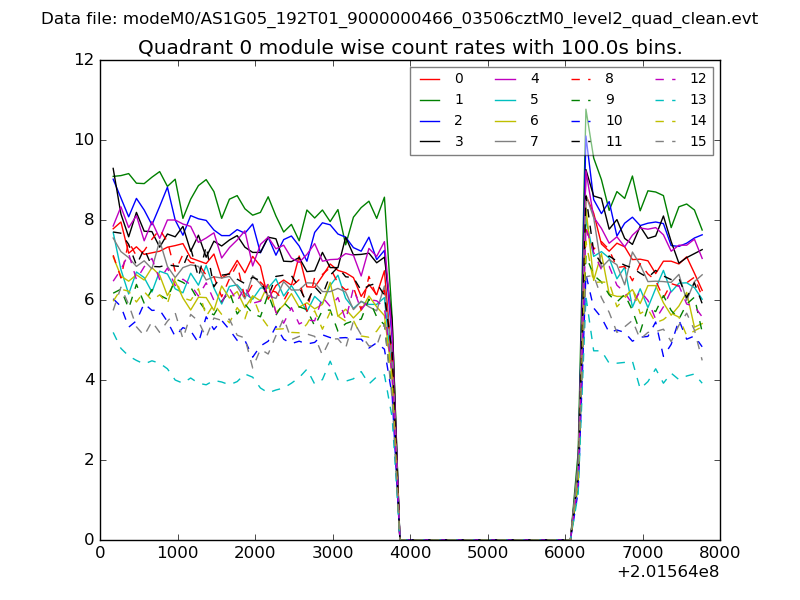 |
 |
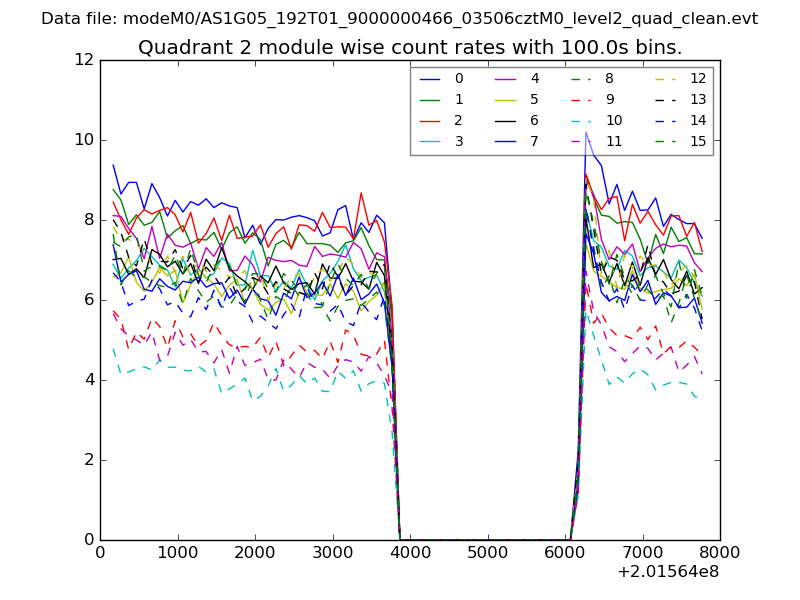
| Module-wise count rates for Quadrant B Data is divided into 100 sec bins |
 |
 |
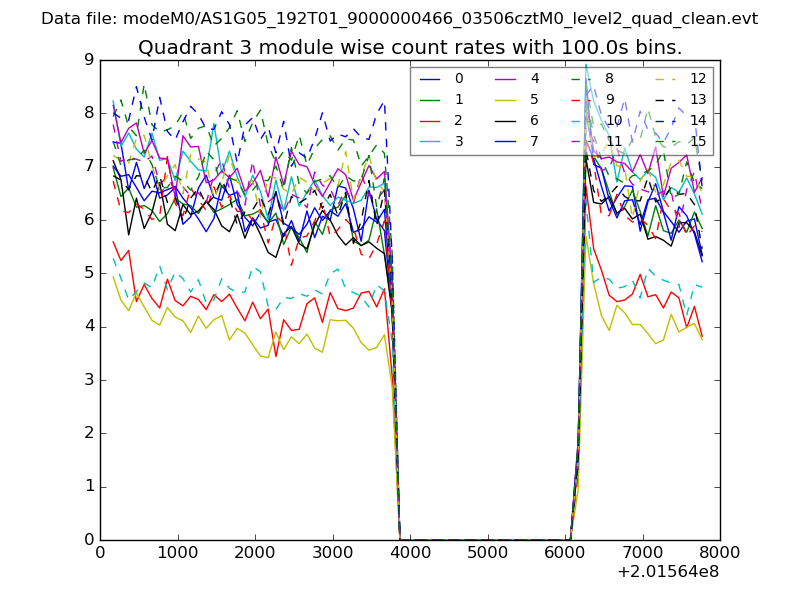
| Module-wise count rates for Quadrant C Data is divided into 100 sec bins |
 |
 |
| Module-wise count rates for Quadrant D Data is divided into 100 sec bins |
 |
 |
| Parameter | Plot |
|---|---|
| CZT HV Monitor | 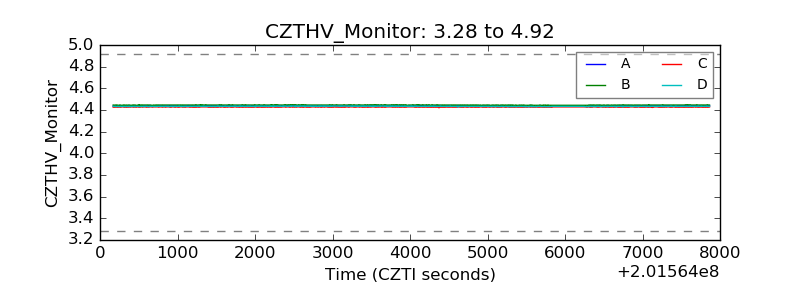 |
| D_VDD | 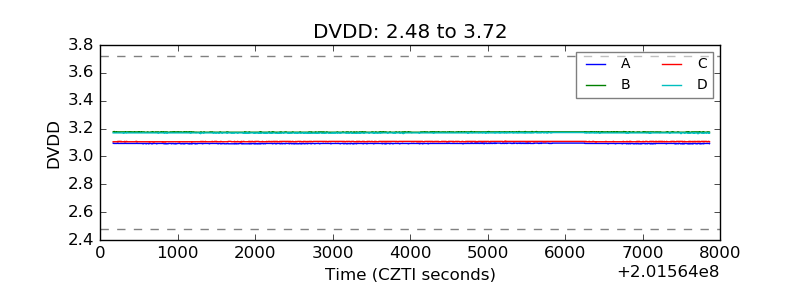 |
| Temperature 1 | 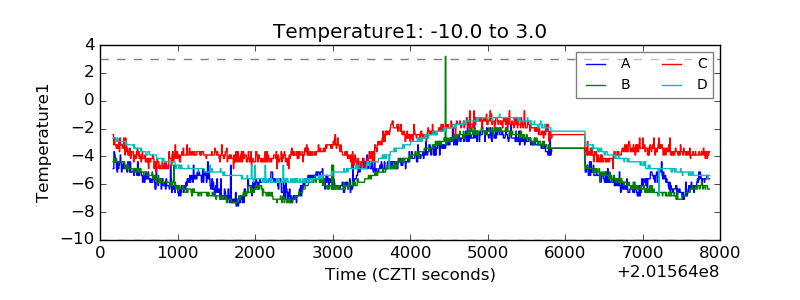 |
| Veto HV Monitor | 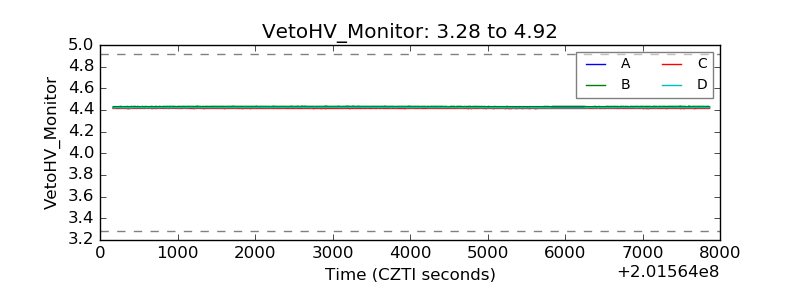 |
| Veto LLD | 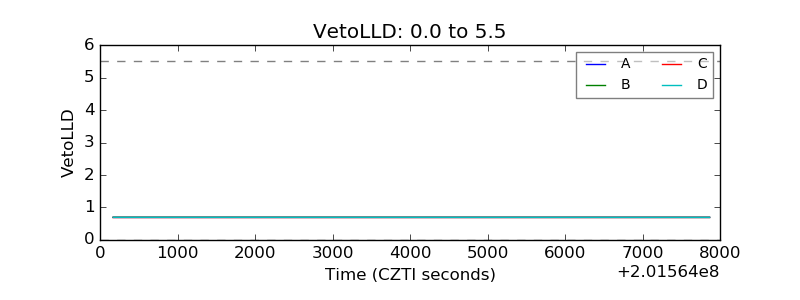 |
| Alpha Counter |  |
| _CPM_Rate | 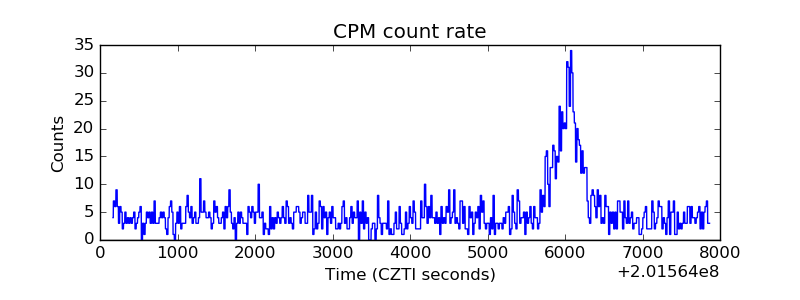 |
| CZT Counter | 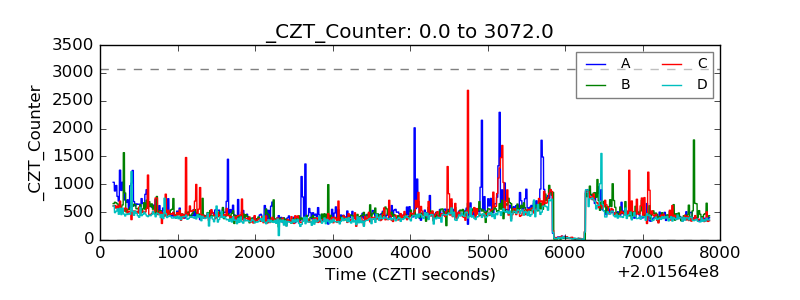 |
| +2.5 Volts monitor |  |
| +5 Volts monitor |  |
| Veto Counter | 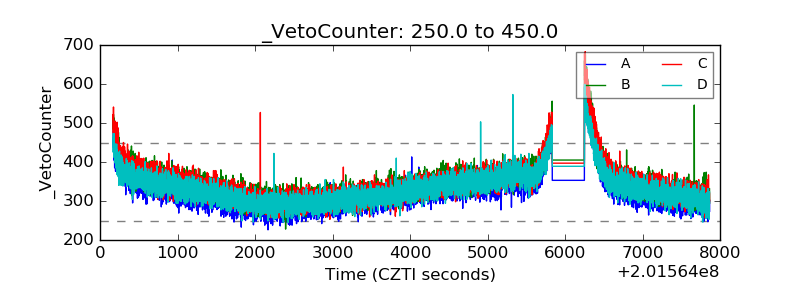 |