| Param | Original file | Final file |
|---|---|---|
| Filename | modeM0/AS1G05_192T01_9000000466_03508cztM0_level2.evt | modeM0/AS1G05_192T01_9000000466_03508cztM0_level2_quad_clean.evt |
| Size (bytes) | 485,625,600 | 91,537,920 |
| Size | 463.1 MB | 87.3 MB |
| Events in quadrant A | 3,474,706 | 566,089 |
| Events in quadrant B | 3,853,292 | 569,270 |
| Events in quadrant C | 3,511,510 | 565,930 |
| Events in quadrant D | 3,356,251 | 547,322 |
| Mode SS | |||
|---|---|---|---|
| Quadrant | BADHDUFLAG | Total packets | Discarded packets |
| A | 0 | 150 | 0 |
| B | 0 | 150 | 0 |
| C | 0 | 150 | 0 |
| D | 0 | 150 | 0 |
| Mode M0 | |||
|---|---|---|---|
| Quadrant | BADHDUFLAG | Total packets | Discarded packets |
| A | 0 | 15847 | 1 |
| B | 0 | 16608 | 1 |
| C | 0 | 16000 | 1 |
| D | 0 | 15951 | 1 |
| Quadrant | Total seconds | Saturated seconds | Saturation percentage |
|---|---|---|---|
| A | 7524 | 47 | 0.624668% |
| B | 7524 | 108 | 1.435407% |
| C | 7524 | 37 | 0.491760% |
| D | 7525 | 38 | 0.504983% |
Noise dominated data is calculated using 1-second bins in cleaned event files. If a bin has >2000 counts, and if more than 50% of those come from <1% of pixels, then it is considered to be noise-dominated and hence unusable.
| Quadrant | # 1 sec bins | Bins with >0 counts | Bins with >2000 counts | High rate bins dominated by noise | Noise dominated (total time) | Noise dominated (detector-on time) | Marked lightcurve |
|---|---|---|---|---|---|---|---|
| A | 7524 | 7524 | 3 | 3 | 0.04% | 0.04% | 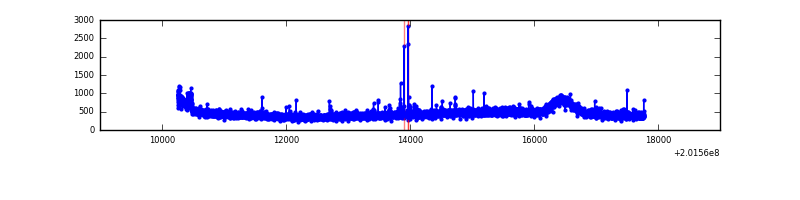 |
| B | 7524 | 7524 | 5 | 5 | 0.07% | 0.07% | 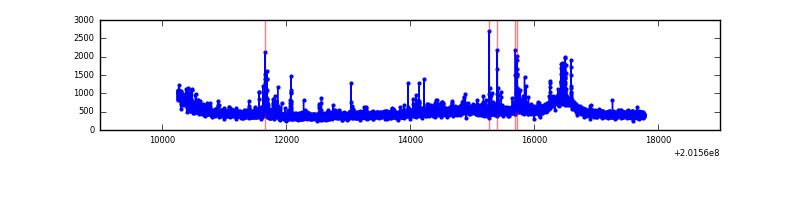 |
| C | 7524 | 7524 | 3 | 3 | 0.04% | 0.04% | 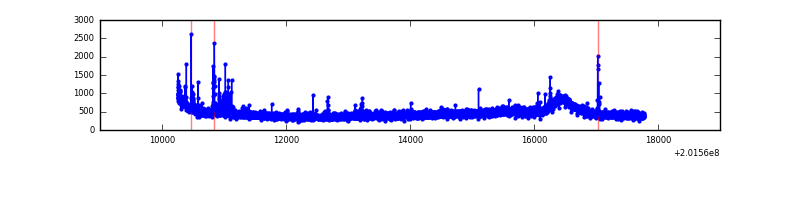 |
| D | 7525 | 7525 | 19 | 19 | 0.25% | 0.25% | 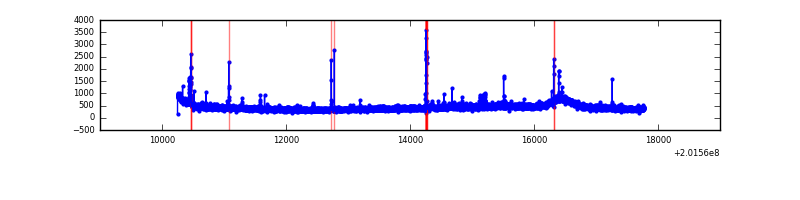 |
Top three noisy pixels from each quadrant. If the there are fewer than three noisy pixels in the level2.evt file, extra rows are filled as -1
| Pixel properties | Quadrant properties | ||||||
|---|---|---|---|---|---|---|---|
| Quadrant | DetID | PixID | Counts | Sigma | Mean | Median | Sigma |
| A | 7 | 16 | 25187 | 132.66 | 879 | 859 | 183.4 |
| A | 0 | 118 | 23907 | 125.68 | 879 | 859 | 183.4 |
| A | 8 | 15 | 16115 | 83.19 | 879 | 859 | 183.4 |
| B | 15 | 204 | 206495 | 1163.3 | 896 | 873 | 176.8 |
| B | 4 | 200 | 75893 | 424.42 | 896 | 873 | 176.8 |
| B | 4 | 81 | 40472 | 224.03 | 896 | 873 | 176.8 |
| C | 1 | 192 | 77846 | 375.86 | 864 | 867 | 204.8 |
| C | 1 | 16 | 27661 | 130.82 | 864 | 867 | 204.8 |
| C | 7 | 220 | 12545 | 57.02 | 864 | 867 | 204.8 |
| D | 13 | 223 | 52817 | 248.64 | 853 | 829 | 209.1 |
| D | 9 | 102 | 30696 | 142.84 | 853 | 829 | 209.1 |
| D | 5 | 233 | 19999 | 91.68 | 853 | 829 | 209.1 |
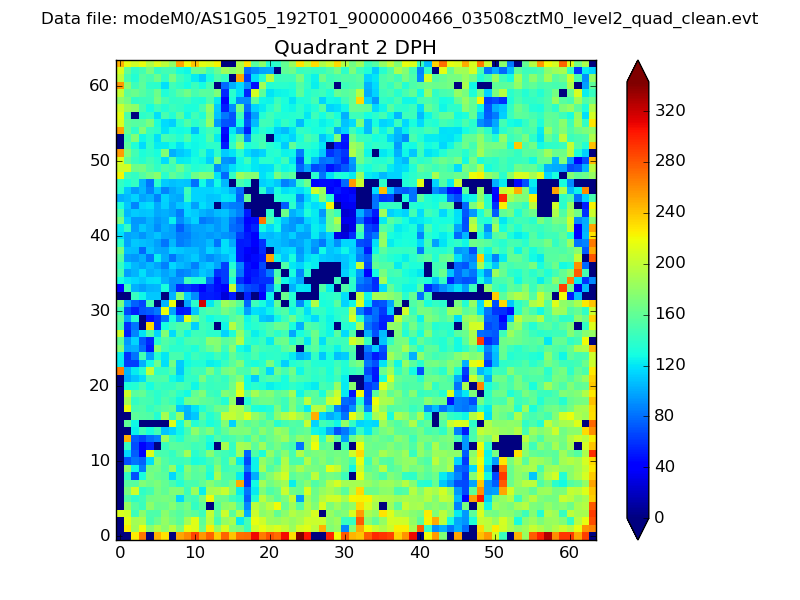
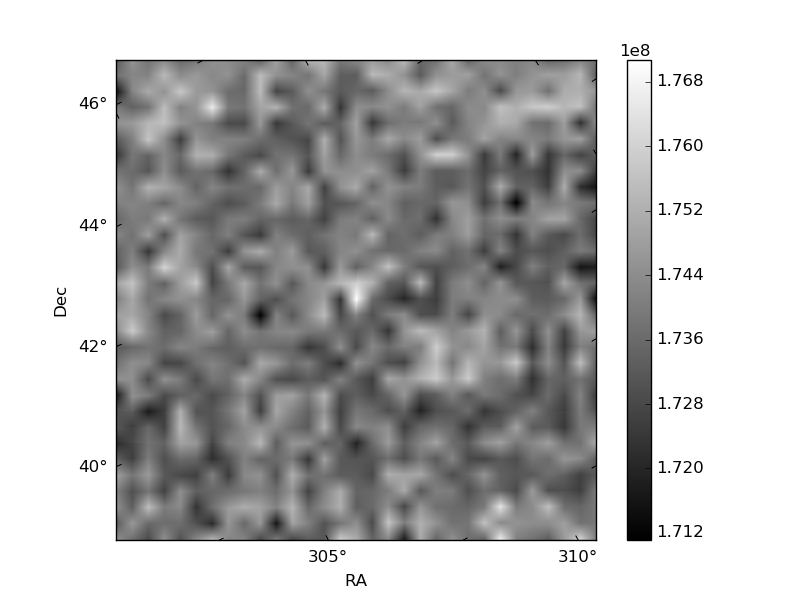
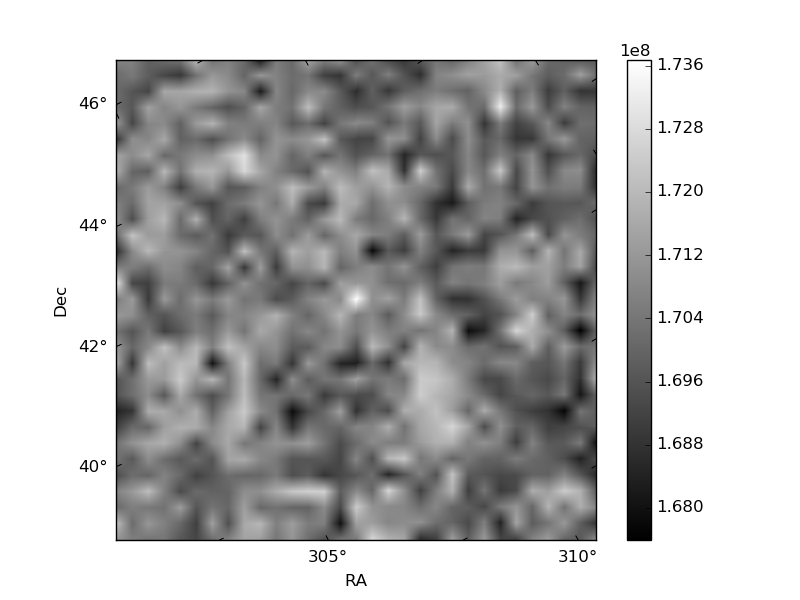
Histogram calculated using DETX and DETY for each event in the final _common_clean file
| Quadrant A | 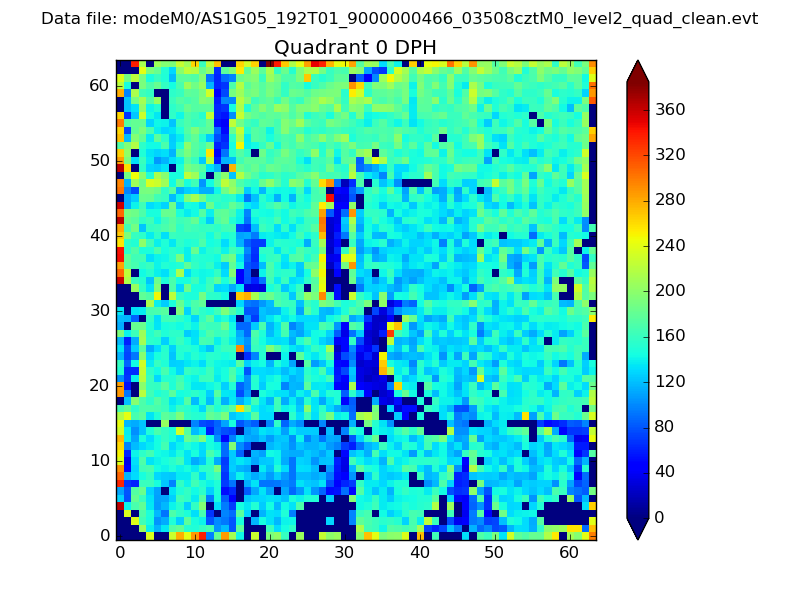 |
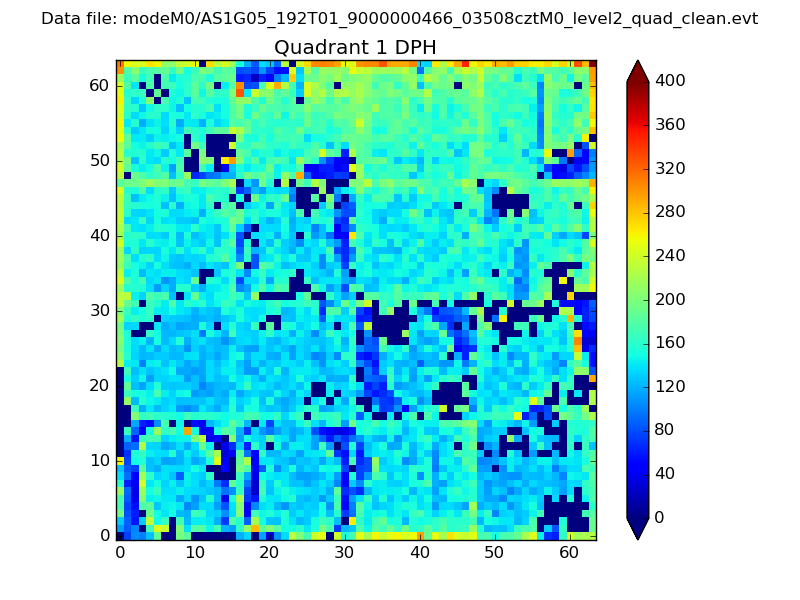 |
Quadrant B |
|---|---|---|---|
| Quadrant D | 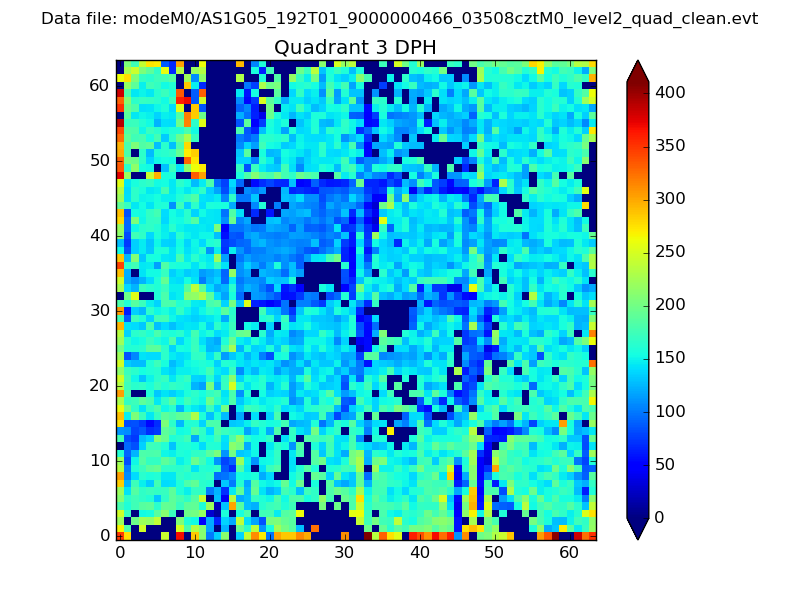 |
 |
Quadrant C |
| Plot type | Count rate plots | Images |
|---|---|---|
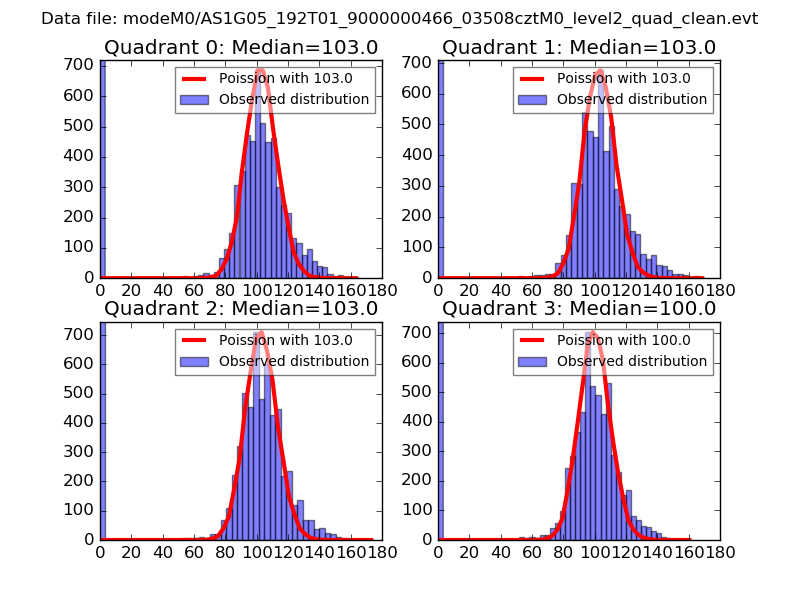
| Comparison with Poisson distribution Blue bars denote a histogram of data divided into 1 sec bins. Red curve is a Poisson curve with rate = median count rate of data. |
 |
 |
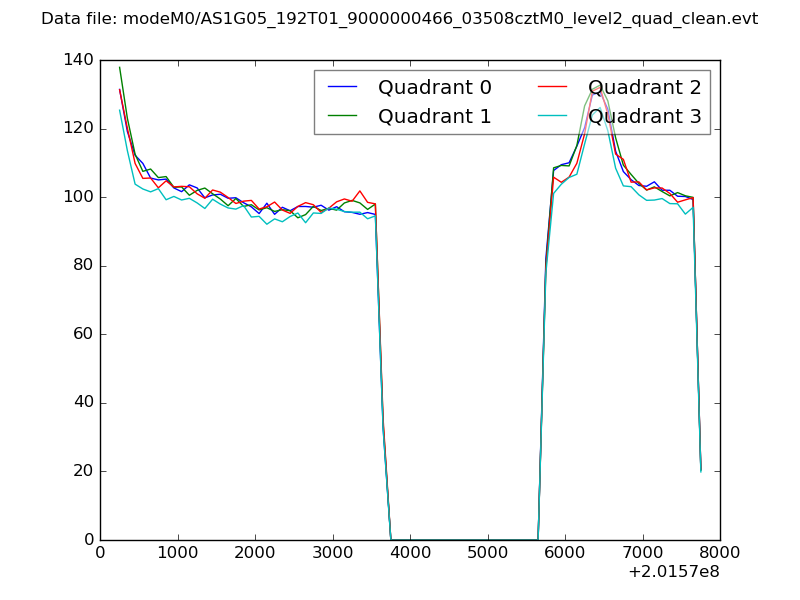
| Quadrant-wise count rates Data is divided into 100 sec bins |
 |
|
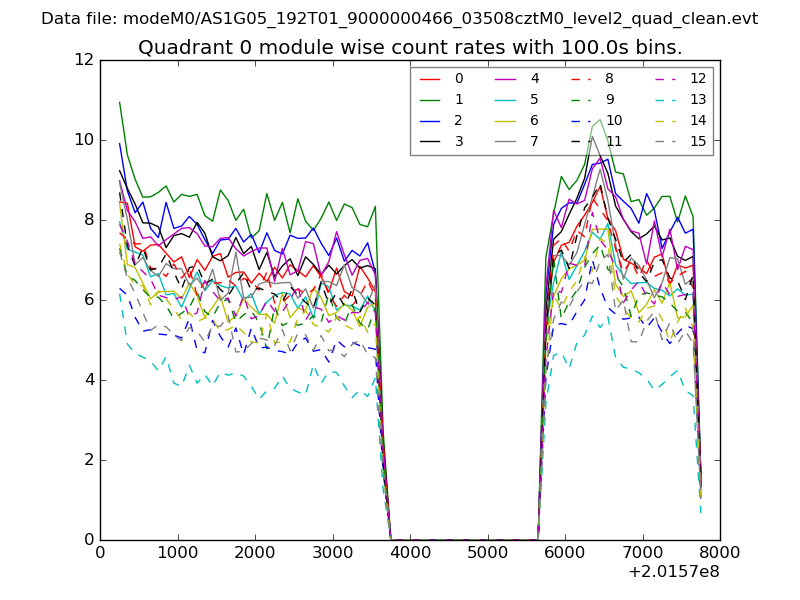
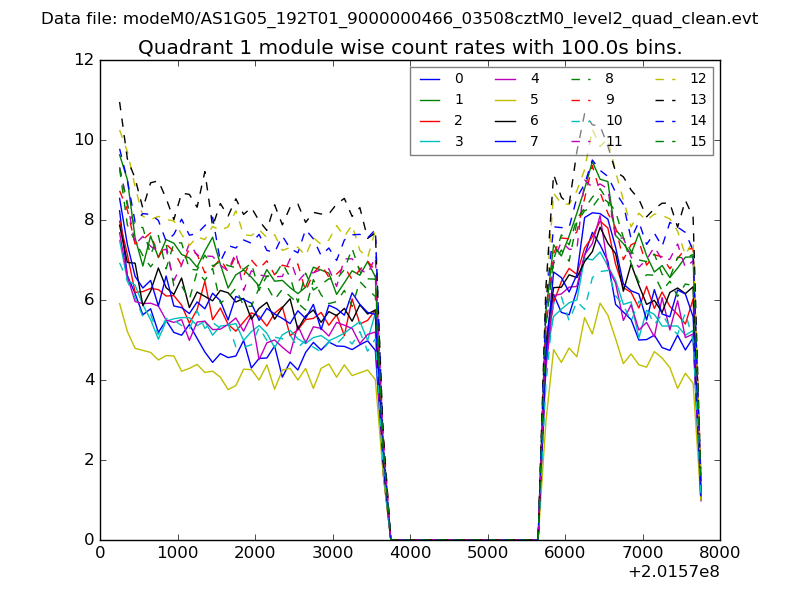
| Module-wise count rates for Quadrant A Data is divided into 100 sec bins |
 |
 |
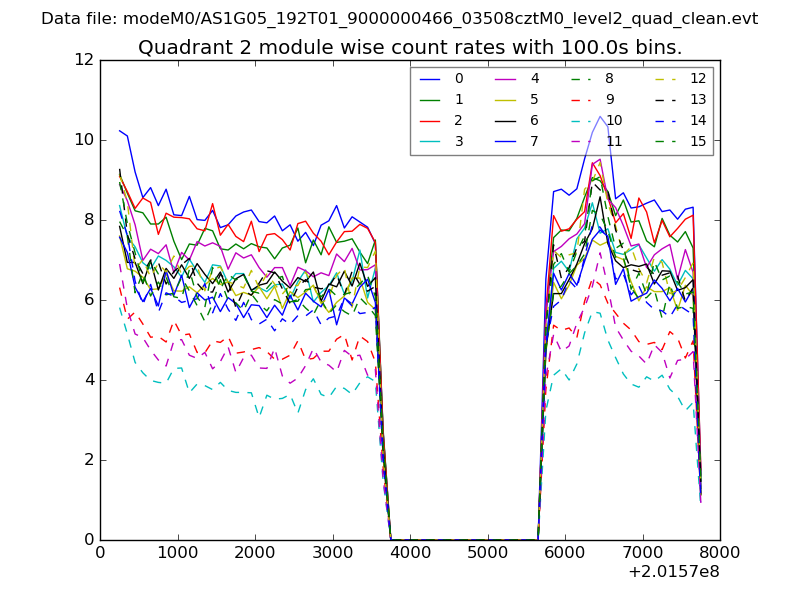
| Module-wise count rates for Quadrant B Data is divided into 100 sec bins |
 |
 |
| Module-wise count rates for Quadrant C Data is divided into 100 sec bins |
 |
 |
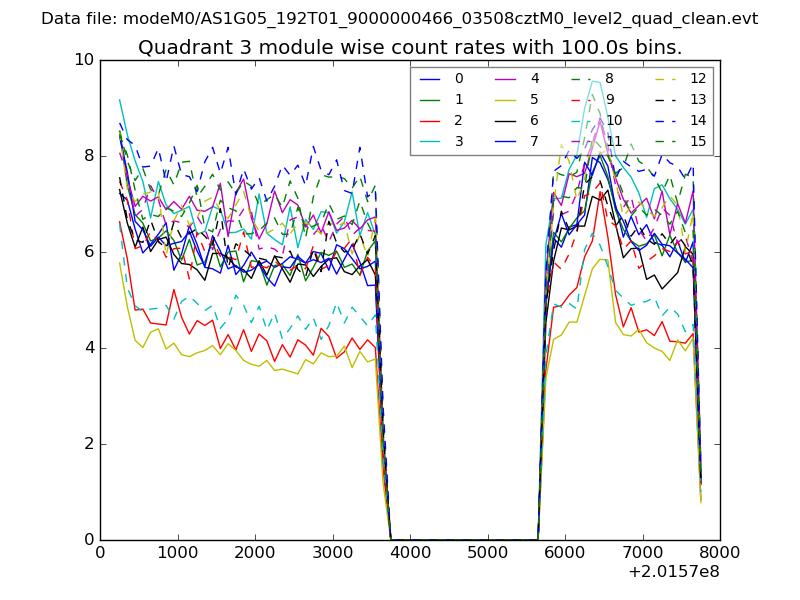
| Module-wise count rates for Quadrant D Data is divided into 100 sec bins |
 |
 |
| Parameter | Plot |
|---|---|
| CZT HV Monitor | 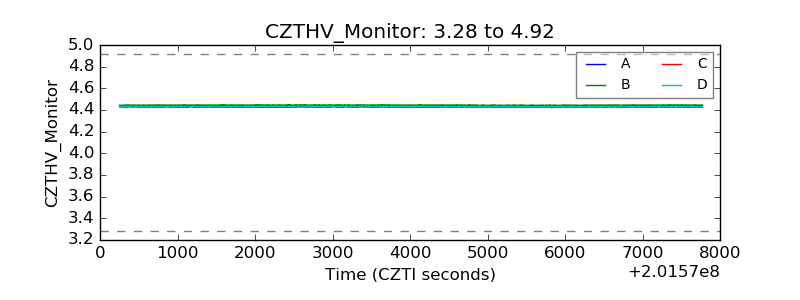 |
| D_VDD | 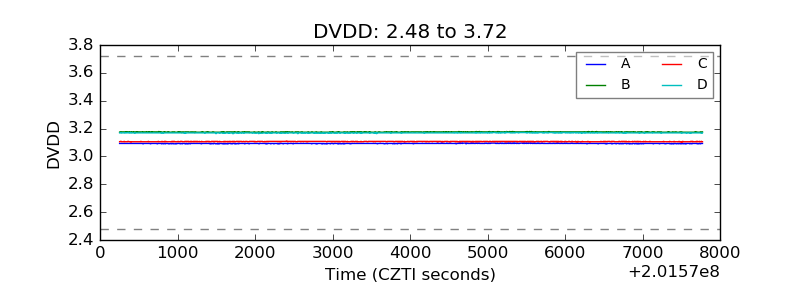 |
| Temperature 1 | 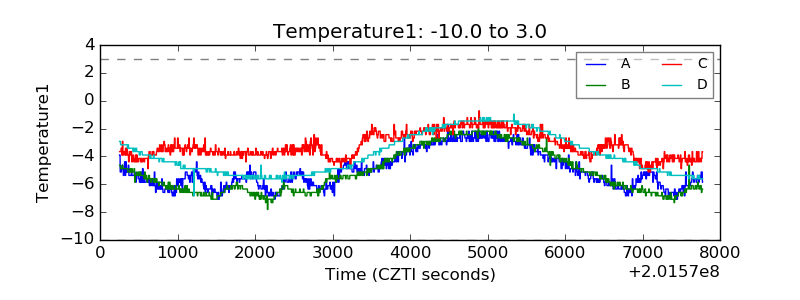 |
| Veto HV Monitor | 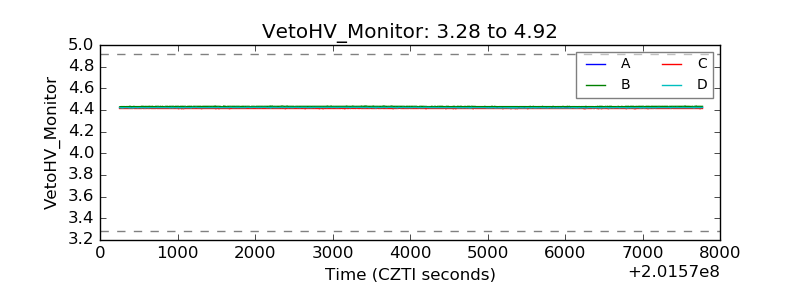 |
| Veto LLD | 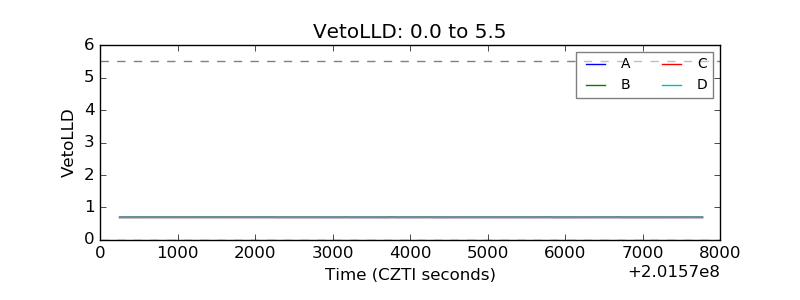 |
| Alpha Counter |  |
| _CPM_Rate | 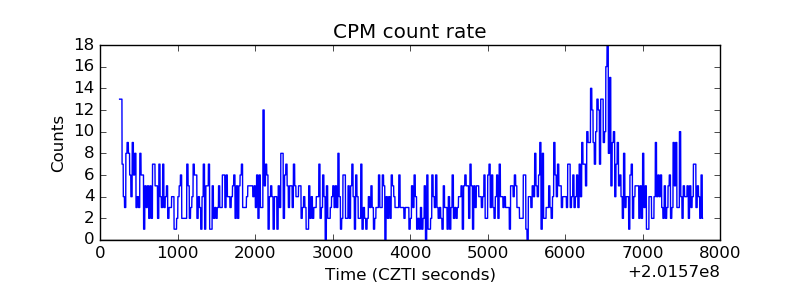 |
| CZT Counter | 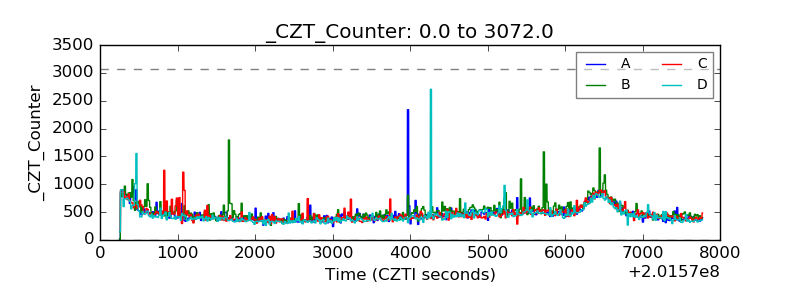 |
| +2.5 Volts monitor |  |
| +5 Volts monitor |  |
| Veto Counter | 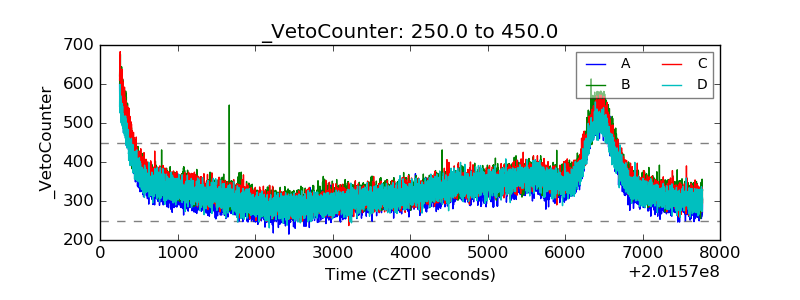 |