| Param | Original file | Final file |
|---|---|---|
| Filename | modeM0/AS1G05_045T01_9000000468cztM0_level2.fits | modeM0/AS1G05_045T01_9000000468cztM0_level2_quad_clean.evt |
| Size (bytes) | 3,205,128,960 | 3,452,402,880 |
| Size | 3.0 GB | 3.2 GB |
| Events in quadrant A | 19,132,168 | 21,111,852 |
| Events in quadrant B | 18,446,016 | 20,909,096 |
| Events in quadrant C | 18,451,770 | 19,080,401 |
| Events in quadrant D | 16,273,054 | 18,712,136 |
| Mode M0 | |||
|---|---|---|---|
| Quadrant | BADHDUFLAG | Total packets | Discarded packets |
| A | 0 | 776172 | 0 |
| B | 0 | 817402 | 0 |
| C | 0 | 955035 | 0 |
| D | 0 | 771090 | 0 |
| Mode M9 | |||
|---|---|---|---|
| Quadrant | BADHDUFLAG | Total packets | Discarded packets |
| A | 0 | 538 | 0 |
| B | 0 | 538 | 0 |
| C | 0 | 538 | 0 |
| D | 0 | 538 | 0 |
| Mode SS | |||
|---|---|---|---|
| Quadrant | BADHDUFLAG | Total packets | Discarded packets |
| A | 0 | 7434 | 0 |
| B | 0 | 7432 | 0 |
| C | 0 | 7434 | 0 |
| D | 0 | 7434 | 0 |
| Quadrant | Total seconds | Saturated seconds | Saturation percentage |
|---|---|---|---|
| A | 361203 | 6351 | 1.758291% |
| B | 361199 | 5873 | 1.625973% |
| C | 361101 | 22749 | 6.299899% |
| D | 361202 | 4490 | 1.243072% |
Noise dominated data is calculated using 1-second bins in cleaned event files. If a bin has >2000 counts, and if more than 50% of those come from <1% of pixels, then it is considered to be noise-dominated and hence unusable.
| Quadrant | # 1 sec bins | Bins with >0 counts | Bins with >2000 counts | High rate bins dominated by noise | Noise dominated (total time) | Noise dominated (detector-on time) | Marked lightcurve |
|---|---|---|---|---|---|---|---|
| A | 418797 | 361132 | 0 | 0 | 0.00% | 0.00% |  |
| B | 418797 | 361152 | 0 | 0 | 0.00% | 0.00% |  |
| C | 418797 | 361024 | 0 | 0 | 0.00% | 0.00% |  |
| D | 418797 | 361140 | 0 | 0 | 0.00% | 0.00% | 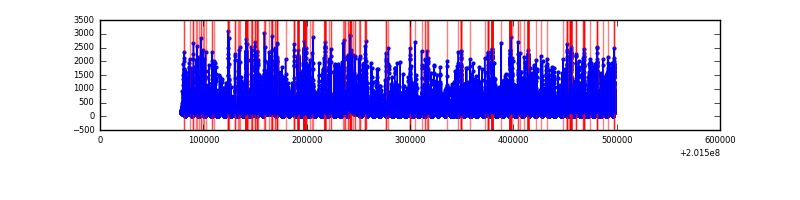 |
Top three noisy pixels from each quadrant. If the there are fewer than three noisy pixels in the level2.evt file, extra rows are filled as -1
| Pixel properties | Quadrant properties | ||||||
|---|---|---|---|---|---|---|---|
| Quadrant | DetID | PixID | Counts | Sigma | Mean | Median | Sigma |
| A | 0 | 29 | 18686 | 10.91 | 4984 | 4626 | 1288.3 |
| A | 7 | 110 | 16156 | 8.95 | 4984 | 4626 | 1288.3 |
| A | 0 | 30 | 14625 | 7.76 | 4984 | 4626 | 1288.3 |
| B | 2 | 9 | 15915 | 11.57 | 4880 | 4633 | 974.9 |
| B | 12 | 226 | 13926 | 9.53 | 4880 | 4633 | 974.9 |
| B | 14 | 254 | 13354 | 8.95 | 4880 | 4633 | 974.9 |
| C | 1 | 80 | 13547 | 7.05 | 4875 | 4505 | 1282.4 |
| C | 1 | 81 | 13377 | 6.92 | 4875 | 4505 | 1282.4 |
| C | 12 | 241 | 12747 | 6.43 | 4875 | 4505 | 1282.4 |
| D | 3 | 14 | 12012 | 6.37 | 4658 | 4228 | 1221.0 |
| D | 7 | 5 | 11939 | 6.32 | 4658 | 4228 | 1221.0 |
| D | 6 | 231 | 11916 | 6.3 | 4658 | 4228 | 1221.0 |
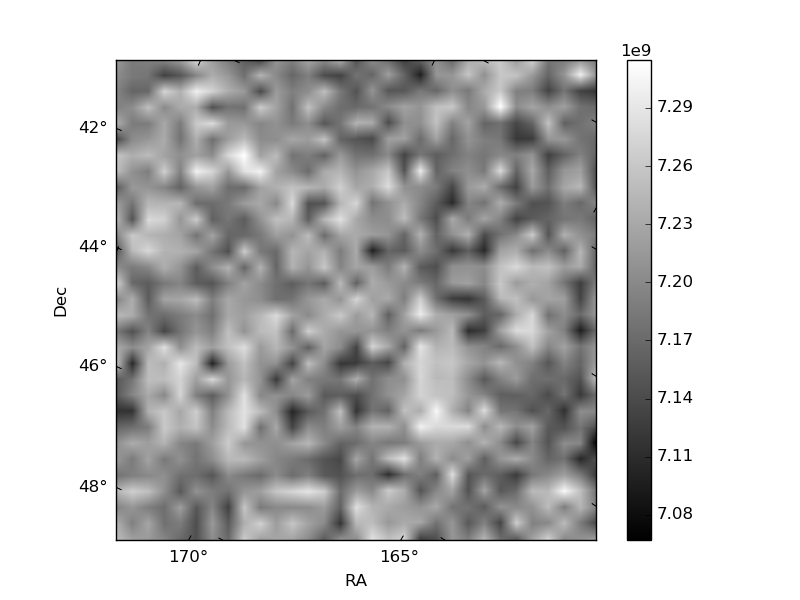
Histogram calculated using DETX and DETY for each event in the final _common_clean file
| Quadrant A | 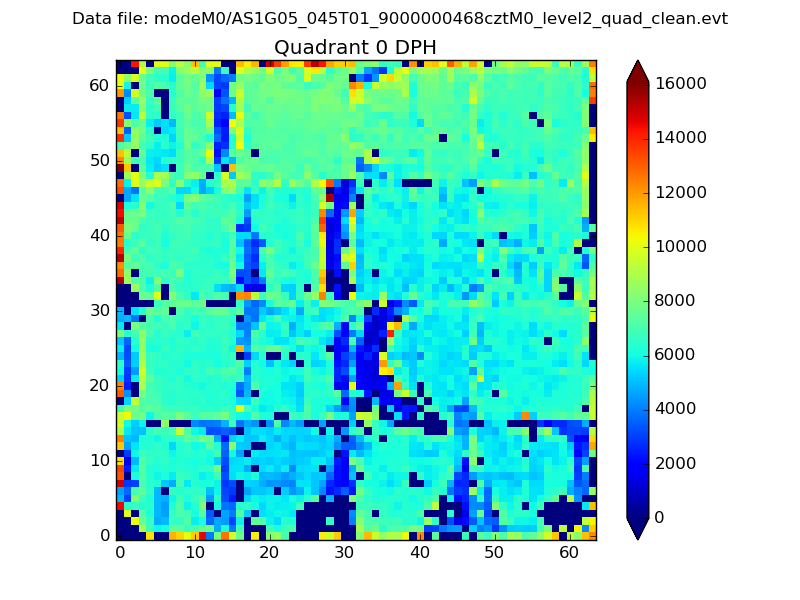 |
 |
Quadrant B |
|---|---|---|---|
| Quadrant D | 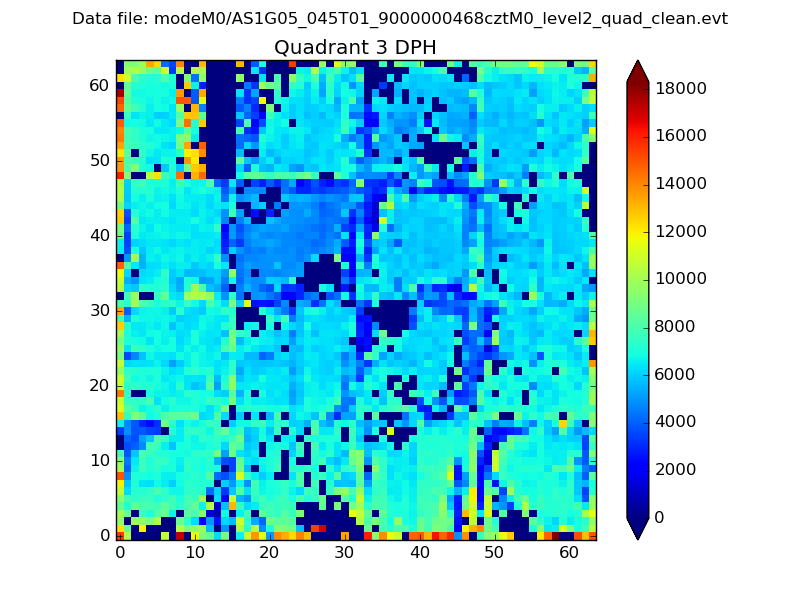 |
 |
Quadrant C |
| Plot type | Count rate plots | Images |
|---|---|---|
| Comparison with Poisson distribution Blue bars denote a histogram of data divided into 1 sec bins. Red curve is a Poisson curve with rate = median count rate of data. |
 |
 |
| Quadrant-wise count rates Data is divided into 100 sec bins |
 |
|
| Module-wise count rates for Quadrant A Data is divided into 100 sec bins |
 |
 |
| Module-wise count rates for Quadrant B Data is divided into 100 sec bins |
 |
 |
| Module-wise count rates for Quadrant C Data is divided into 100 sec bins |
 |
 |
| Module-wise count rates for Quadrant D Data is divided into 100 sec bins |
 |
 |
| Parameter | Plot |
|---|---|
| CZT HV Monitor |  |
| D_VDD |  |
| Temperature 1 |  |
| Veto HV Monitor | 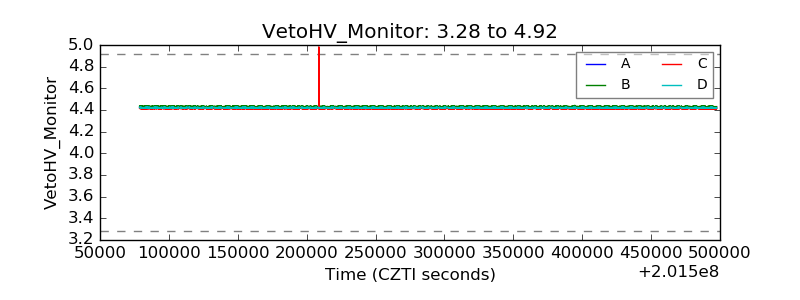 |
| Veto LLD | 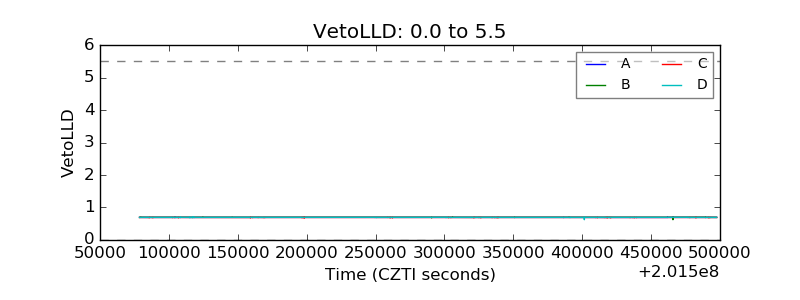 |
| Alpha Counter |  |
| _CPM_Rate |  |
| CZT Counter |  |
| +2.5 Volts monitor |  |
| +5 Volts monitor | 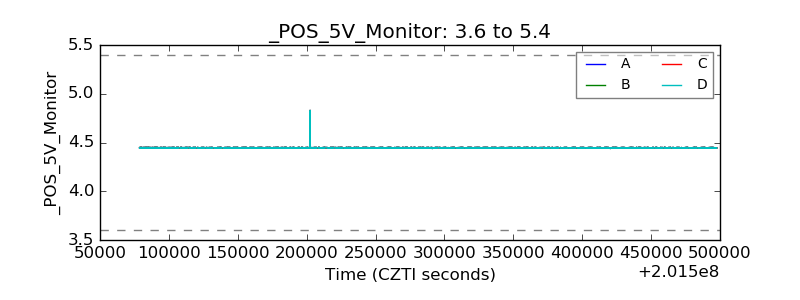 |
| _ROLL_ROT |  |
| _Roll_DEC |  |
| _Roll_RA |  |
| Veto Counter |  |