| Param | Original file | Final file |
|---|---|---|
| Filename | modeM0/AS1G05_045T01_9000000468_03508cztM0_level2.evt | modeM0/AS1G05_045T01_9000000468_03508cztM0_level2_quad_clean.evt |
| Size (bytes) | 388,143,360 | 63,918,720 |
| Size | 370.2 MB | 61.0 MB |
| Events in quadrant A | 2,679,798 | 385,553 |
| Events in quadrant B | 3,229,749 | 384,054 |
| Events in quadrant C | 2,730,365 | 387,165 |
| Events in quadrant D | 2,721,471 | 374,524 |
| Mode M0 | |||
|---|---|---|---|
| Quadrant | BADHDUFLAG | Total packets | Discarded packets |
| A | 0 | 12079 | 2 |
| B | 0 | 13591 | 1 |
| C | 0 | 12218 | 1 |
| D | 0 | 12567 | 1 |
| Mode SS | |||
|---|---|---|---|
| Quadrant | BADHDUFLAG | Total packets | Discarded packets |
| A | 0 | 116 | 0 |
| B | 0 | 116 | 0 |
| C | 0 | 116 | 0 |
| D | 0 | 116 | 0 |
| Quadrant | Total seconds | Saturated seconds | Saturation percentage |
|---|---|---|---|
| A | 5773 | 211 | 3.654945% |
| B | 5773 | 263 | 4.555690% |
| C | 5773 | 133 | 2.303828% |
| D | 5773 | 160 | 2.771523% |
Noise dominated data is calculated using 1-second bins in cleaned event files. If a bin has >2000 counts, and if more than 50% of those come from <1% of pixels, then it is considered to be noise-dominated and hence unusable.
| Quadrant | # 1 sec bins | Bins with >0 counts | Bins with >2000 counts | High rate bins dominated by noise | Noise dominated (total time) | Noise dominated (detector-on time) | Marked lightcurve |
|---|---|---|---|---|---|---|---|
| A | 5798 | 5774 | 4 | 4 | 0.07% | 0.07% | 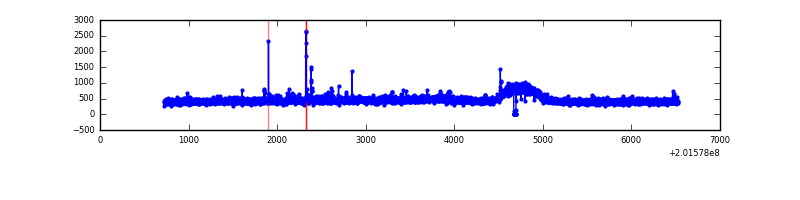 |
| B | 5798 | 5774 | 4 | 4 | 0.07% | 0.07% | 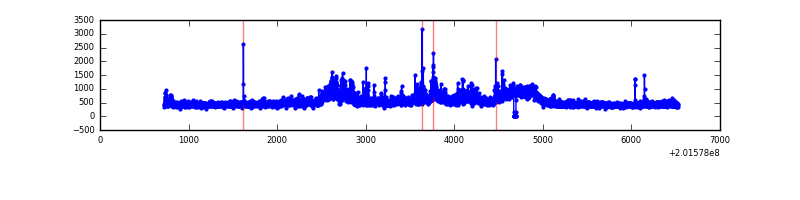 |
| C | 5798 | 5774 | 5 | 5 | 0.09% | 0.09% | 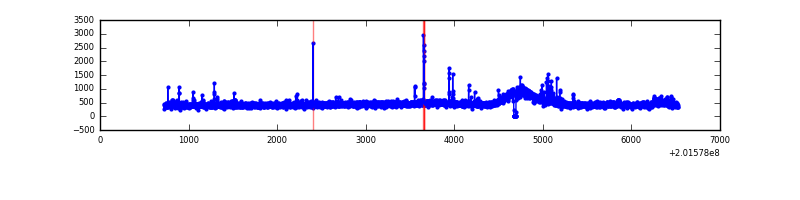 |
| D | 5798 | 5774 | 43 | 43 | 0.74% | 0.74% |  |
Top three noisy pixels from each quadrant. If the there are fewer than three noisy pixels in the level2.evt file, extra rows are filled as -1
| Pixel properties | Quadrant properties | ||||||
|---|---|---|---|---|---|---|---|
| Quadrant | DetID | PixID | Counts | Sigma | Mean | Median | Sigma |
| A | 14 | 238 | 25995 | 180.91 | 673 | 655 | 140.1 |
| A | 7 | 16 | 13941 | 94.85 | 673 | 655 | 140.1 |
| A | 15 | 174 | 13625 | 92.6 | 673 | 655 | 140.1 |
| B | 15 | 204 | 480134 | 3571.32 | 679 | 659 | 134.3 |
| B | 14 | 167 | 60132 | 442.98 | 679 | 659 | 134.3 |
| B | 2 | 249 | 10698 | 74.77 | 679 | 659 | 134.3 |
| C | 1 | 192 | 60074 | 382.81 | 660 | 660 | 155.2 |
| C | 9 | 54 | 35820 | 226.54 | 660 | 660 | 155.2 |
| C | 15 | 208 | 18002 | 111.73 | 660 | 660 | 155.2 |
| D | 13 | 223 | 153607 | 950.05 | 659 | 636 | 161.0 |
| D | 10 | 172 | 50930 | 312.36 | 659 | 636 | 161.0 |
| D | 7 | 46 | 15435 | 91.91 | 659 | 636 | 161.0 |
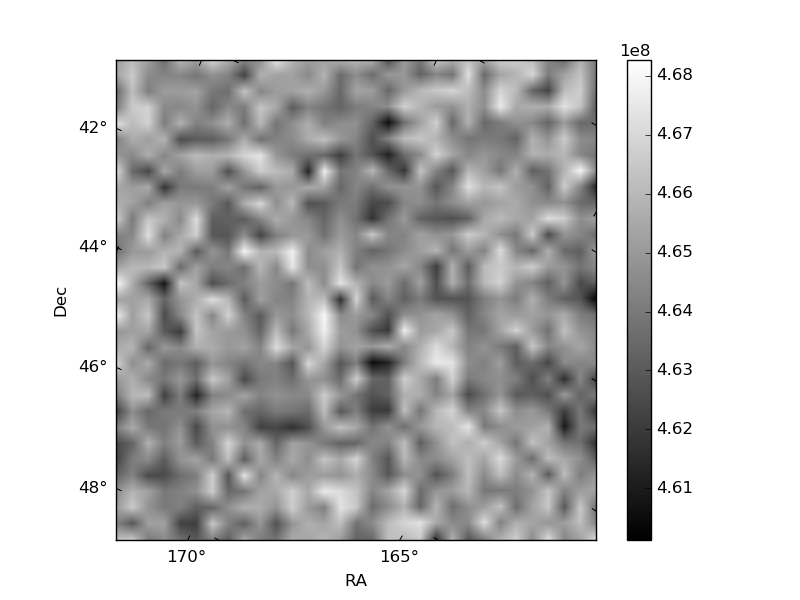
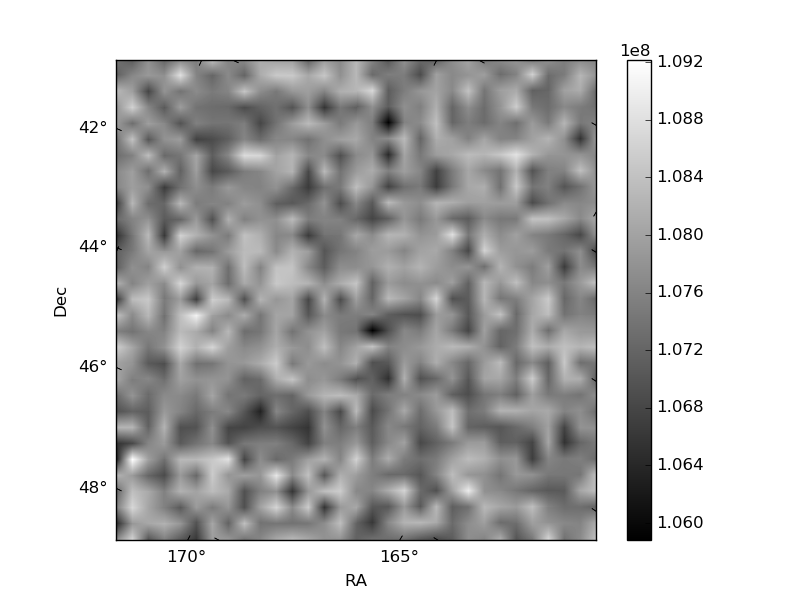
Histogram calculated using DETX and DETY for each event in the final _common_clean file
| Quadrant A | 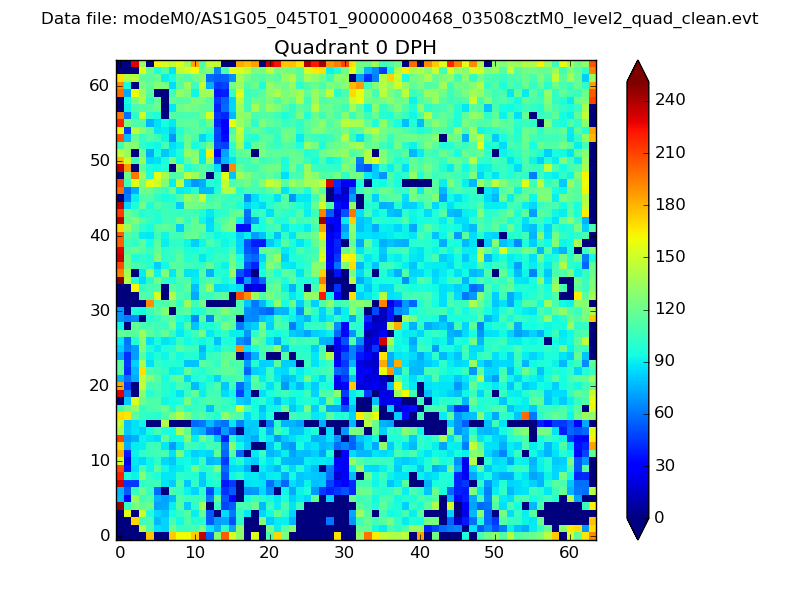 |
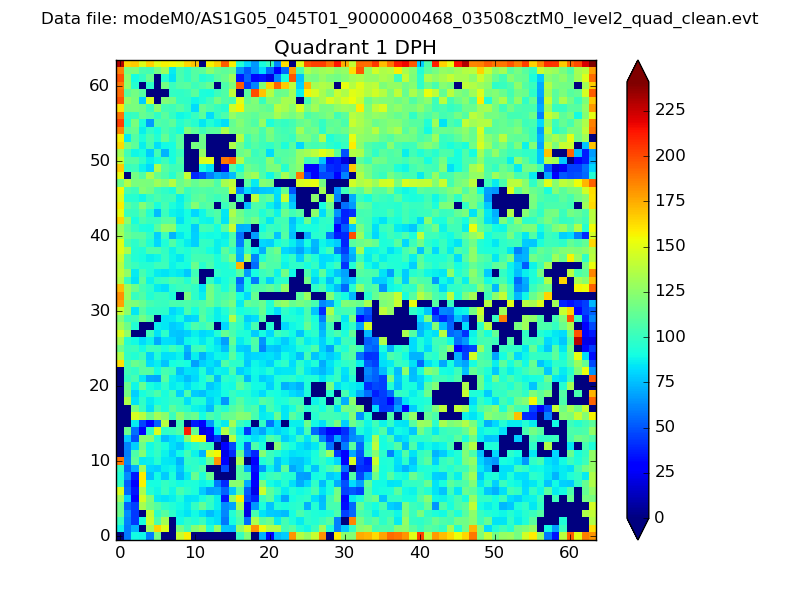 |
Quadrant B |
|---|---|---|---|
| Quadrant D | 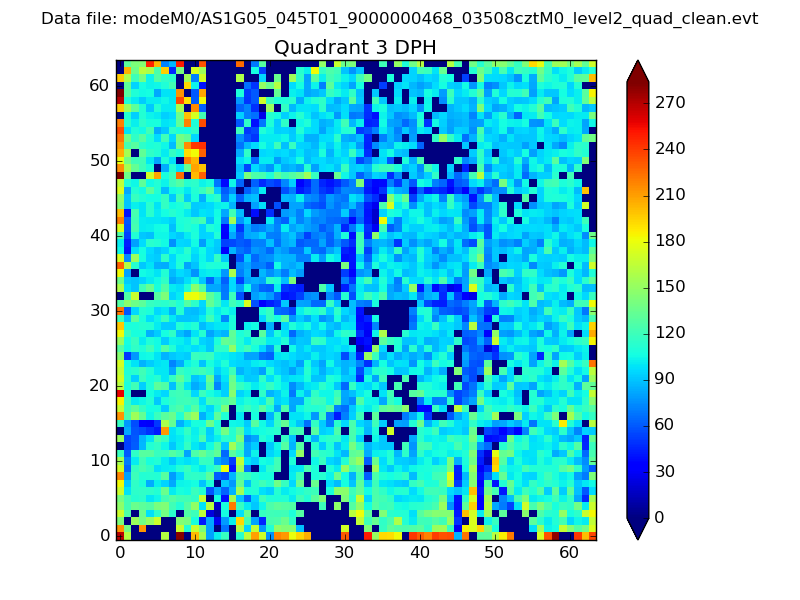 |
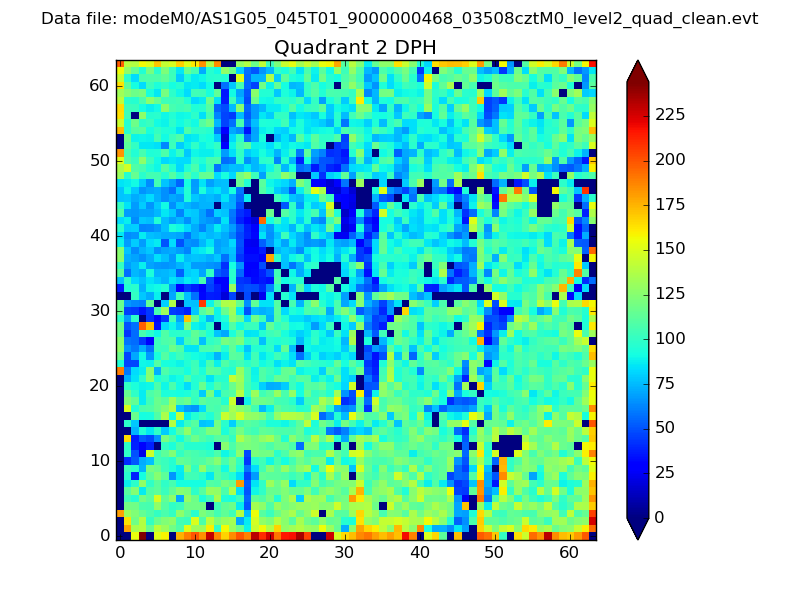 |
Quadrant C |
| Plot type | Count rate plots | Images |
|---|---|---|
| Comparison with Poisson distribution Blue bars denote a histogram of data divided into 1 sec bins. Red curve is a Poisson curve with rate = median count rate of data. |
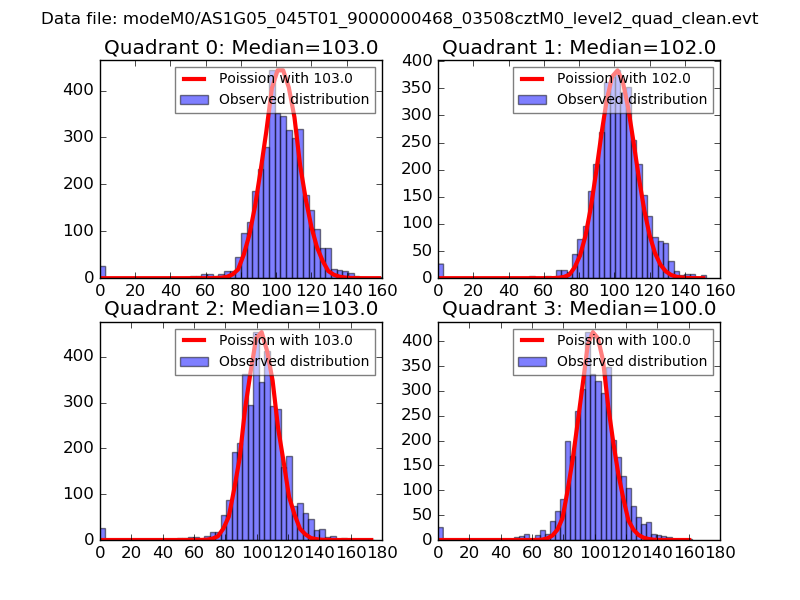 |
 |
| Quadrant-wise count rates Data is divided into 100 sec bins |
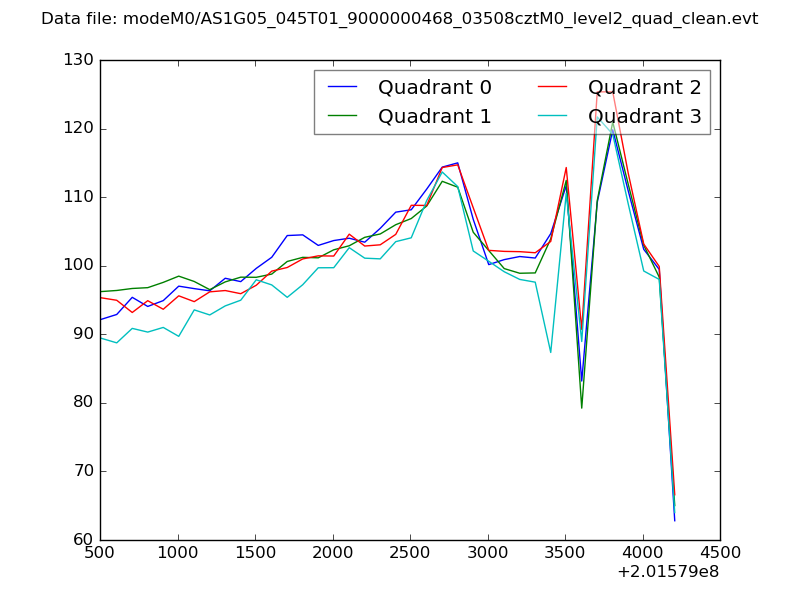 |
|
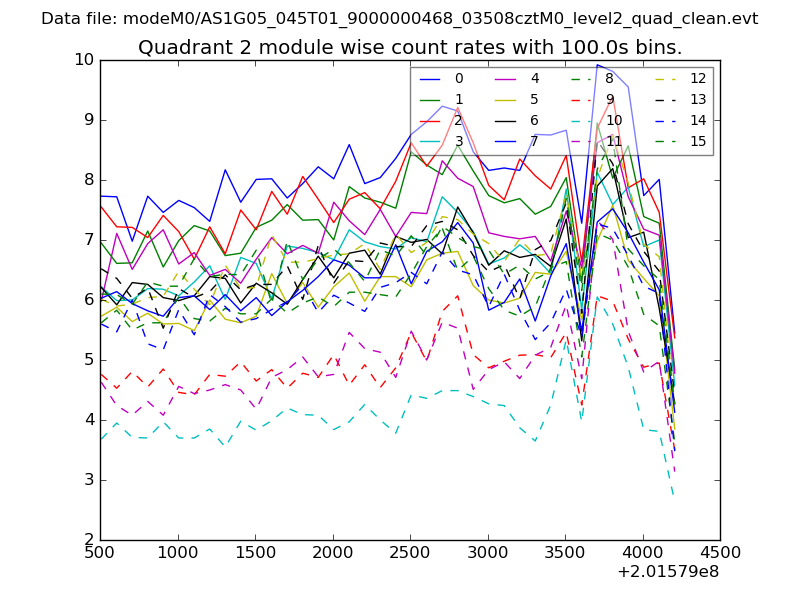
| Module-wise count rates for Quadrant A Data is divided into 100 sec bins |
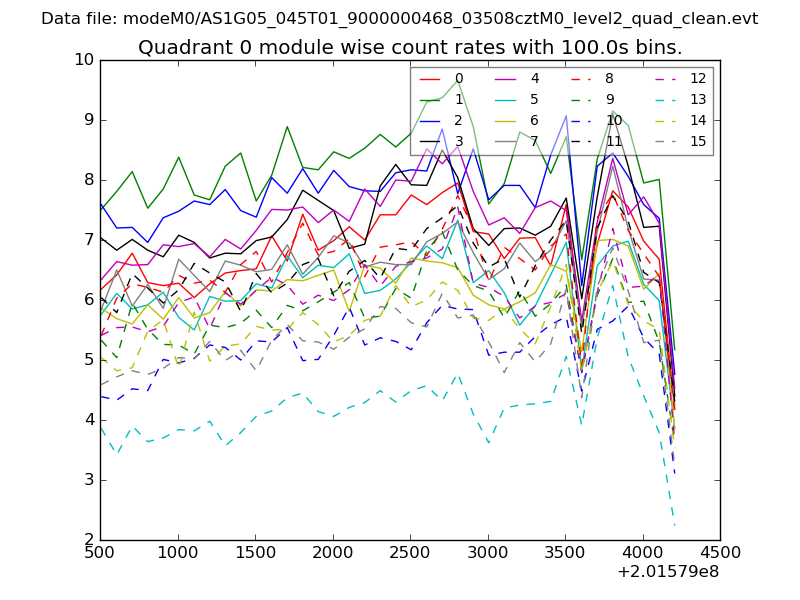 |
 |
| Module-wise count rates for Quadrant B Data is divided into 100 sec bins |
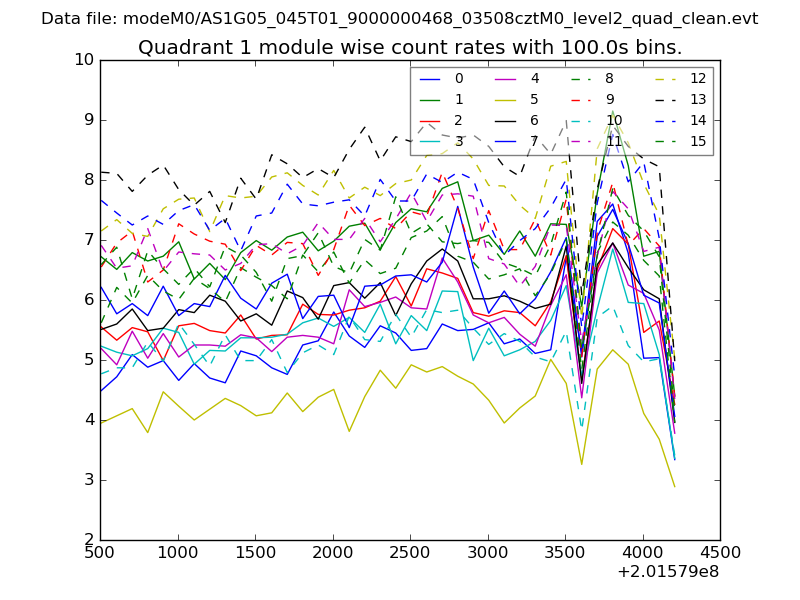 |
 |
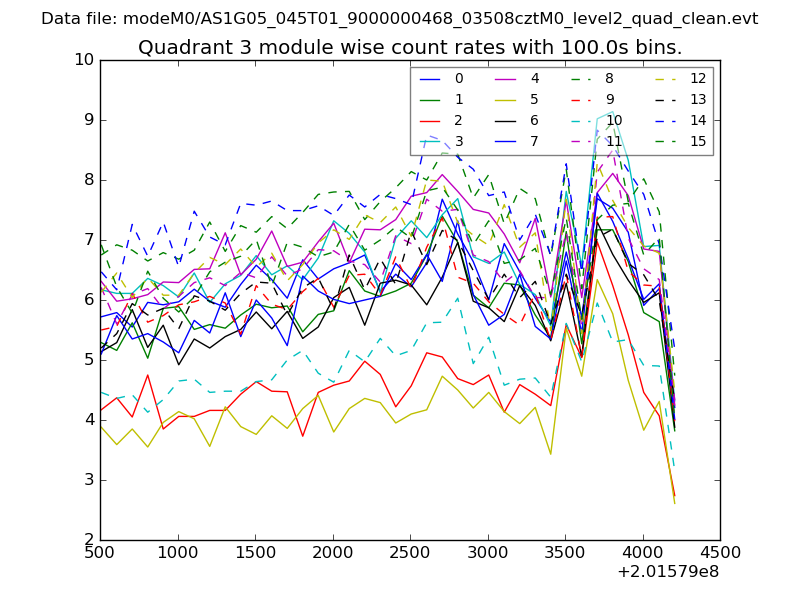
| Module-wise count rates for Quadrant C Data is divided into 100 sec bins |
 |
 |
| Module-wise count rates for Quadrant D Data is divided into 100 sec bins |
 |
 |
| Parameter | Plot |
|---|---|
| CZT HV Monitor | 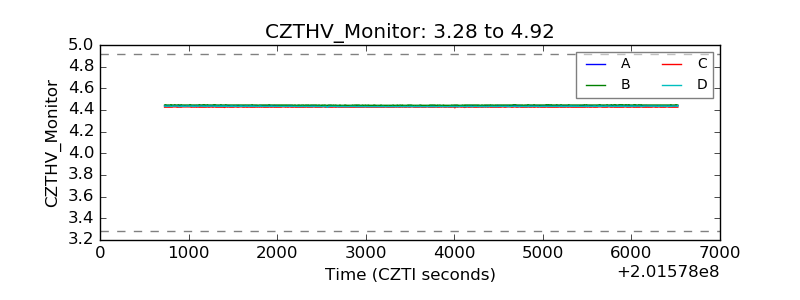 |
| D_VDD | 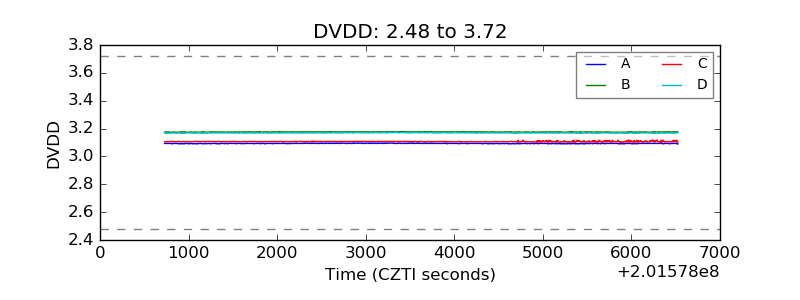 |
| Temperature 1 | 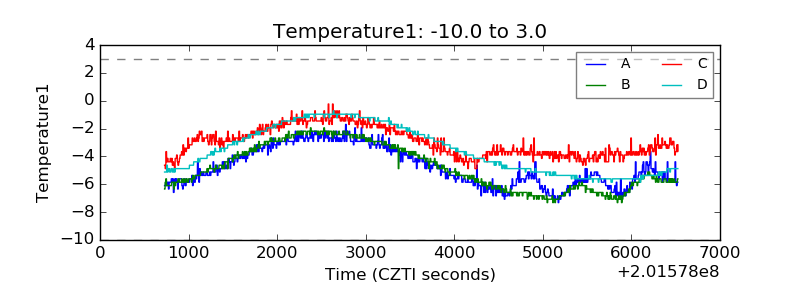 |
| Veto HV Monitor | 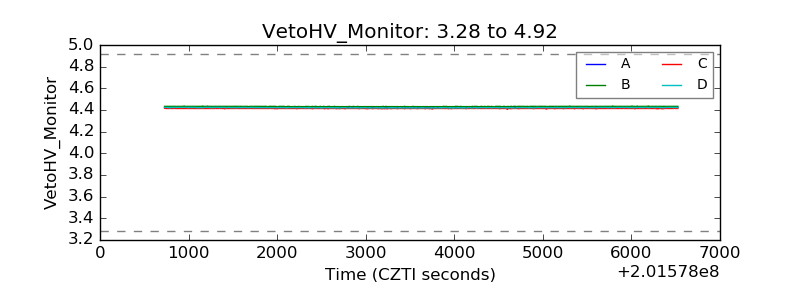 |
| Veto LLD | 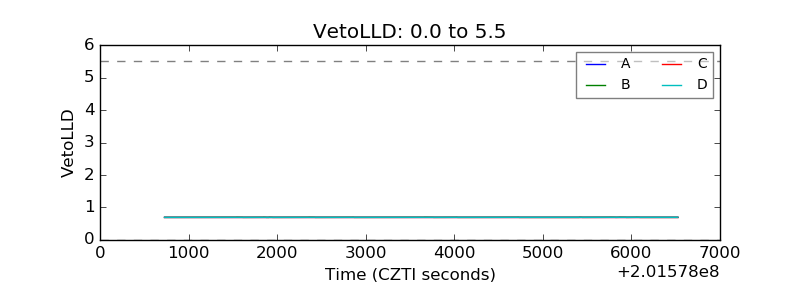 |
| Alpha Counter | 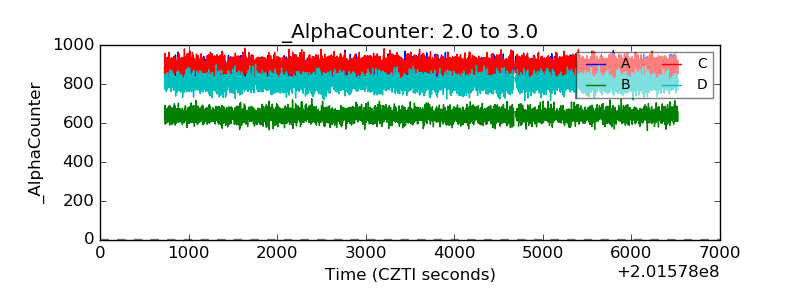 |
| _CPM_Rate | 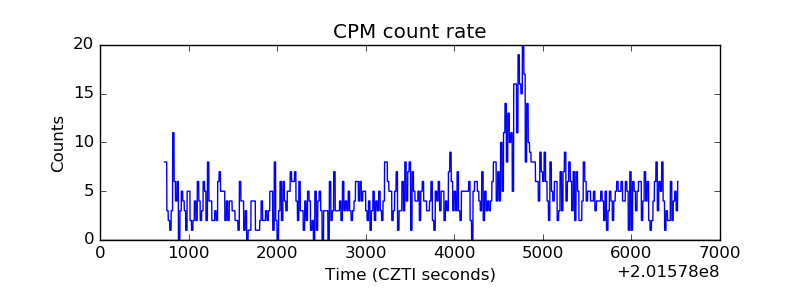 |
| CZT Counter | 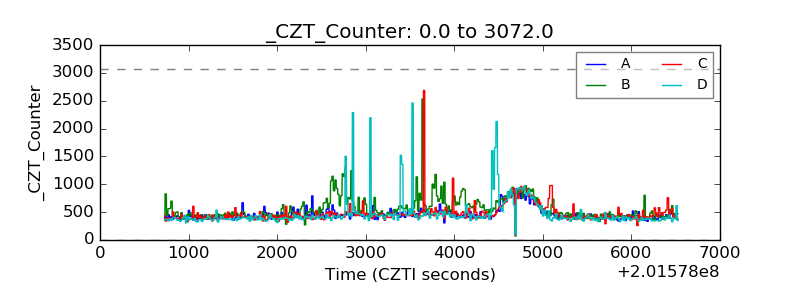 |
| +2.5 Volts monitor |  |
| +5 Volts monitor | 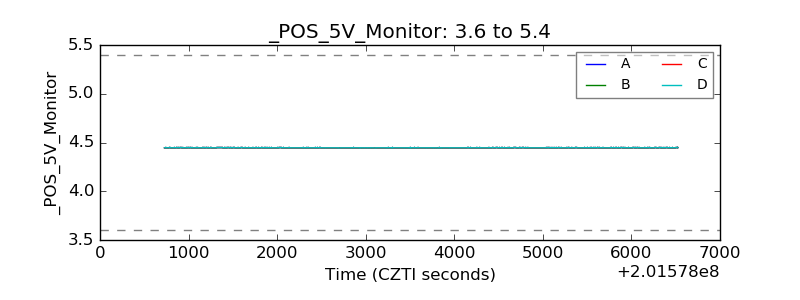 |
| Veto Counter | 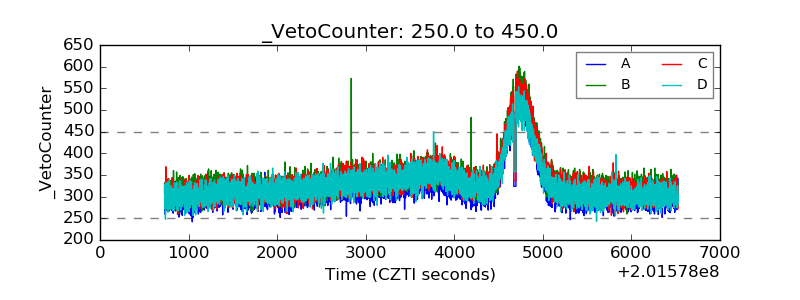 |