| Param | Original file | Final file |
|---|---|---|
| Filename | modeM0/AS1G05_045T01_9000000468_03511cztM0_level2.evt | modeM0/AS1G05_045T01_9000000468_03511cztM0_level2_quad_clean.evt |
| Size (bytes) | 1,167,500,160 | 190,152,000 |
| Size | 1.1 GB | 181.3 MB |
| Events in quadrant A | 8,458,146 | 1,136,780 |
| Events in quadrant B | 8,981,707 | 1,133,910 |
| Events in quadrant C | 8,441,051 | 1,123,962 |
| Events in quadrant D | 8,230,255 | 1,095,418 |
| Mode M0 | |||
|---|---|---|---|
| Quadrant | BADHDUFLAG | Total packets | Discarded packets |
| A | 0 | 38361 | 4 |
| B | 0 | 38758 | 5 |
| C | 0 | 38443 | 3 |
| D | 0 | 38709 | 3 |
| Mode M9 | |||
|---|---|---|---|
| Quadrant | BADHDUFLAG | Total packets | Discarded packets |
| A | 0 | 17 | 0 |
| B | 0 | 17 | 0 |
| C | 0 | 17 | 0 |
| D | 0 | 17 | 0 |
| Mode SS | |||
|---|---|---|---|
| Quadrant | BADHDUFLAG | Total packets | Discarded packets |
| A | 0 | 374 | 0 |
| B | 0 | 374 | 0 |
| C | 0 | 374 | 0 |
| D | 0 | 374 | 0 |
| Quadrant | Total seconds | Saturated seconds | Saturation percentage |
|---|---|---|---|
| A | 18412 | 265 | 1.439279% |
| B | 18411 | 256 | 1.390473% |
| C | 18412 | 184 | 0.999348% |
| D | 18412 | 254 | 1.379535% |
Noise dominated data is calculated using 1-second bins in cleaned event files. If a bin has >2000 counts, and if more than 50% of those come from <1% of pixels, then it is considered to be noise-dominated and hence unusable.
| Quadrant | # 1 sec bins | Bins with >0 counts | Bins with >2000 counts | High rate bins dominated by noise | Noise dominated (total time) | Noise dominated (detector-on time) | Marked lightcurve |
|---|---|---|---|---|---|---|---|
| A | 20117 | 18413 | 19 | 19 | 0.09% | 0.10% | 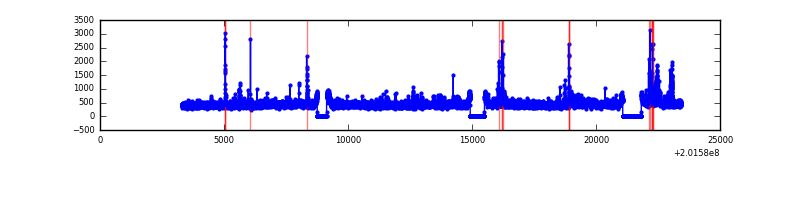 |
| B | 20117 | 18413 | 13 | 13 | 0.06% | 0.07% | 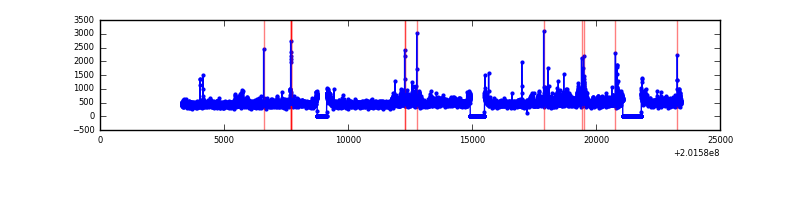 |
| C | 20117 | 18413 | 22 | 22 | 0.11% | 0.12% | 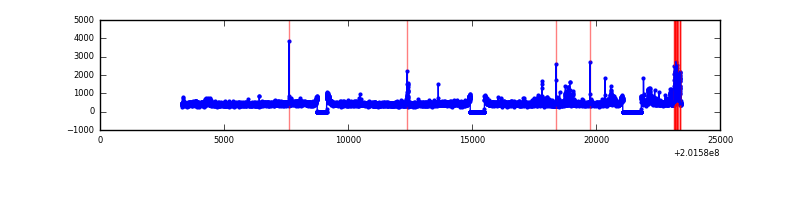 |
| D | 20117 | 18413 | 77 | 77 | 0.38% | 0.42% | 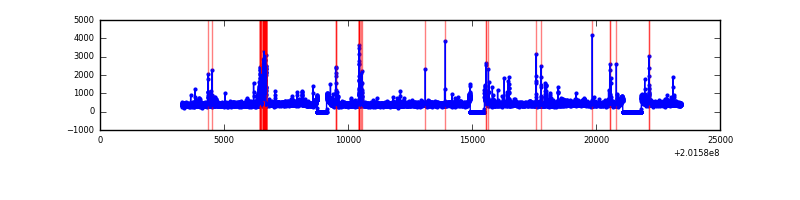 |
Top three noisy pixels from each quadrant. If the there are fewer than three noisy pixels in the level2.evt file, extra rows are filled as -1
| Pixel properties | Quadrant properties | ||||||
|---|---|---|---|---|---|---|---|
| Quadrant | DetID | PixID | Counts | Sigma | Mean | Median | Sigma |
| A | 0 | 50 | 229612 | 541.9 | 2059 | 2014 | 420.0 |
| A | 8 | 15 | 137999 | 323.77 | 2059 | 2014 | 420.0 |
| A | 0 | 118 | 82754 | 192.24 | 2059 | 2014 | 420.0 |
| B | 15 | 204 | 649716 | 1591.2 | 2091 | 2036 | 407.0 |
| B | 15 | 85 | 68256 | 162.69 | 2091 | 2036 | 407.0 |
| B | 14 | 167 | 44116 | 103.38 | 2091 | 2036 | 407.0 |
| C | 1 | 192 | 441966 | 940.26 | 2010 | 2020 | 467.9 |
| C | 15 | 208 | 58251 | 120.18 | 2010 | 2020 | 467.9 |
| C | 8 | 128 | 28190 | 55.93 | 2010 | 2020 | 467.9 |
| D | 2 | 37 | 281648 | 580.67 | 1997 | 1936 | 481.7 |
| D | 13 | 239 | 133455 | 273.03 | 1997 | 1936 | 481.7 |
| D | 5 | 233 | 70124 | 141.55 | 1997 | 1936 | 481.7 |
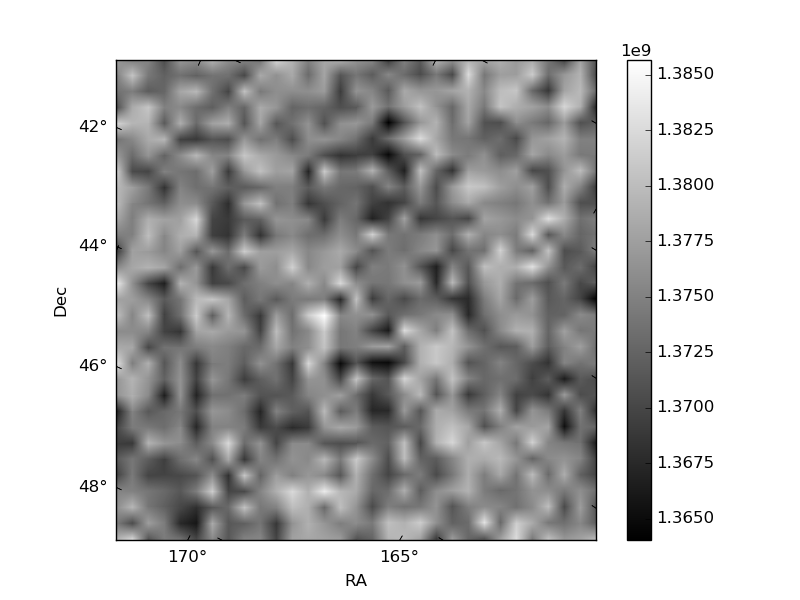
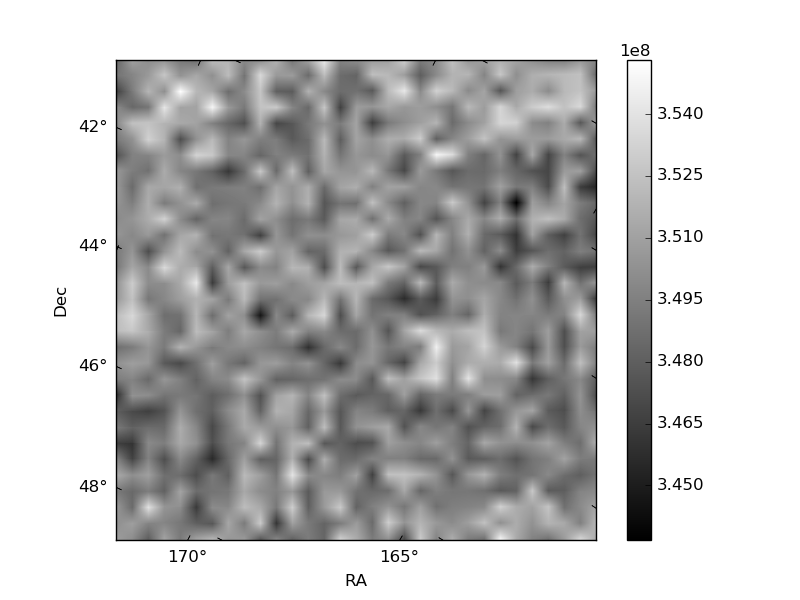
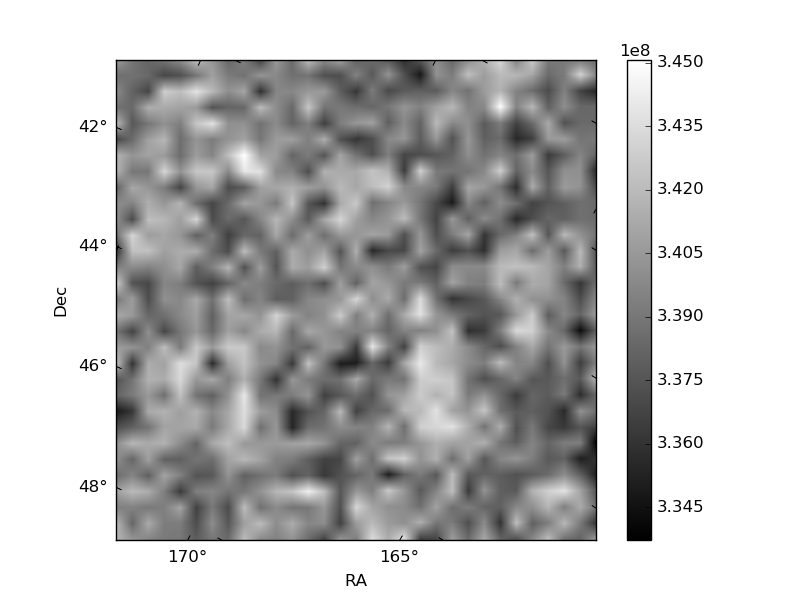
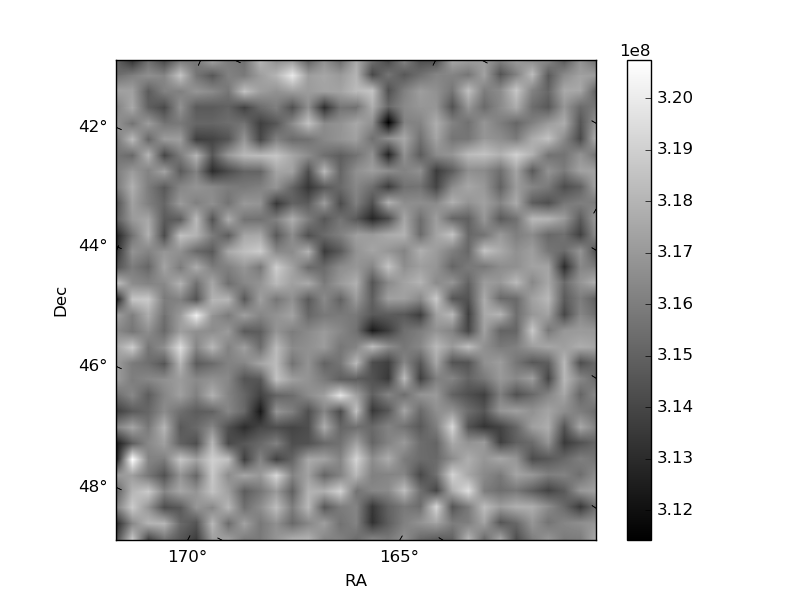
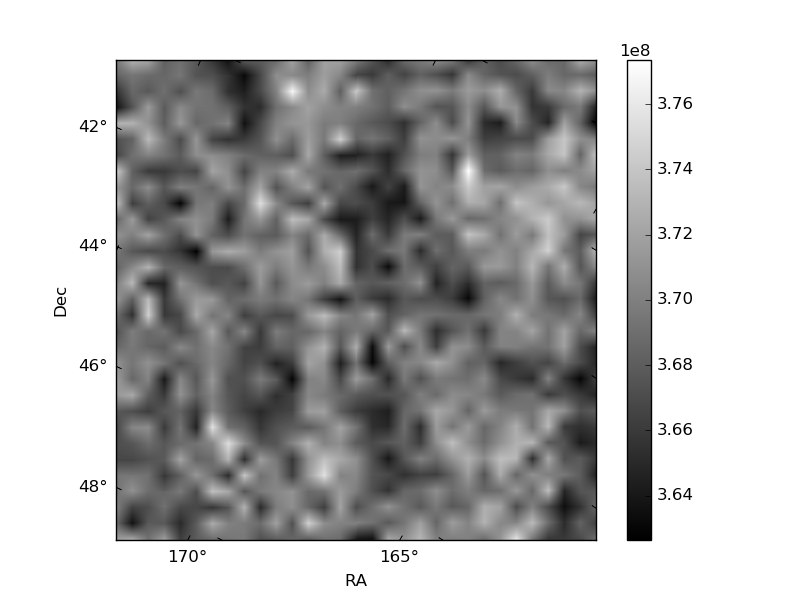
Histogram calculated using DETX and DETY for each event in the final _common_clean file
| Quadrant A | 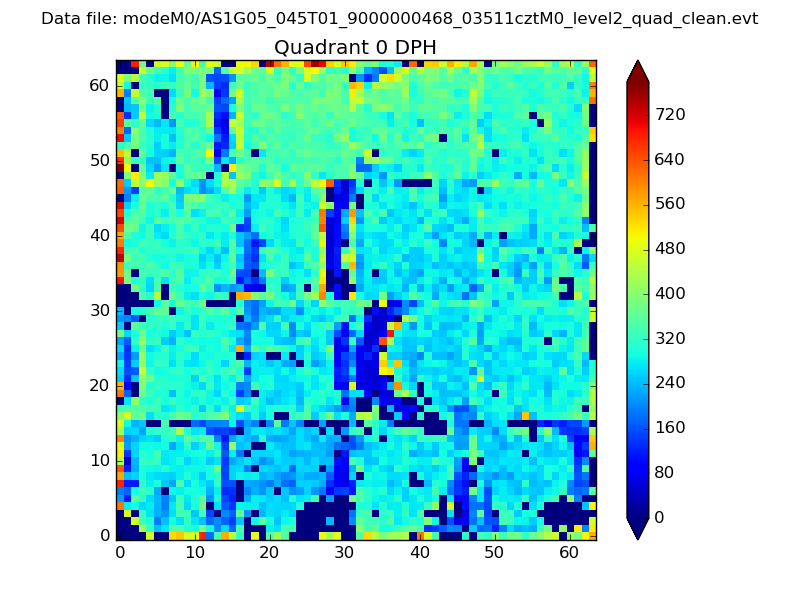 |
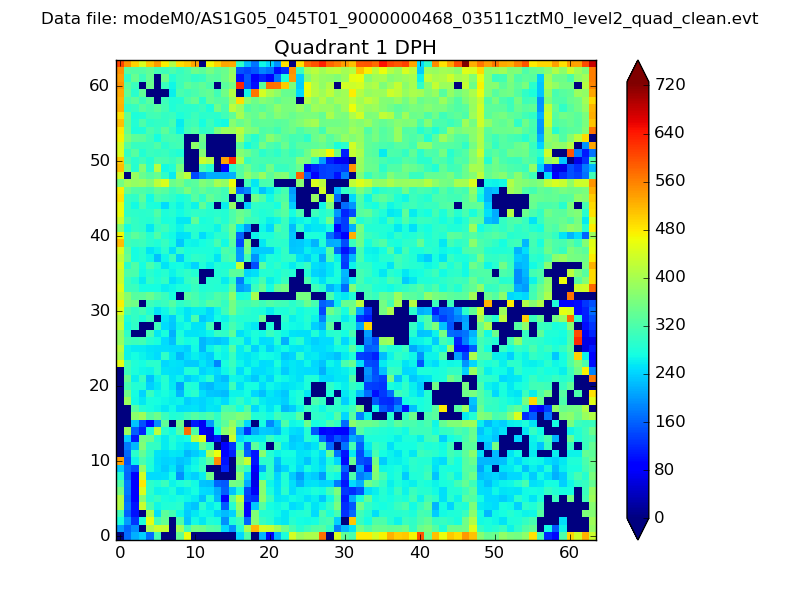 |
Quadrant B |
|---|---|---|---|
| Quadrant D | 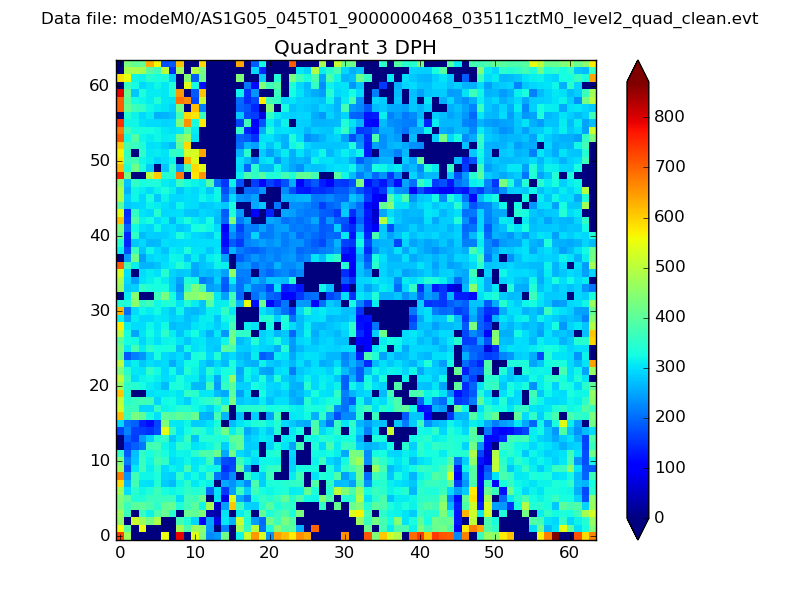 |
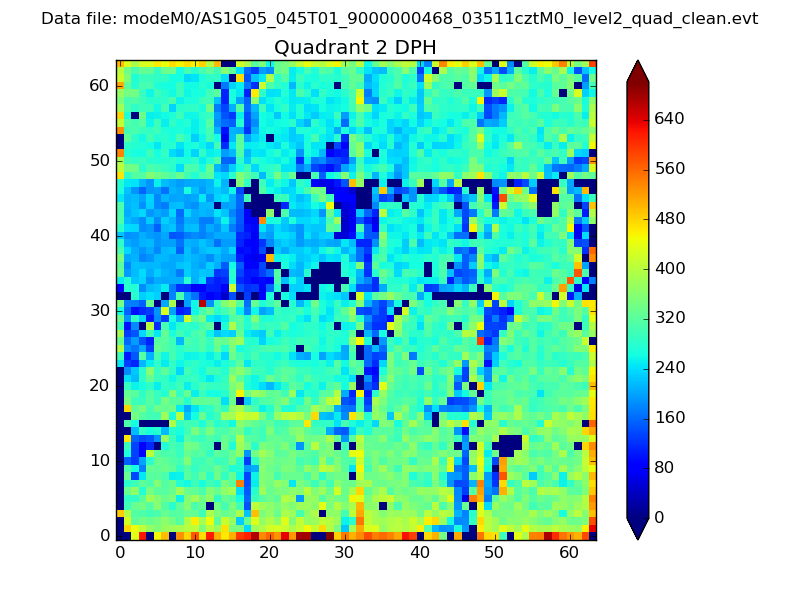 |
Quadrant C |
| Plot type | Count rate plots | Images |
|---|---|---|
| Comparison with Poisson distribution Blue bars denote a histogram of data divided into 1 sec bins. Red curve is a Poisson curve with rate = median count rate of data. |
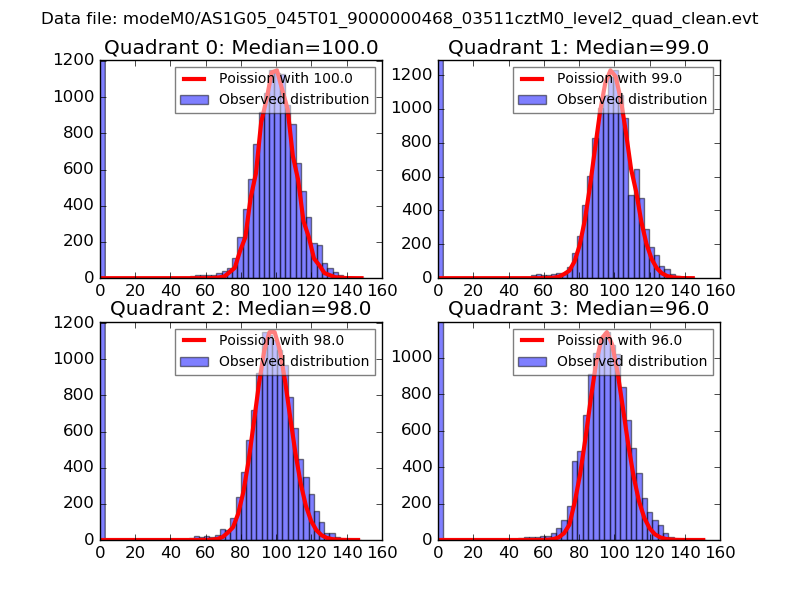 |
 |
| Quadrant-wise count rates Data is divided into 100 sec bins |
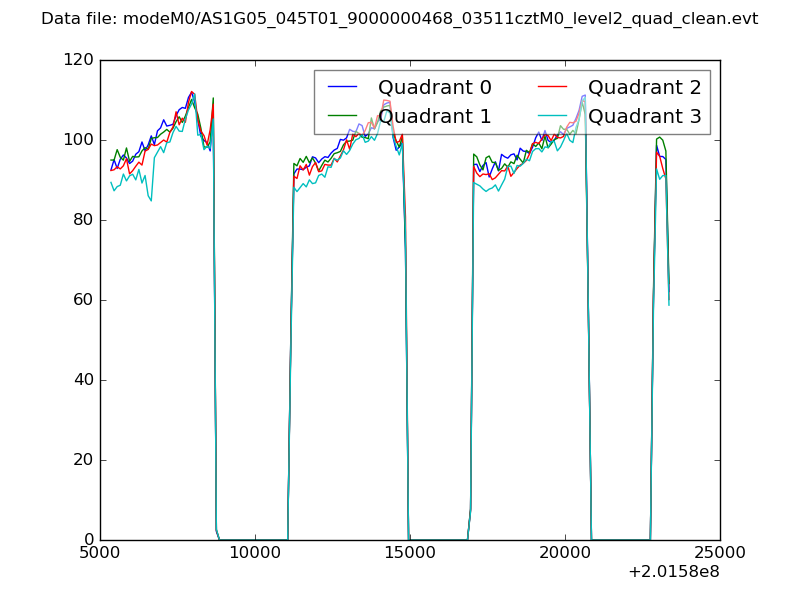 |
|
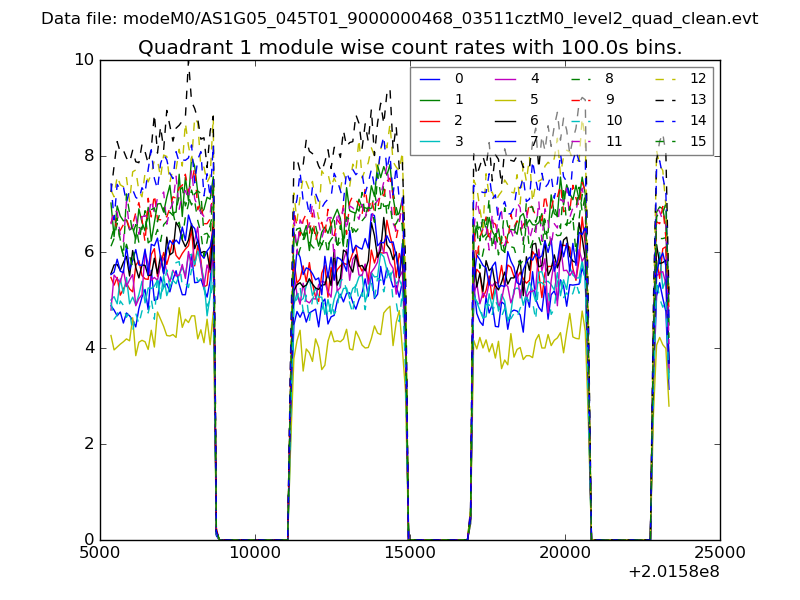
| Module-wise count rates for Quadrant A Data is divided into 100 sec bins |
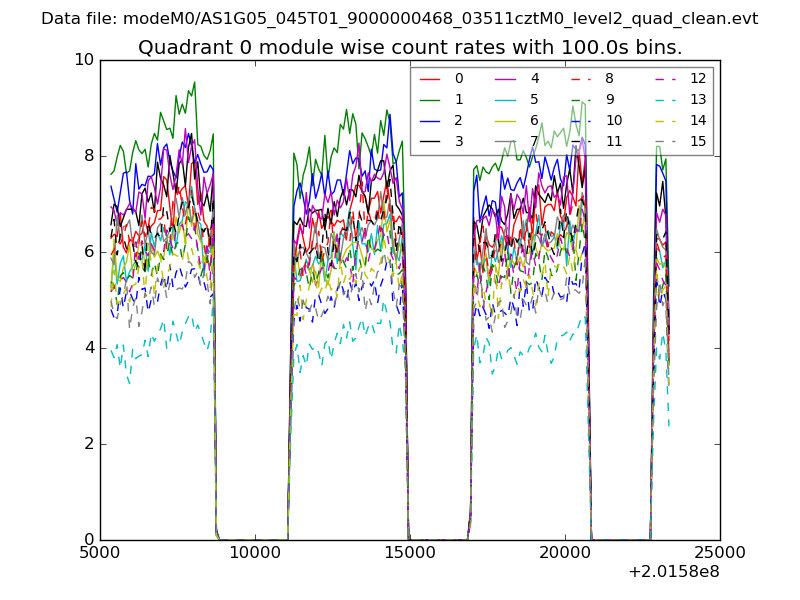 |
 |
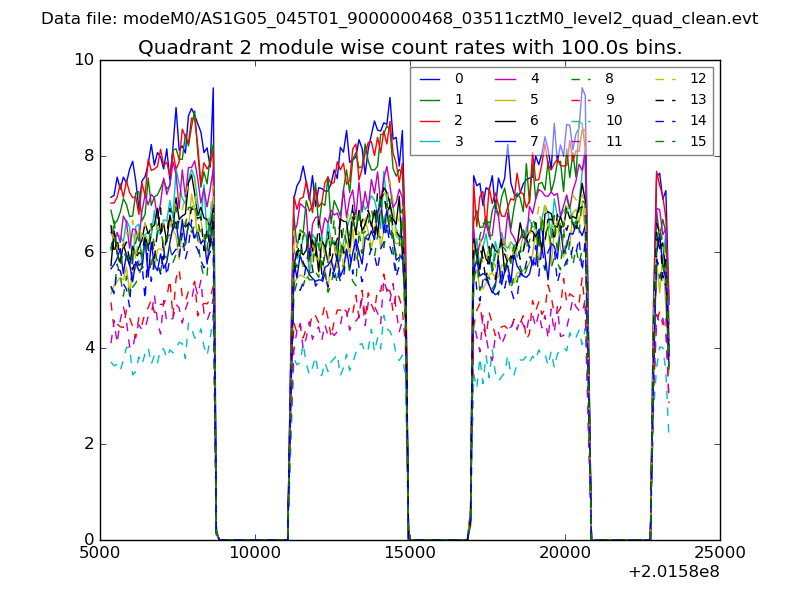
| Module-wise count rates for Quadrant B Data is divided into 100 sec bins |
 |
 |
| Module-wise count rates for Quadrant C Data is divided into 100 sec bins |
 |
 |
| Module-wise count rates for Quadrant D Data is divided into 100 sec bins |
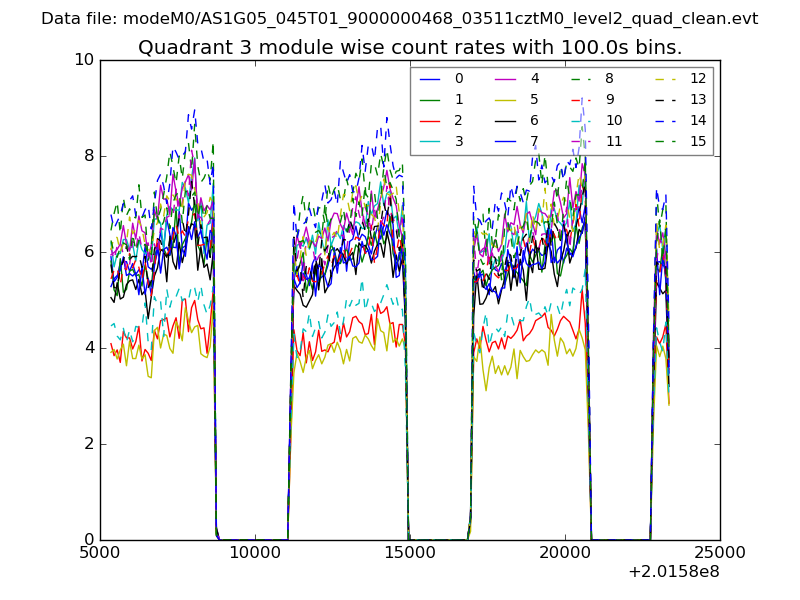 |
 |
| Parameter | Plot |
|---|---|
| CZT HV Monitor | 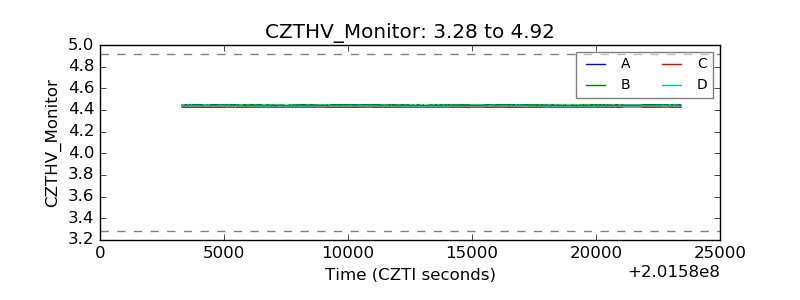 |
| D_VDD |  |
| Temperature 1 | 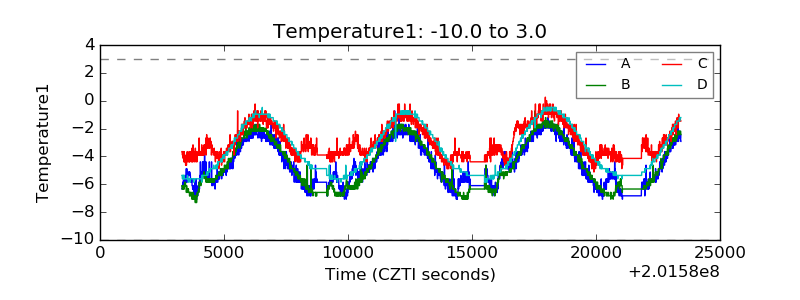 |
| Veto HV Monitor | 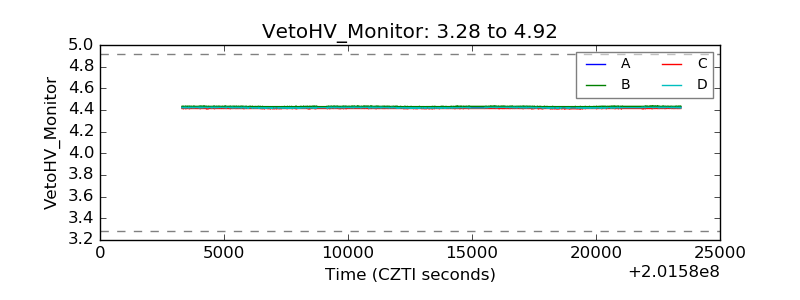 |
| Veto LLD | 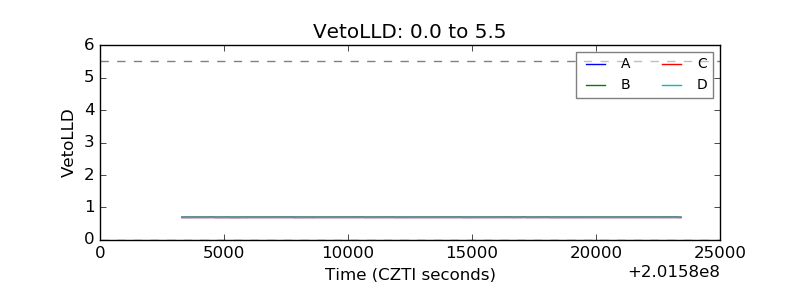 |
| Alpha Counter | 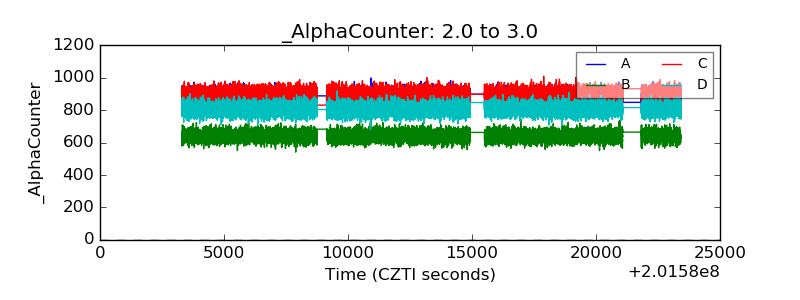 |
| _CPM_Rate | 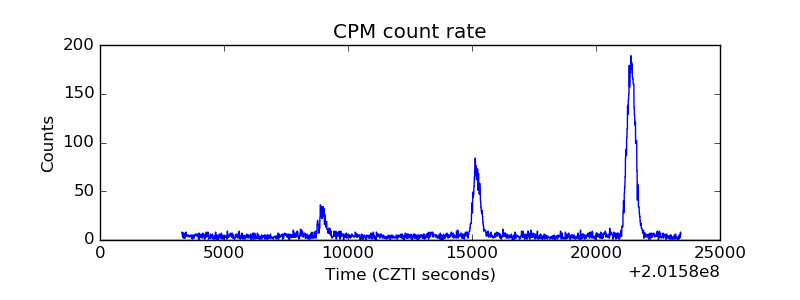 |
| CZT Counter | 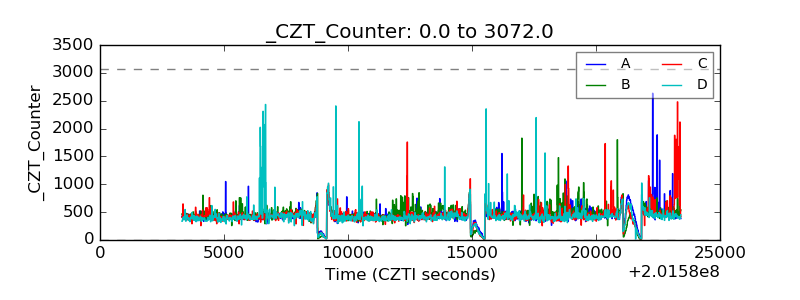 |
| +2.5 Volts monitor |  |
| +5 Volts monitor |  |
| Veto Counter | 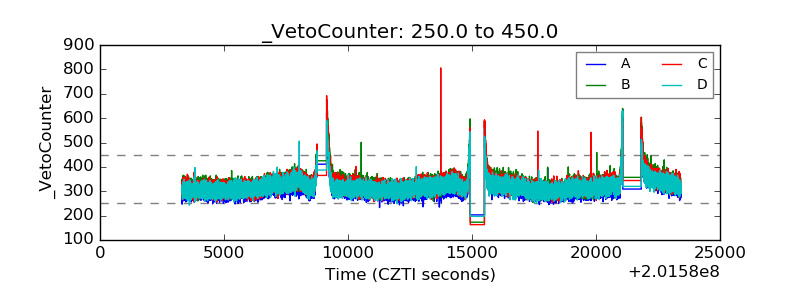 |