| Param | Original file | Final file |
|---|---|---|
| Filename | modeM0/AS1G05_045T01_9000000468_03512cztM0_level2.evt | modeM0/AS1G05_045T01_9000000468_03512cztM0_level2_quad_clean.evt |
| Size (bytes) | 425,344,320 | 84,142,080 |
| Size | 405.6 MB | 80.2 MB |
| Events in quadrant A | 3,325,761 | 531,266 |
| Events in quadrant B | 3,324,470 | 536,833 |
| Events in quadrant C | 3,077,924 | 526,772 |
| Events in quadrant D | 2,722,796 | 511,294 |
| Mode M0 | |||
|---|---|---|---|
| Quadrant | BADHDUFLAG | Total packets | Discarded packets |
| A | 0 | 14381 | 2 |
| B | 0 | 14018 | 1 |
| C | 0 | 13701 | 1 |
| D | 0 | 12966 | 1 |
| Mode M9 | |||
|---|---|---|---|
| Quadrant | BADHDUFLAG | Total packets | Discarded packets |
| A | 0 | 10 | 0 |
| B | 0 | 10 | 0 |
| C | 0 | 10 | 0 |
| D | 0 | 10 | 0 |
| Mode SS | |||
|---|---|---|---|
| Quadrant | BADHDUFLAG | Total packets | Discarded packets |
| A | 0 | 126 | 0 |
| B | 0 | 126 | 0 |
| C | 0 | 126 | 0 |
| D | 0 | 126 | 0 |
| Quadrant | Total seconds | Saturated seconds | Saturation percentage |
|---|---|---|---|
| A | 6342 | 147 | 2.317881% |
| B | 6342 | 47 | 0.741091% |
| C | 6342 | 75 | 1.182592% |
| D | 6342 | 50 | 0.788395% |
Noise dominated data is calculated using 1-second bins in cleaned event files. If a bin has >2000 counts, and if more than 50% of those come from <1% of pixels, then it is considered to be noise-dominated and hence unusable.
| Quadrant | # 1 sec bins | Bins with >0 counts | Bins with >2000 counts | High rate bins dominated by noise | Noise dominated (total time) | Noise dominated (detector-on time) | Marked lightcurve |
|---|---|---|---|---|---|---|---|
| A | 7287 | 6342 | 39 | 39 | 0.54% | 0.61% | 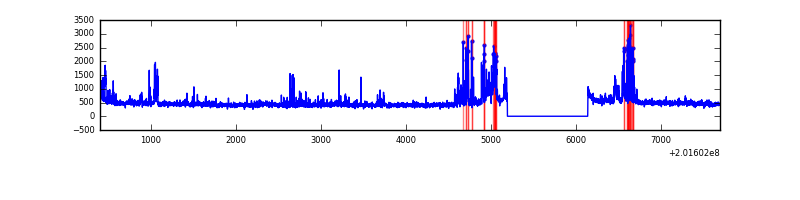 |
| B | 7287 | 6342 | 3 | 3 | 0.04% | 0.05% | 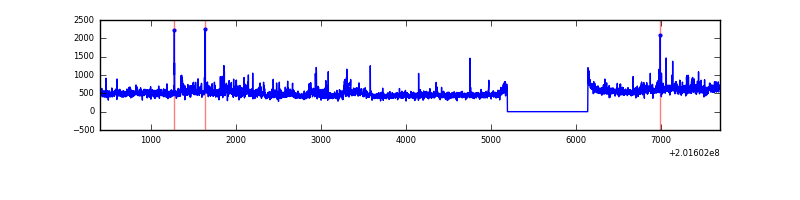 |
| C | 7287 | 6342 | 42 | 42 | 0.58% | 0.66% | 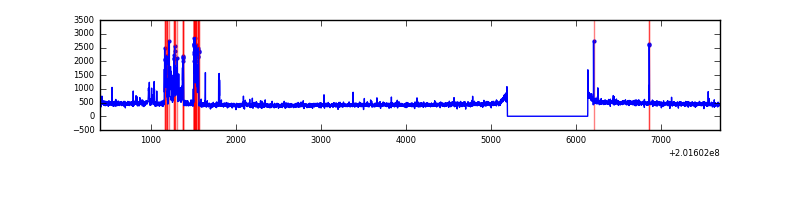 |
| D | 7287 | 6342 | 8 | 8 | 0.11% | 0.13% | 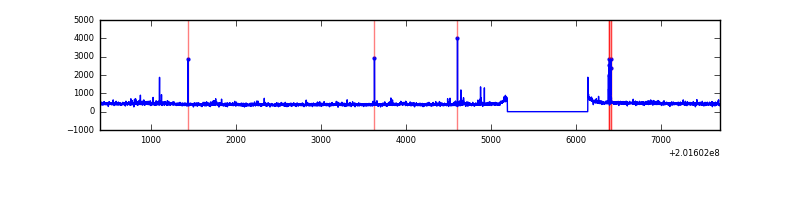 |
Top three noisy pixels from each quadrant. If the there are fewer than three noisy pixels in the level2.evt file, extra rows are filled as -1
| Pixel properties | Quadrant properties | ||||||
|---|---|---|---|---|---|---|---|
| Quadrant | DetID | PixID | Counts | Sigma | Mean | Median | Sigma |
| A | 0 | 50 | 433473 | 2940.28 | 713 | 696 | 147.2 |
| A | 8 | 15 | 104107 | 702.57 | 713 | 696 | 147.2 |
| A | 15 | 236 | 30325 | 201.3 | 713 | 696 | 147.2 |
| B | 15 | 204 | 345726 | 2427.47 | 724 | 706 | 142.1 |
| B | 4 | 170 | 51251 | 355.62 | 724 | 706 | 142.1 |
| B | 4 | 81 | 33217 | 228.74 | 724 | 706 | 142.1 |
| C | 1 | 192 | 295497 | 1811.02 | 693 | 696 | 162.8 |
| C | 1 | 16 | 38594 | 232.82 | 693 | 696 | 162.8 |
| C | 8 | 128 | 17408 | 102.67 | 693 | 696 | 162.8 |
| D | 7 | 39 | 26354 | 153.91 | 692 | 670 | 166.9 |
| D | 2 | 206 | 22928 | 133.38 | 692 | 670 | 166.9 |
| D | 5 | 233 | 22718 | 132.12 | 692 | 670 | 166.9 |
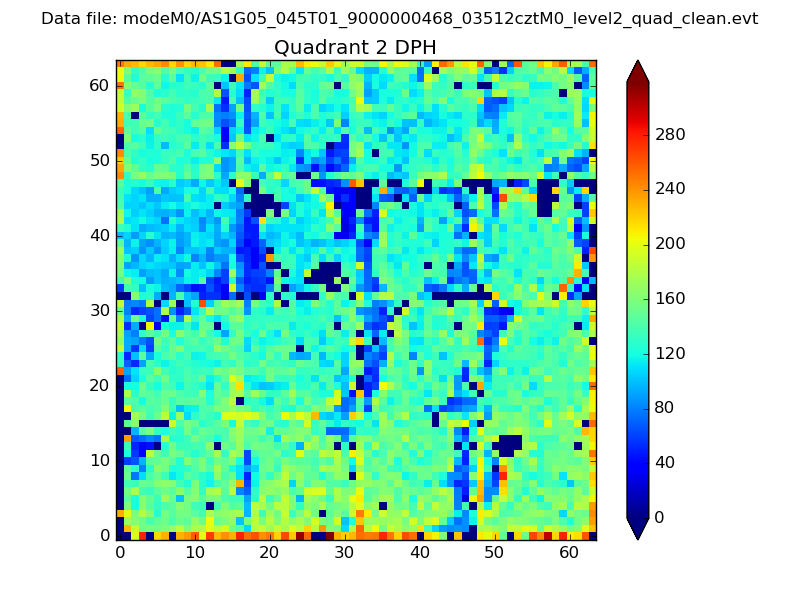
Histogram calculated using DETX and DETY for each event in the final _common_clean file
| Quadrant A | 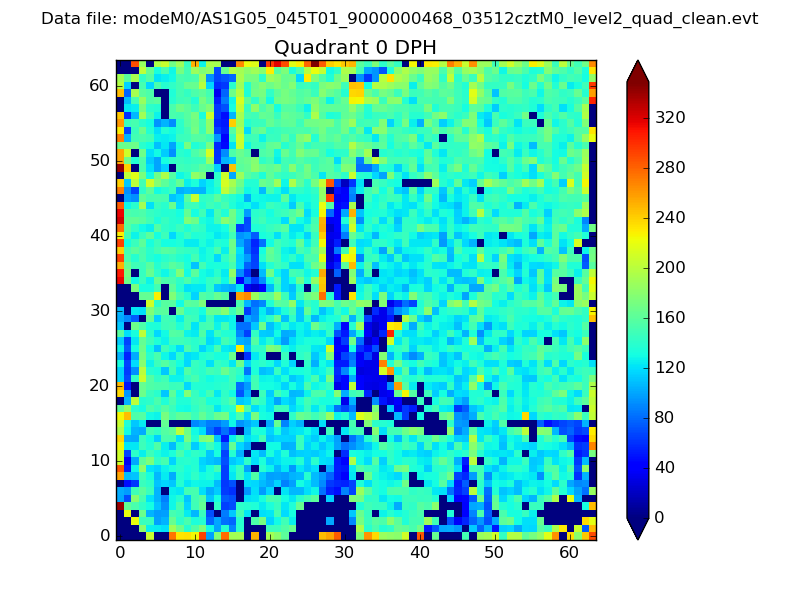 |
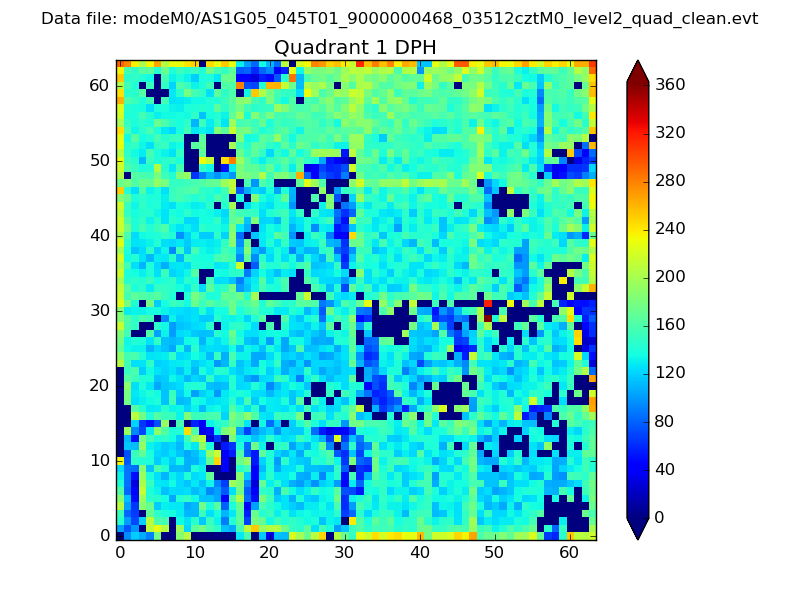 |
Quadrant B |
|---|---|---|---|
| Quadrant D | 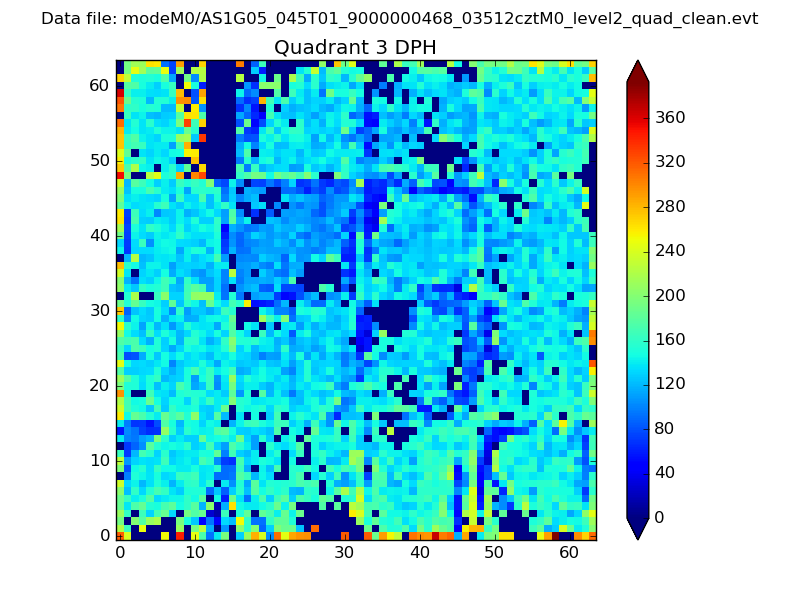 |
 |
Quadrant C |
| Plot type | Count rate plots | Images |
|---|---|---|
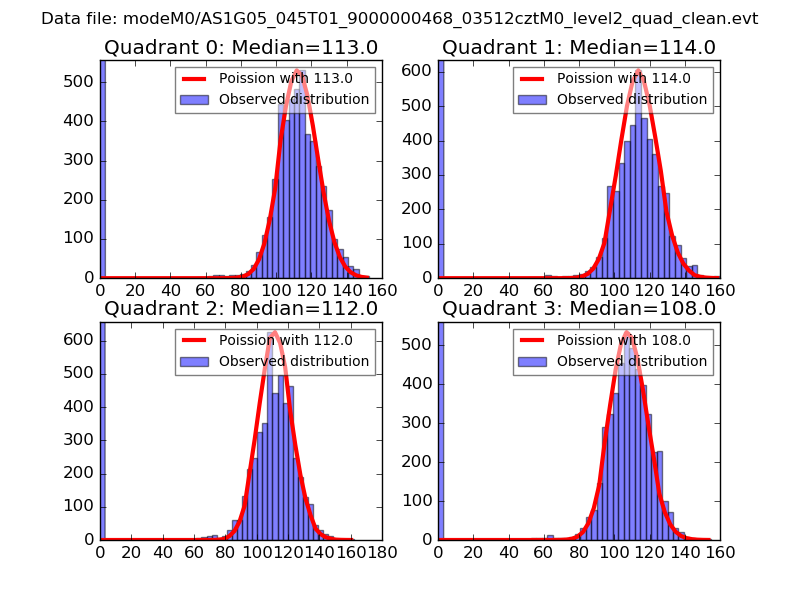
| Comparison with Poisson distribution Blue bars denote a histogram of data divided into 1 sec bins. Red curve is a Poisson curve with rate = median count rate of data. |
 |
 |
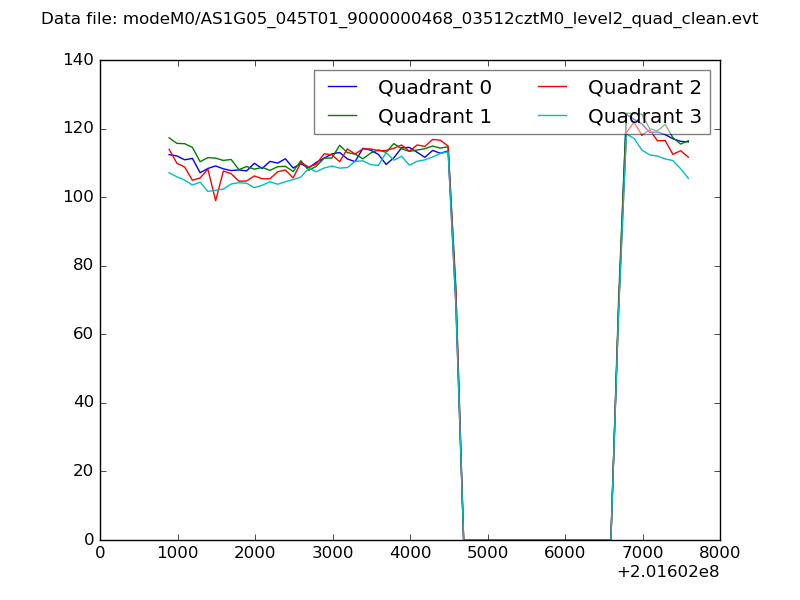
| Quadrant-wise count rates Data is divided into 100 sec bins |
 |
|
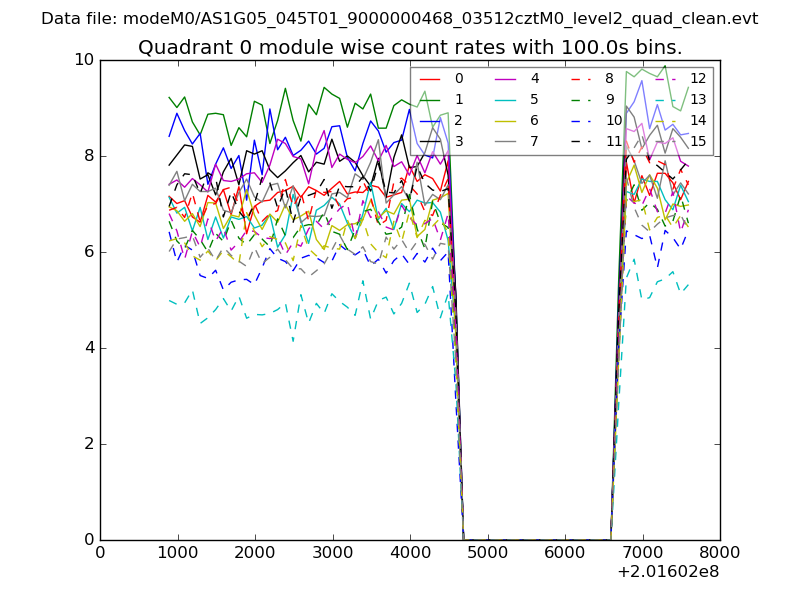
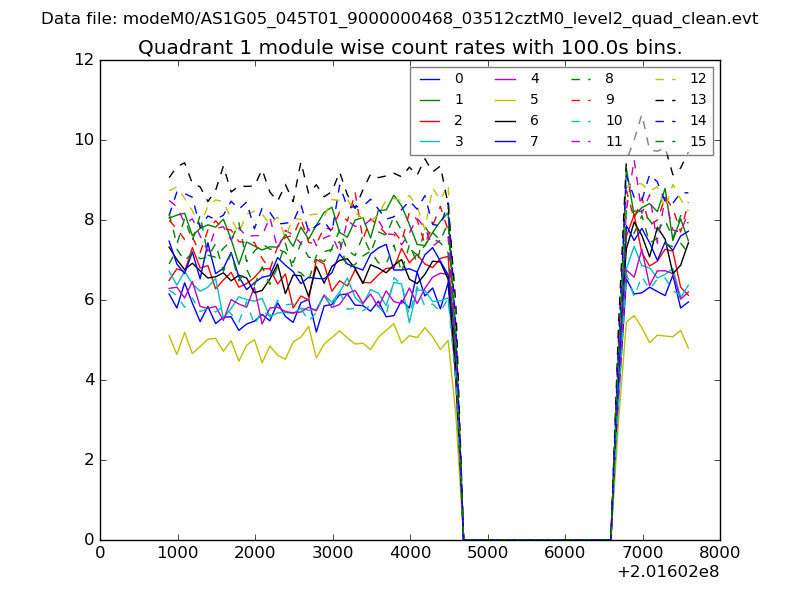
| Module-wise count rates for Quadrant A Data is divided into 100 sec bins |
 |
 |
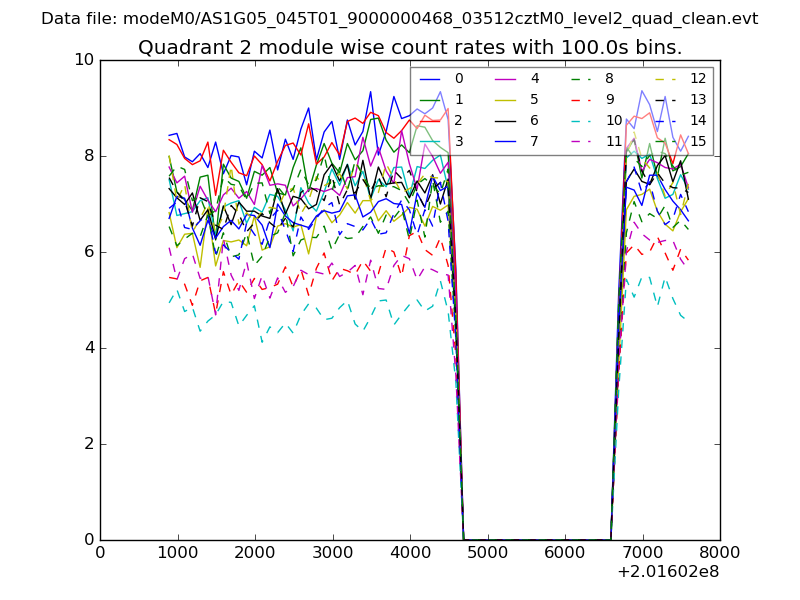
| Module-wise count rates for Quadrant B Data is divided into 100 sec bins |
 |
 |
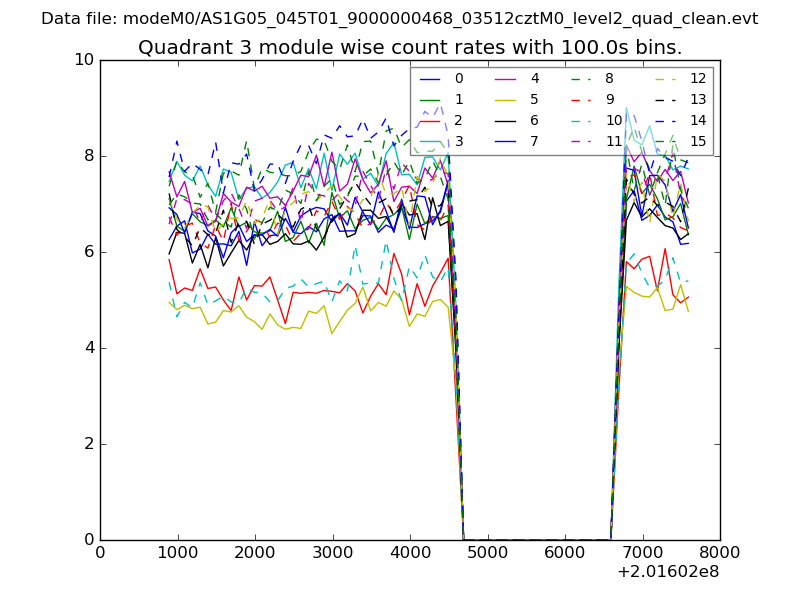
| Module-wise count rates for Quadrant C Data is divided into 100 sec bins |
 |
 |
| Module-wise count rates for Quadrant D Data is divided into 100 sec bins |
 |
 |
| Parameter | Plot |
|---|---|
| CZT HV Monitor | 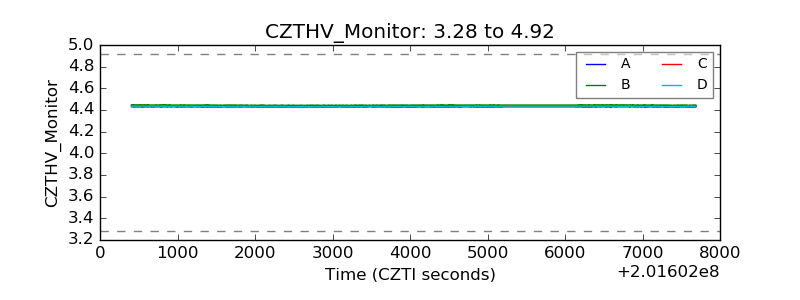 |
| D_VDD | 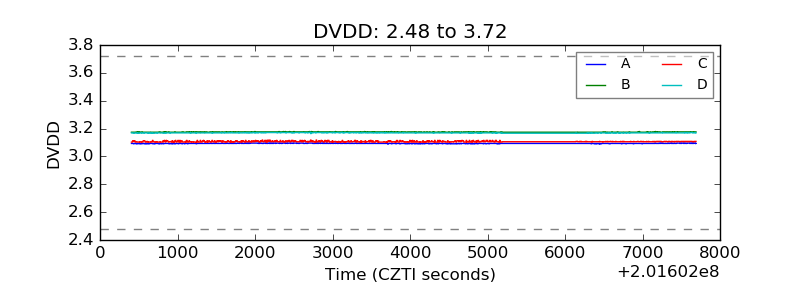 |
| Temperature 1 | 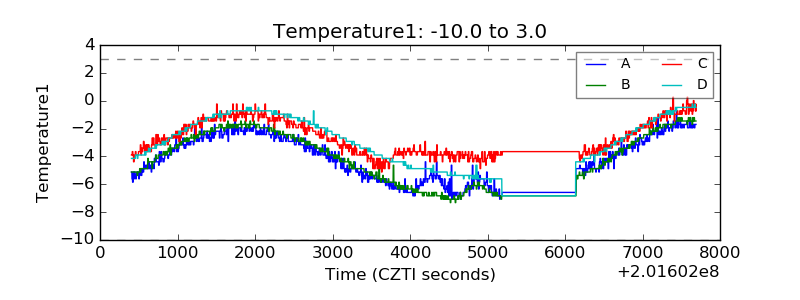 |
| Veto HV Monitor | 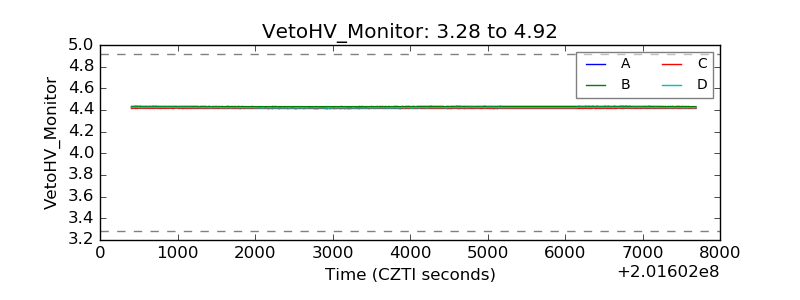 |
| Veto LLD | 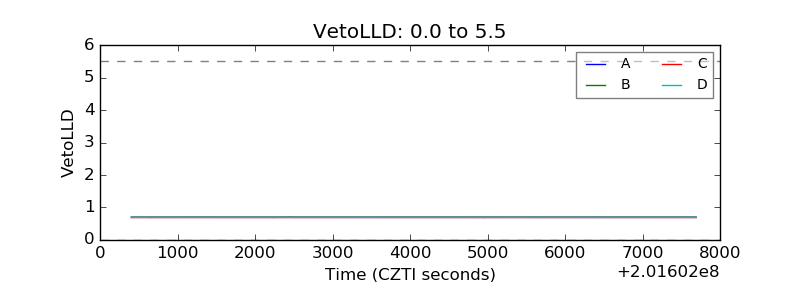 |
| Alpha Counter | 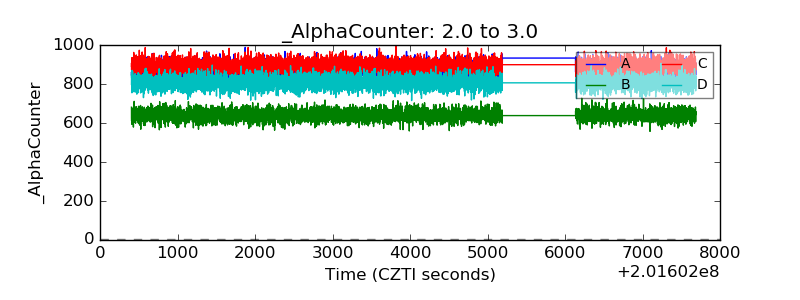 |
| _CPM_Rate | 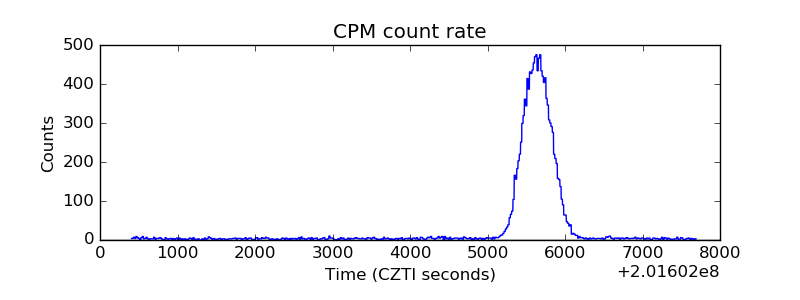 |
| CZT Counter | 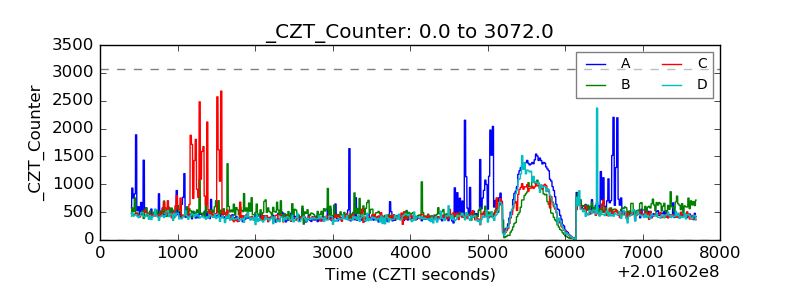 |
| +2.5 Volts monitor |  |
| +5 Volts monitor |  |
| _ROLL_ROT | 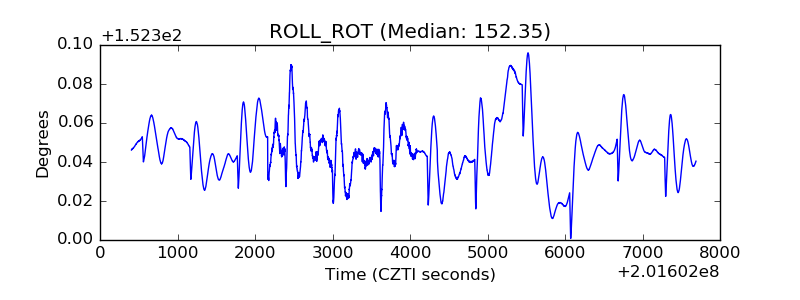 |
| _Roll_DEC | 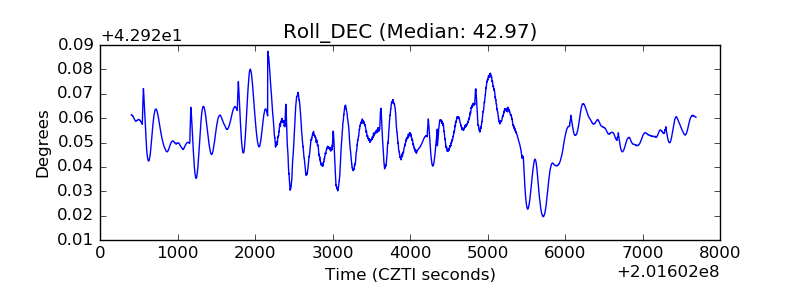 |
| _Roll_RA | 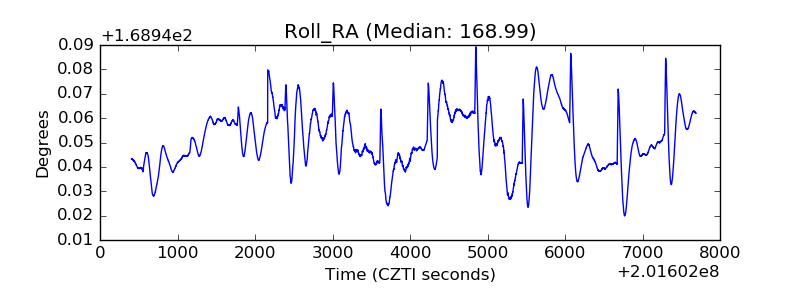 |
| Veto Counter | 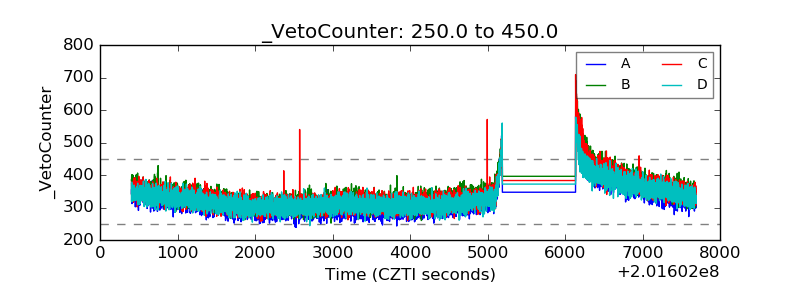 |