| Param | Original file | Final file |
|---|---|---|
| Filename | modeM0/AS1G05_045T01_9000000468_03514cztM0_level2.evt | modeM0/AS1G05_045T01_9000000468_03514cztM0_level2_quad_clean.evt |
| Size (bytes) | 456,912,000 | 95,549,760 |
| Size | 435.7 MB | 91.1 MB |
| Events in quadrant A | 3,344,287 | 613,581 |
| Events in quadrant B | 3,847,764 | 615,910 |
| Events in quadrant C | 3,136,670 | 604,865 |
| Events in quadrant D | 3,049,983 | 588,656 |
| Mode M0 | |||
|---|---|---|---|
| Quadrant | BADHDUFLAG | Total packets | Discarded packets |
| A | 0 | 14722 | 3 |
| B | 0 | 15994 | 2 |
| C | 0 | 14047 | 2 |
| D | 0 | 14096 | 2 |
| Mode M9 | |||
|---|---|---|---|
| Quadrant | BADHDUFLAG | Total packets | Discarded packets |
| A | 0 | 11 | 0 |
| B | 0 | 11 | 0 |
| C | 0 | 11 | 0 |
| D | 0 | 11 | 0 |
| Mode SS | |||
|---|---|---|---|
| Quadrant | BADHDUFLAG | Total packets | Discarded packets |
| A | 0 | 136 | 0 |
| B | 0 | 136 | 0 |
| C | 0 | 136 | 0 |
| D | 0 | 136 | 0 |
| Quadrant | Total seconds | Saturated seconds | Saturation percentage |
|---|---|---|---|
| A | 6755 | 148 | 2.190970% |
| B | 6755 | 88 | 1.302739% |
| C | 6755 | 71 | 1.051073% |
| D | 6756 | 70 | 1.036116% |
Noise dominated data is calculated using 1-second bins in cleaned event files. If a bin has >2000 counts, and if more than 50% of those come from <1% of pixels, then it is considered to be noise-dominated and hence unusable.
| Quadrant | # 1 sec bins | Bins with >0 counts | Bins with >2000 counts | High rate bins dominated by noise | Noise dominated (total time) | Noise dominated (detector-on time) | Marked lightcurve |
|---|---|---|---|---|---|---|---|
| A | 7820 | 6755 | 42 | 42 | 0.54% | 0.62% | 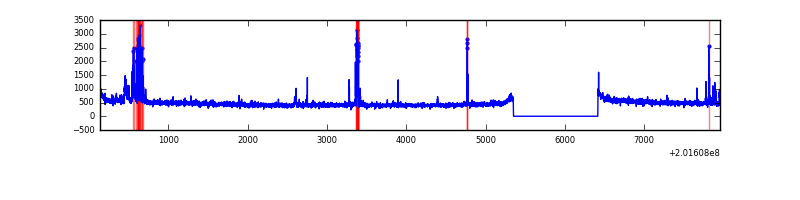 |
| B | 7820 | 6755 | 19 | 19 | 0.24% | 0.28% | 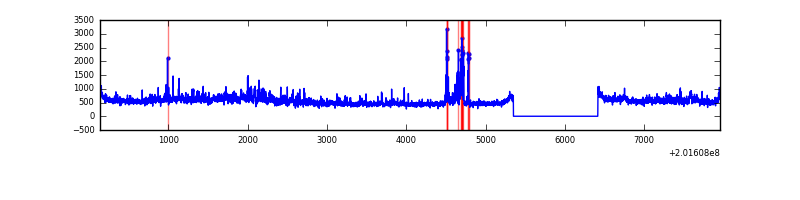 |
| C | 7820 | 6755 | 4 | 4 | 0.05% | 0.06% | 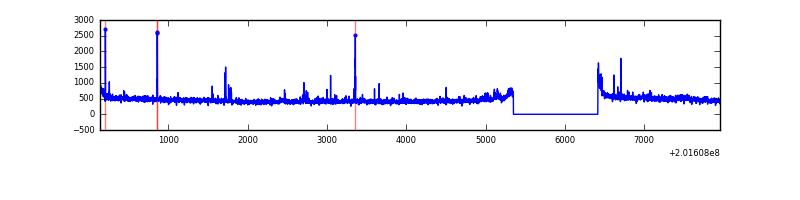 |
| D | 7821 | 6756 | 15 | 15 | 0.19% | 0.22% | 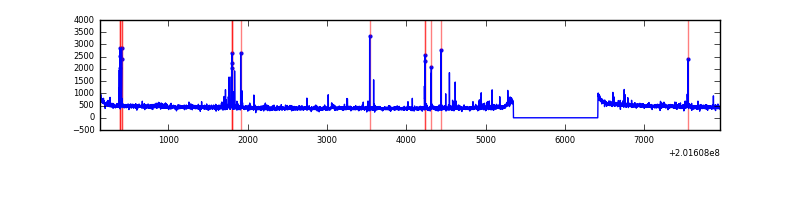 |
Top three noisy pixels from each quadrant. If the there are fewer than three noisy pixels in the level2.evt file, extra rows are filled as -1
| Pixel properties | Quadrant properties | ||||||
|---|---|---|---|---|---|---|---|
| Quadrant | DetID | PixID | Counts | Sigma | Mean | Median | Sigma |
| A | 0 | 50 | 231201 | 1429.43 | 788 | 770 | 161.2 |
| A | 7 | 16 | 34304 | 208.02 | 788 | 770 | 161.2 |
| A | 8 | 15 | 21910 | 131.14 | 788 | 770 | 161.2 |
| B | 15 | 204 | 446983 | 2880.28 | 795 | 775 | 154.9 |
| B | 4 | 81 | 155734 | 1000.26 | 795 | 775 | 154.9 |
| B | 4 | 170 | 87320 | 558.65 | 795 | 775 | 154.9 |
| C | 1 | 192 | 85768 | 475.43 | 764 | 767 | 178.8 |
| C | 1 | 16 | 53985 | 297.66 | 764 | 767 | 178.8 |
| C | 12 | 4 | 7281 | 36.43 | 764 | 767 | 178.8 |
| D | 13 | 223 | 34253 | 180.77 | 766 | 744 | 185.4 |
| D | 7 | 39 | 26712 | 140.09 | 766 | 744 | 185.4 |
| D | 5 | 233 | 19695 | 102.24 | 766 | 744 | 185.4 |
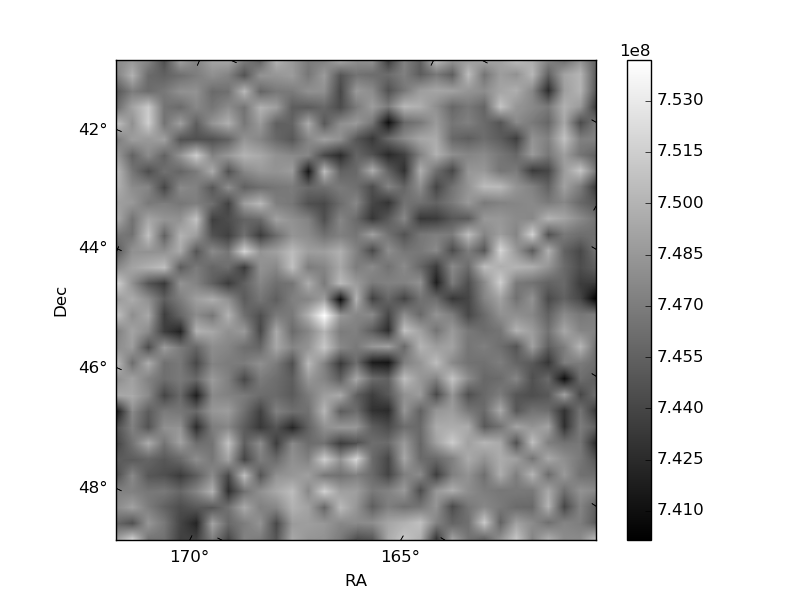
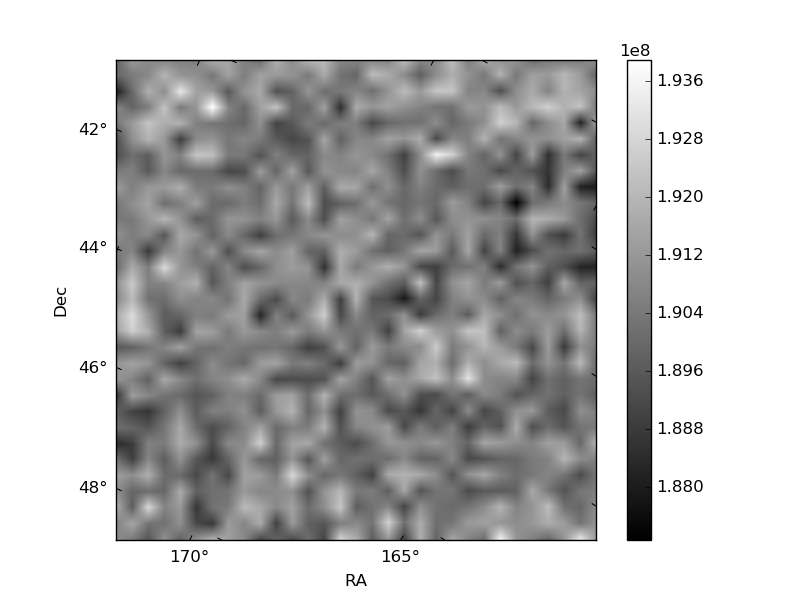
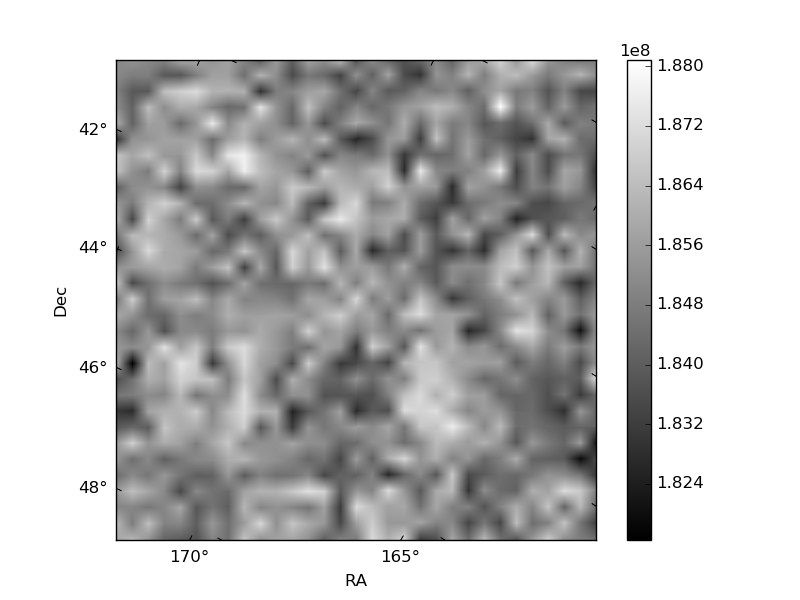
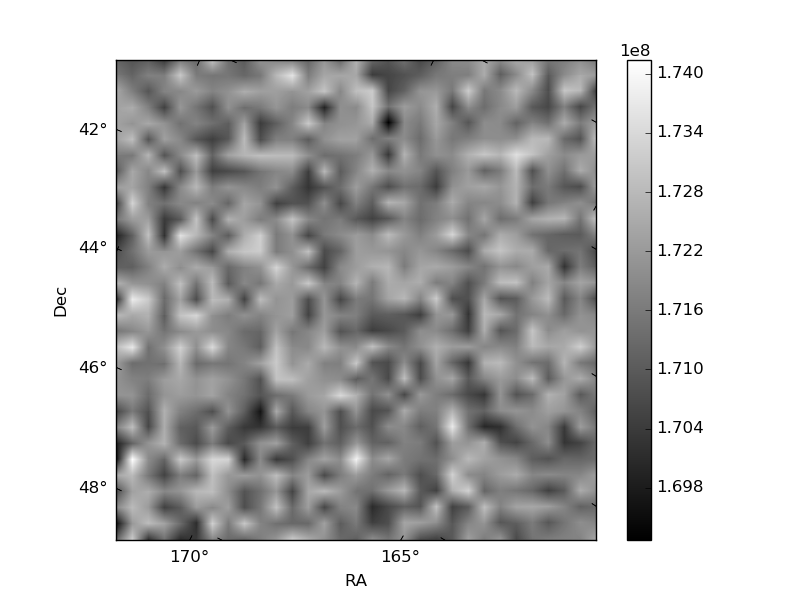
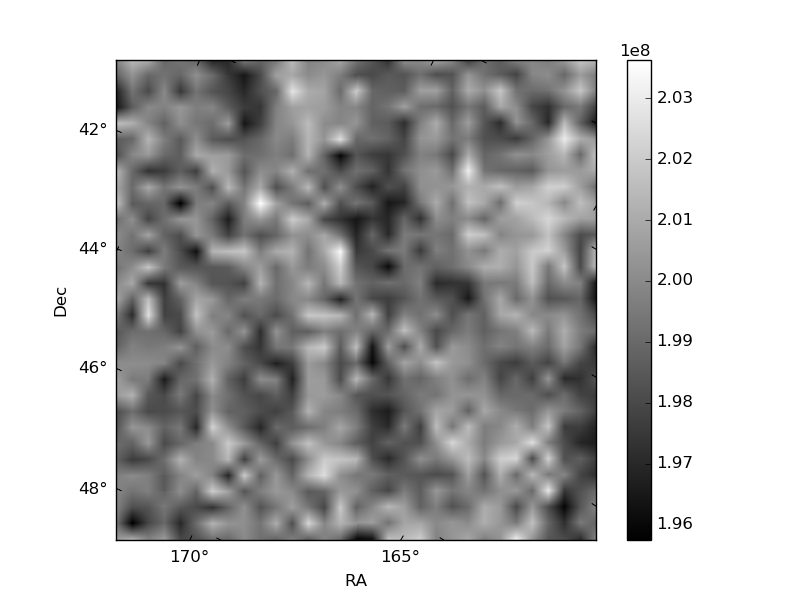
Histogram calculated using DETX and DETY for each event in the final _common_clean file
| Quadrant A | 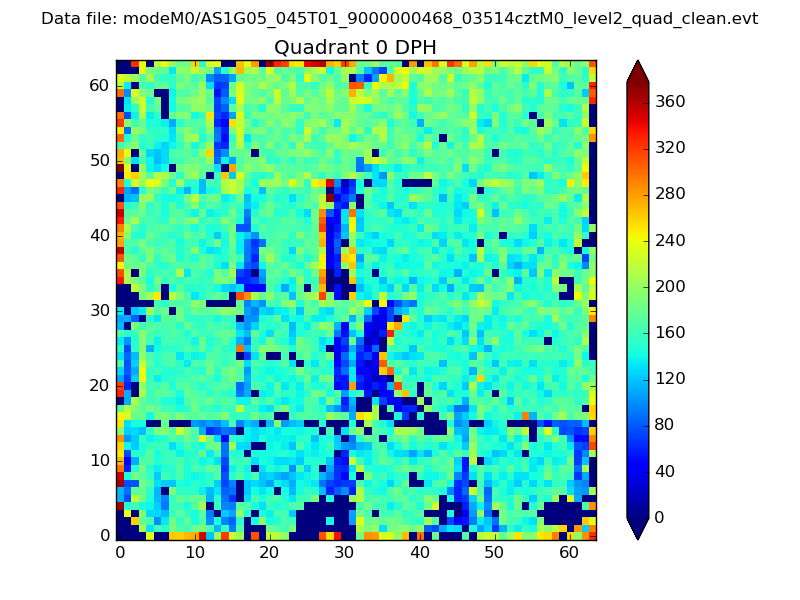 |
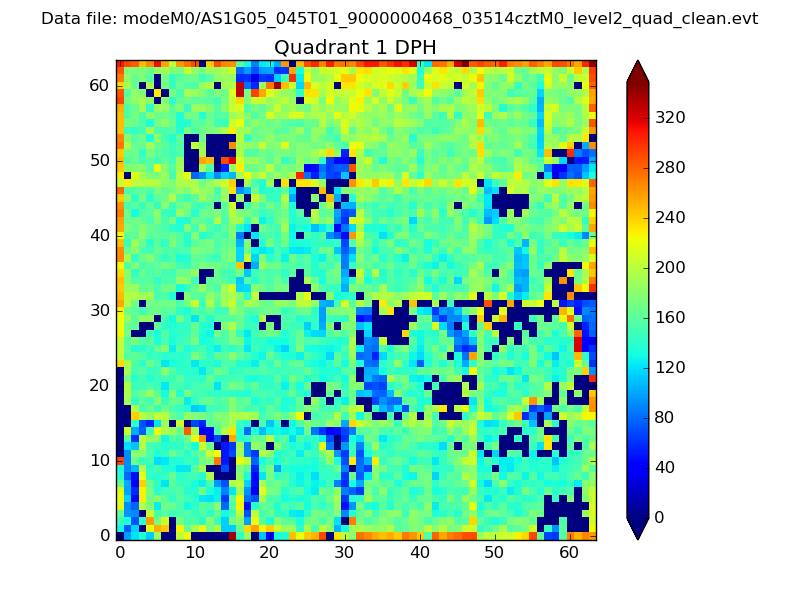 |
Quadrant B |
|---|---|---|---|
| Quadrant D | 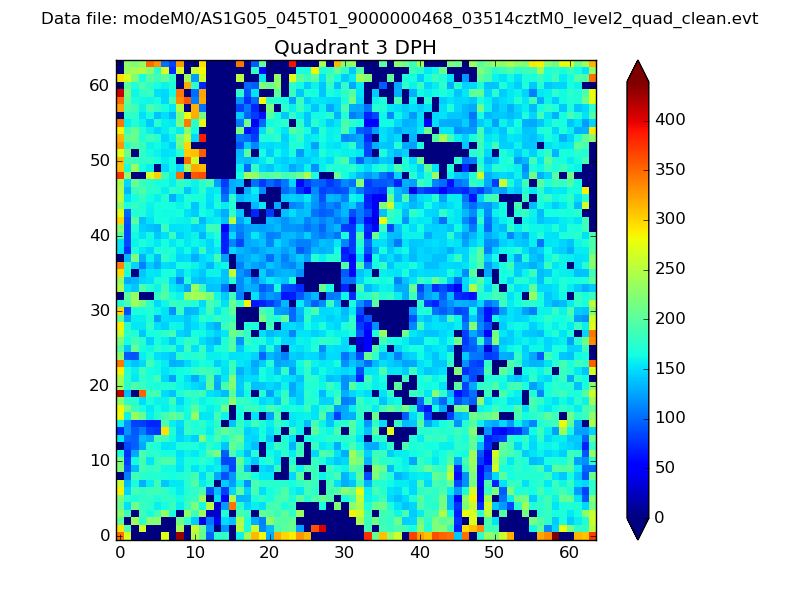 |
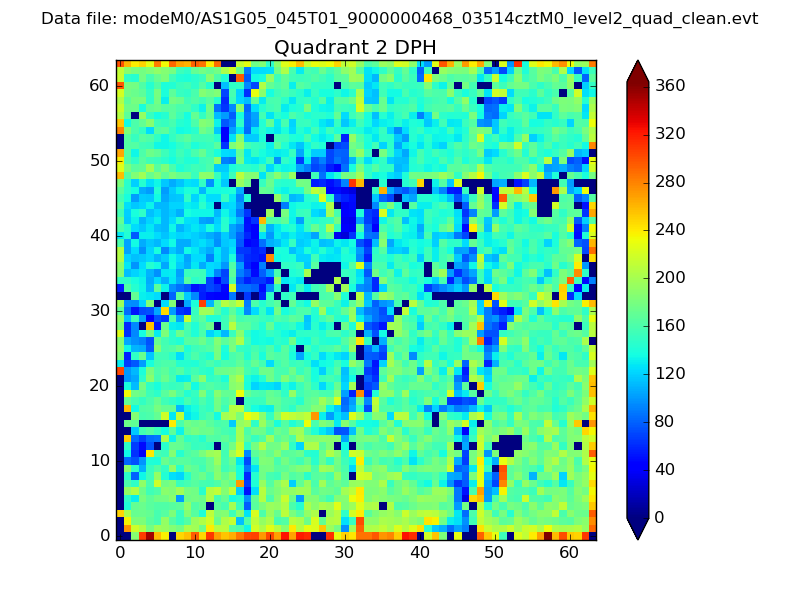 |
Quadrant C |
| Plot type | Count rate plots | Images |
|---|---|---|
| Comparison with Poisson distribution Blue bars denote a histogram of data divided into 1 sec bins. Red curve is a Poisson curve with rate = median count rate of data. |
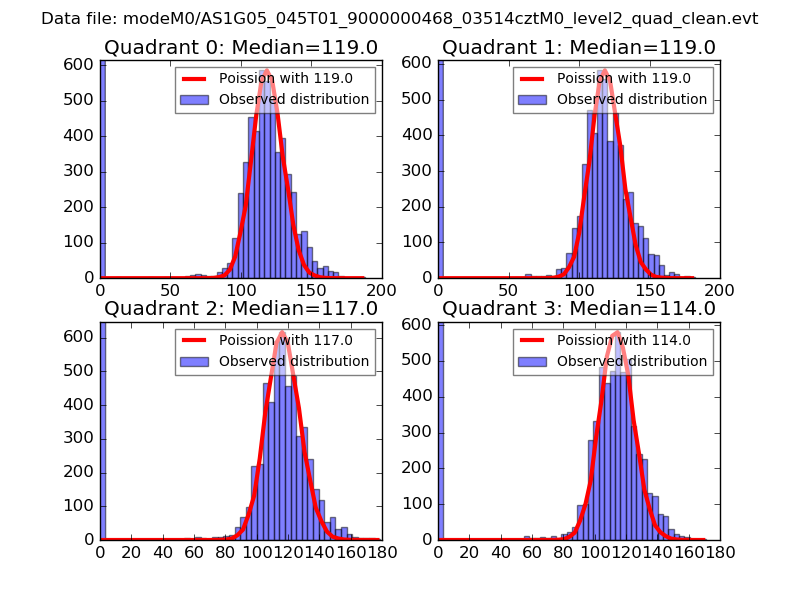 |
 |
| Quadrant-wise count rates Data is divided into 100 sec bins |
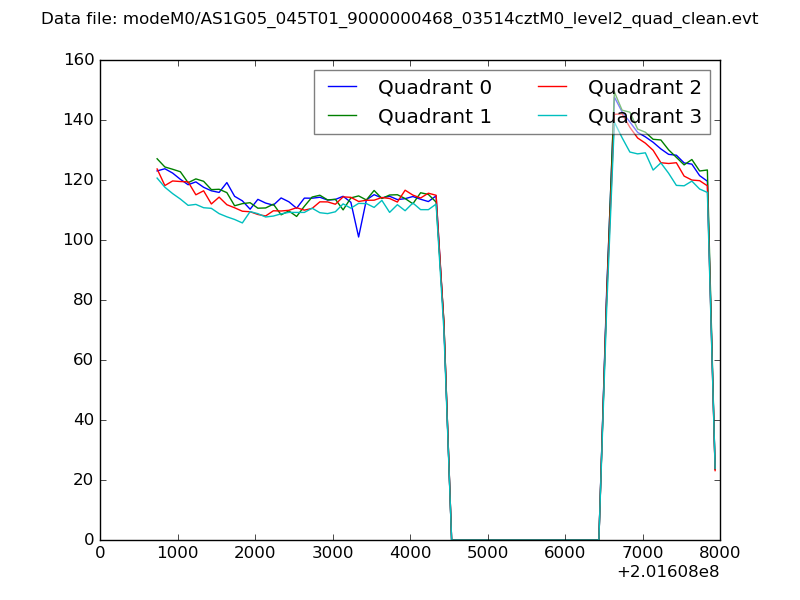 |
|
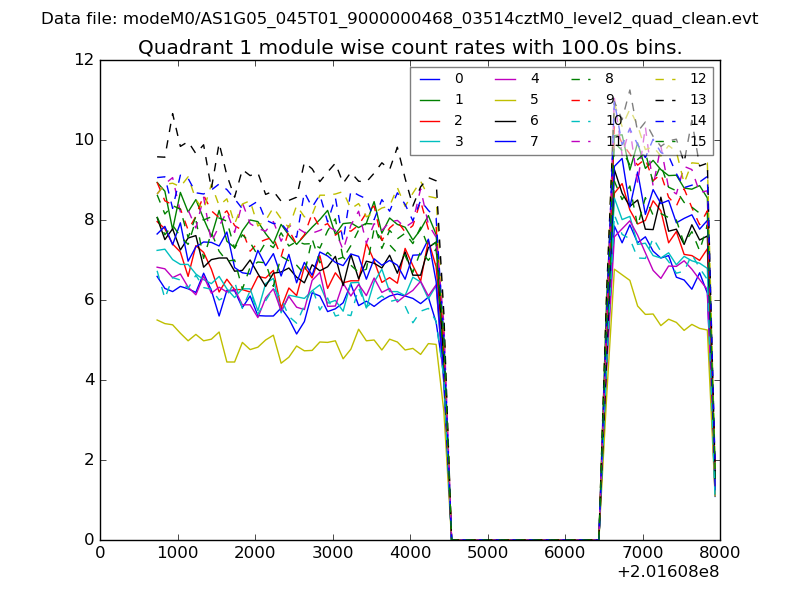
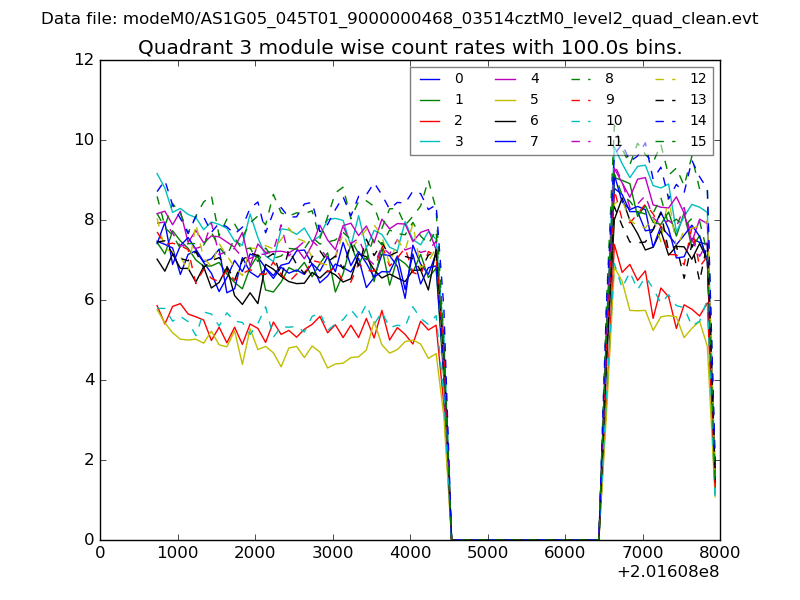
| Module-wise count rates for Quadrant A Data is divided into 100 sec bins |
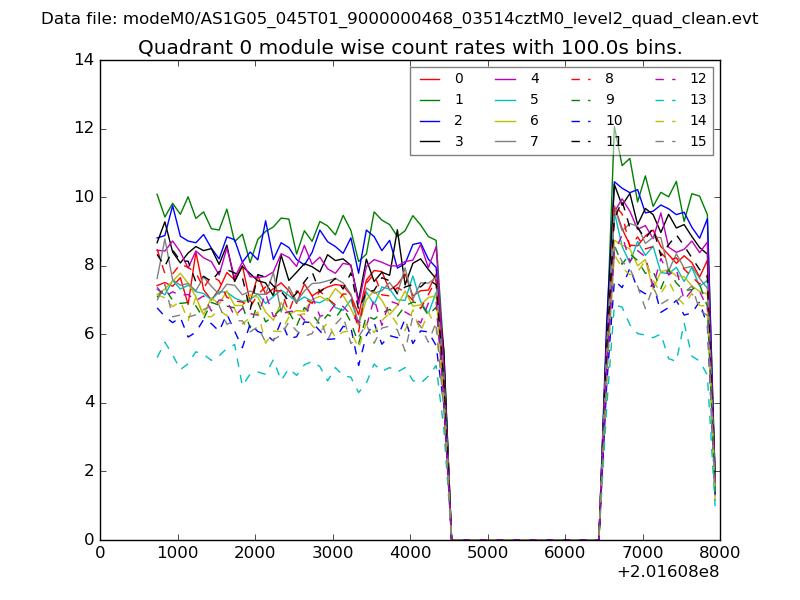 |
 |
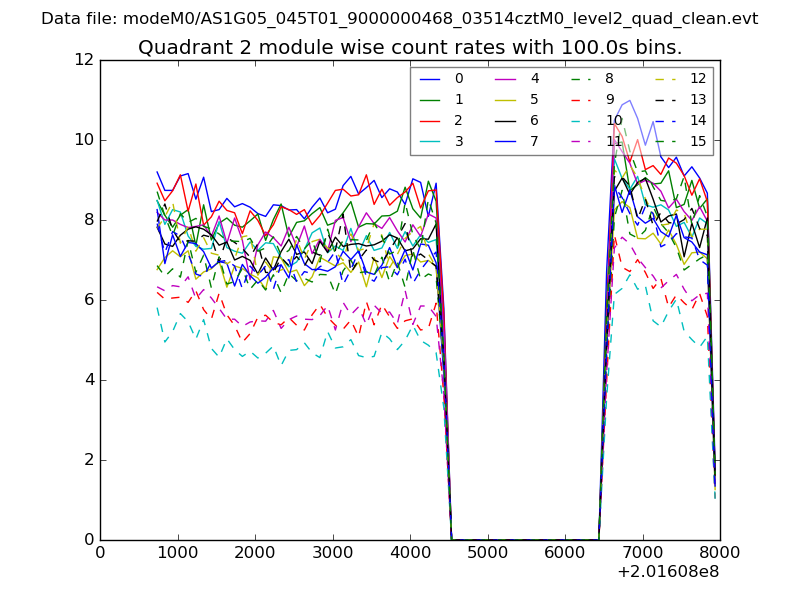
| Module-wise count rates for Quadrant B Data is divided into 100 sec bins |
 |
 |
| Module-wise count rates for Quadrant C Data is divided into 100 sec bins |
 |
 |
| Module-wise count rates for Quadrant D Data is divided into 100 sec bins |
 |
 |
| Parameter | Plot |
|---|---|
| CZT HV Monitor | 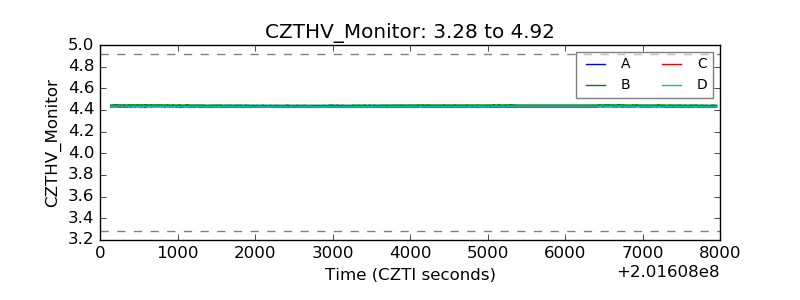 |
| D_VDD | 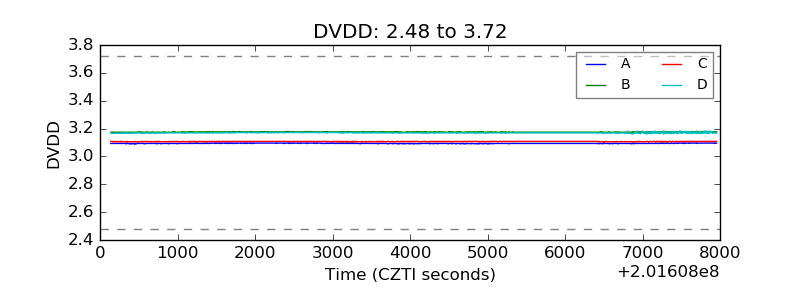 |
| Temperature 1 | 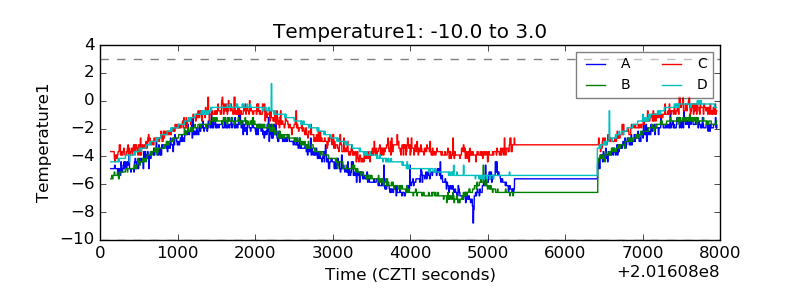 |
| Veto HV Monitor | 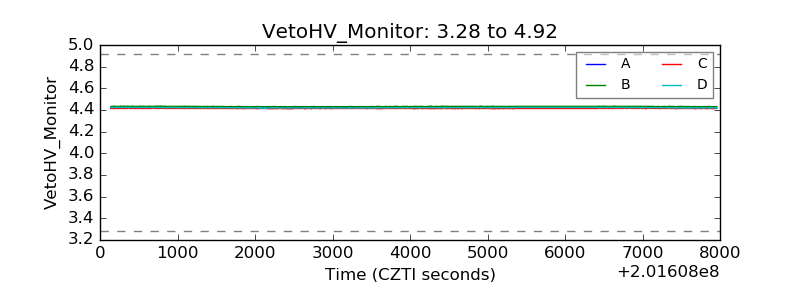 |
| Veto LLD |  |
| Alpha Counter | 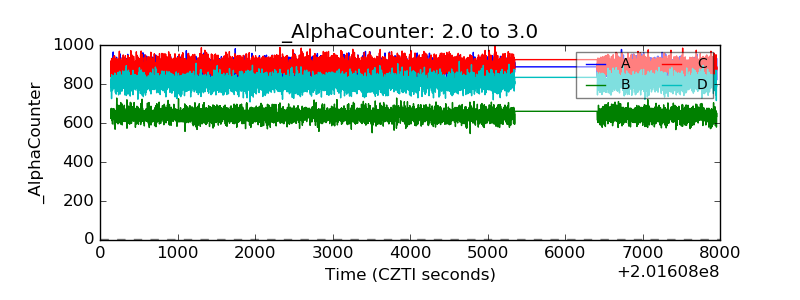 |
| _CPM_Rate | 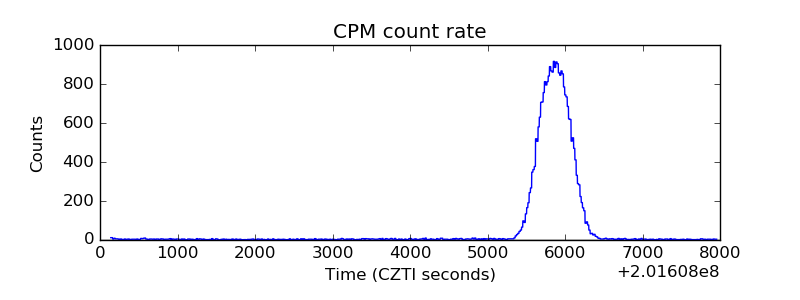 |
| CZT Counter | 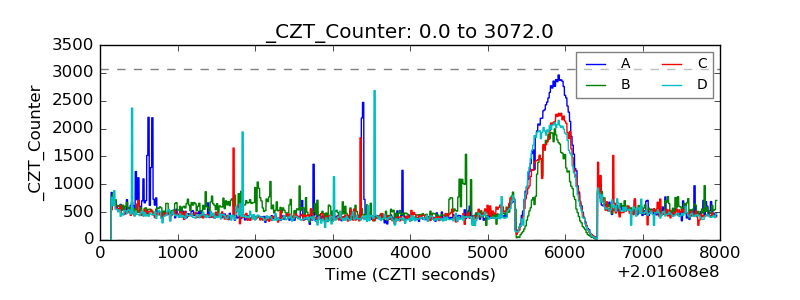 |
| +2.5 Volts monitor |  |
| +5 Volts monitor |  |
| _ROLL_ROT | 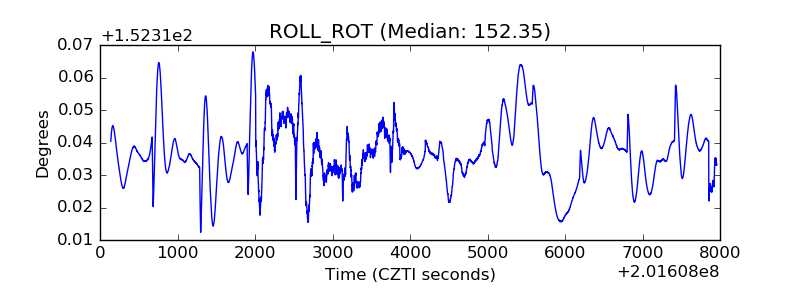 |
| _Roll_DEC | 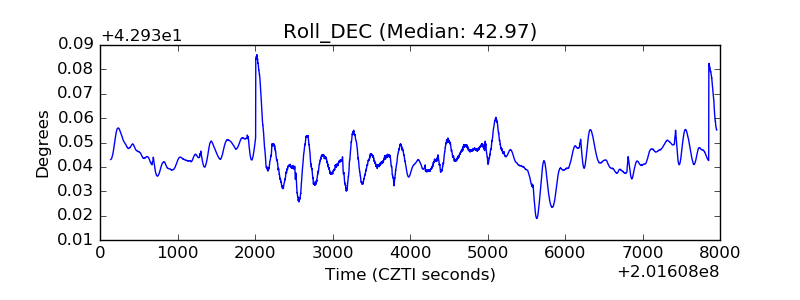 |
| _Roll_RA | 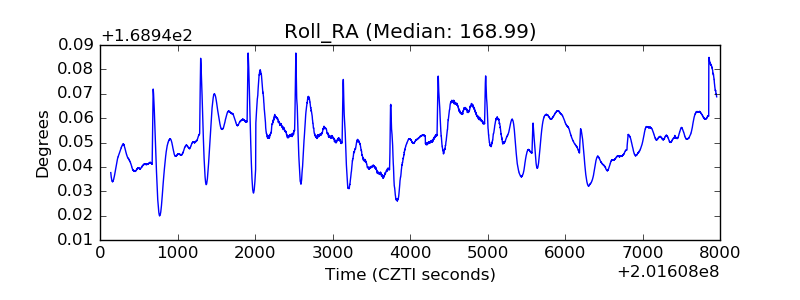 |
| Veto Counter | 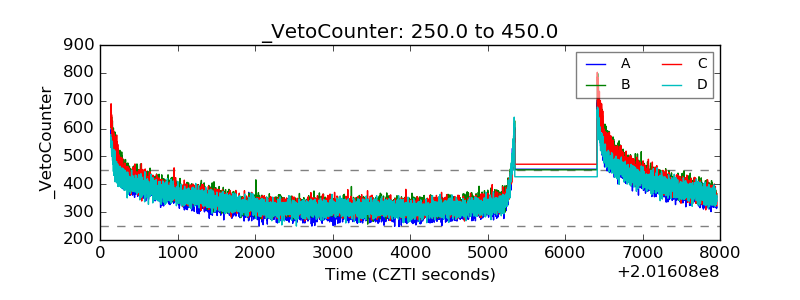 |