| Param | Original file | Final file |
|---|---|---|
| Filename | modeM0/AS1G05_045T01_9000000468_03517cztM0_level2.evt | modeM0/AS1G05_045T01_9000000468_03517cztM0_level2_quad_clean.evt |
| Size (bytes) | 435,804,480 | 89,925,120 |
| Size | 415.6 MB | 85.8 MB |
| Events in quadrant A | 3,065,148 | 579,684 |
| Events in quadrant B | 3,576,344 | 582,250 |
| Events in quadrant C | 3,276,614 | 572,833 |
| Events in quadrant D | 2,861,498 | 558,235 |
| Mode M0 | |||
|---|---|---|---|
| Quadrant | BADHDUFLAG | Total packets | Discarded packets |
| A | 0 | 13307 | 3 |
| B | 0 | 14920 | 2 |
| C | 0 | 13987 | 2 |
| D | 0 | 13003 | 2 |
| Mode M9 | |||
|---|---|---|---|
| Quadrant | BADHDUFLAG | Total packets | Discarded packets |
| A | 0 | 16 | 0 |
| B | 0 | 16 | 0 |
| C | 0 | 16 | 0 |
| D | 0 | 17 | 0 |
| Mode SS | |||
|---|---|---|---|
| Quadrant | BADHDUFLAG | Total packets | Discarded packets |
| A | 0 | 124 | 0 |
| B | 0 | 124 | 0 |
| C | 0 | 124 | 0 |
| D | 0 | 124 | 0 |
| Quadrant | Total seconds | Saturated seconds | Saturation percentage |
|---|---|---|---|
| A | 6168 | 88 | 1.426719% |
| B | 6168 | 61 | 0.988975% |
| C | 6168 | 108 | 1.750973% |
| D | 6168 | 51 | 0.826848% |
Noise dominated data is calculated using 1-second bins in cleaned event files. If a bin has >2000 counts, and if more than 50% of those come from <1% of pixels, then it is considered to be noise-dominated and hence unusable.
| Quadrant | # 1 sec bins | Bins with >0 counts | Bins with >2000 counts | High rate bins dominated by noise | Noise dominated (total time) | Noise dominated (detector-on time) | Marked lightcurve |
|---|---|---|---|---|---|---|---|
| A | 7488 | 6168 | 22 | 22 | 0.29% | 0.36% |  |
| B | 7488 | 6169 | 5 | 5 | 0.07% | 0.08% |  |
| C | 7488 | 6169 | 45 | 45 | 0.60% | 0.73% | 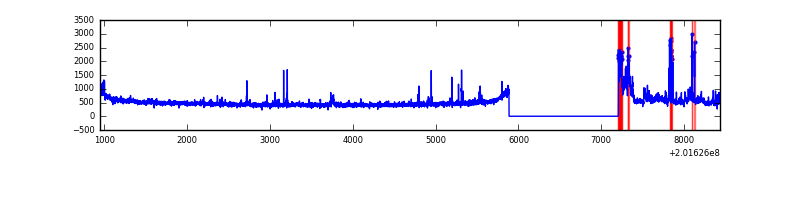 |
| D | 7488 | 6169 | 8 | 8 | 0.11% | 0.13% |  |
Top three noisy pixels from each quadrant. If the there are fewer than three noisy pixels in the level2.evt file, extra rows are filled as -1
| Pixel properties | Quadrant properties | ||||||
|---|---|---|---|---|---|---|---|
| Quadrant | DetID | PixID | Counts | Sigma | Mean | Median | Sigma |
| A | 0 | 50 | 125172 | 822.85 | 740 | 723 | 151.2 |
| A | 8 | 15 | 67525 | 441.69 | 740 | 723 | 151.2 |
| A | 0 | 118 | 9765 | 59.79 | 740 | 723 | 151.2 |
| B | 15 | 204 | 520488 | 3668.2 | 746 | 729 | 141.7 |
| B | 2 | 249 | 40224 | 278.74 | 746 | 729 | 141.7 |
| B | 15 | 85 | 35811 | 247.59 | 746 | 729 | 141.7 |
| C | 1 | 192 | 290965 | 1730.72 | 724 | 728 | 167.7 |
| C | 6 | 80 | 90930 | 537.89 | 724 | 728 | 167.7 |
| C | 1 | 16 | 30647 | 178.41 | 724 | 728 | 167.7 |
| D | 13 | 239 | 31233 | 175.67 | 723 | 701 | 173.8 |
| D | 2 | 37 | 29904 | 168.02 | 723 | 701 | 173.8 |
| D | 5 | 233 | 28141 | 157.88 | 723 | 701 | 173.8 |
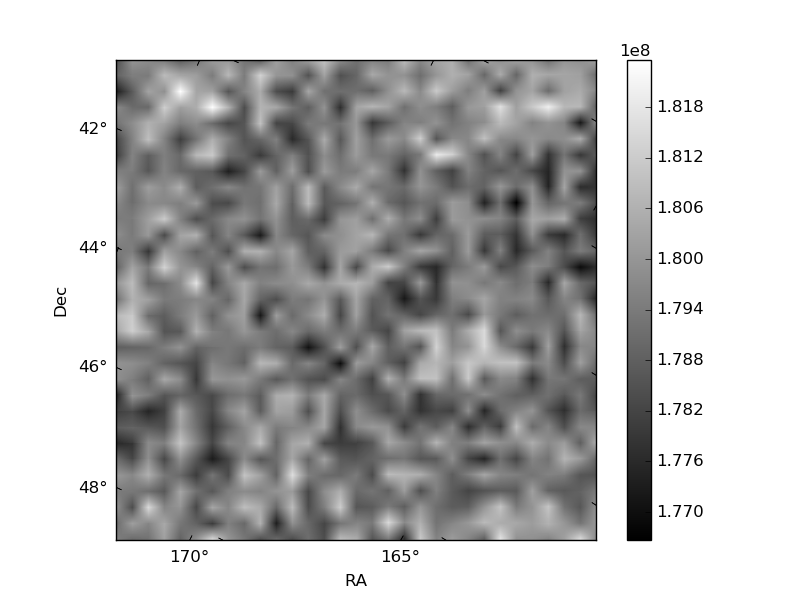
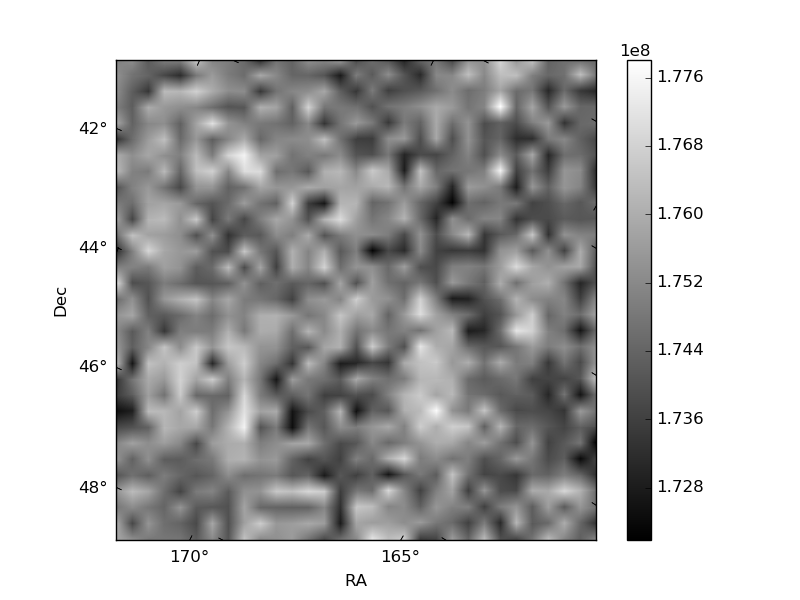
Histogram calculated using DETX and DETY for each event in the final _common_clean file
| Quadrant A | 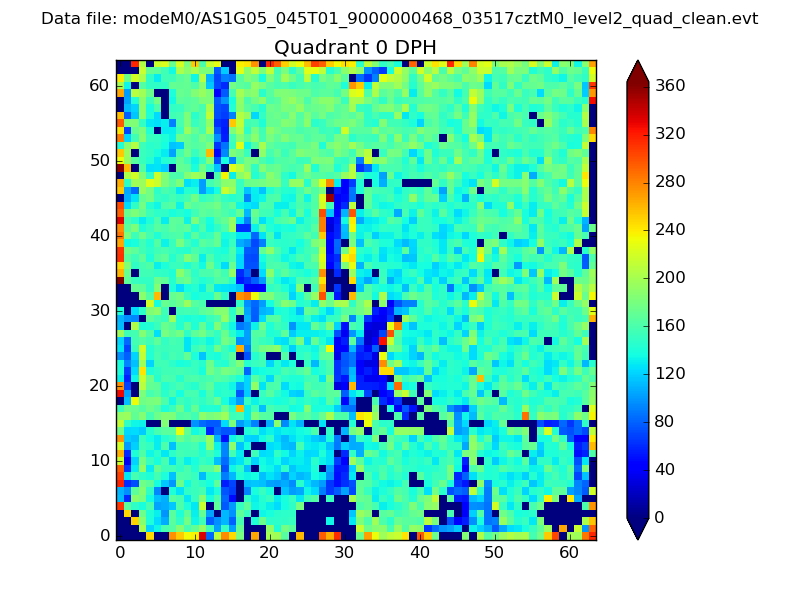 |
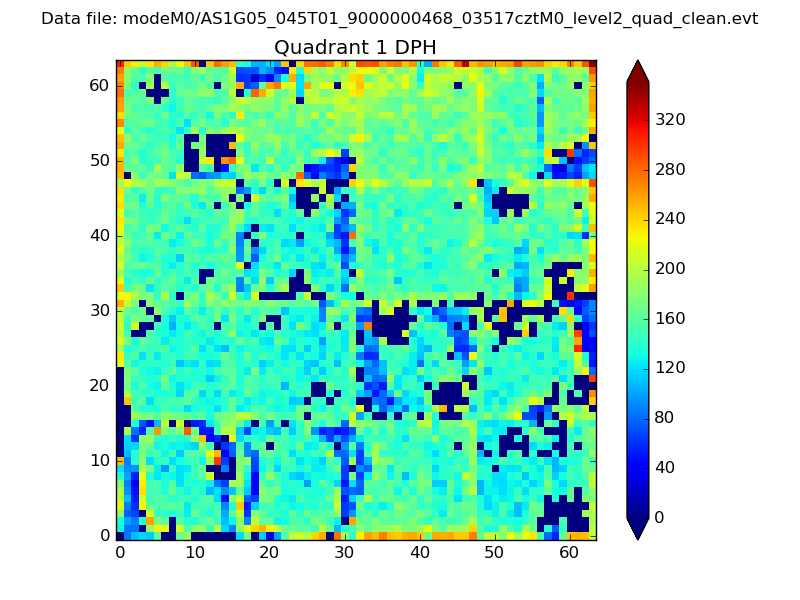 |
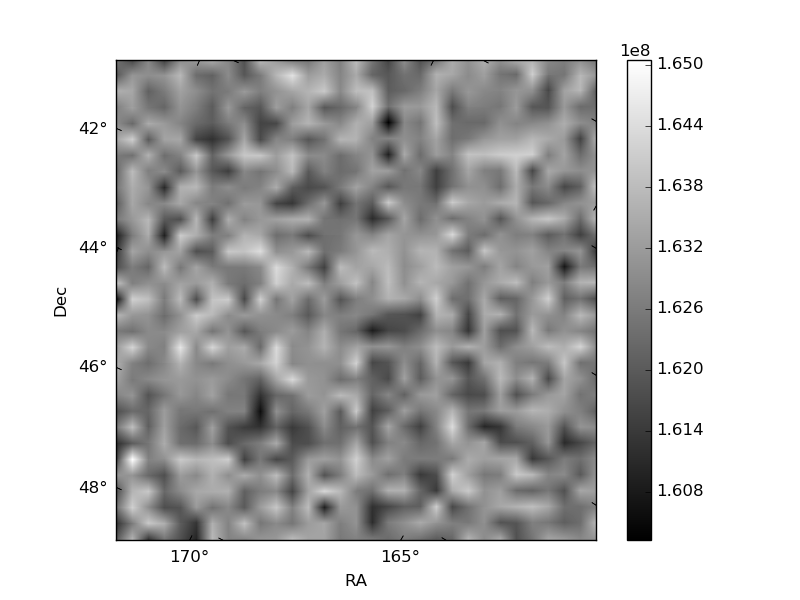
Quadrant B |
|---|---|---|---|
| Quadrant D | 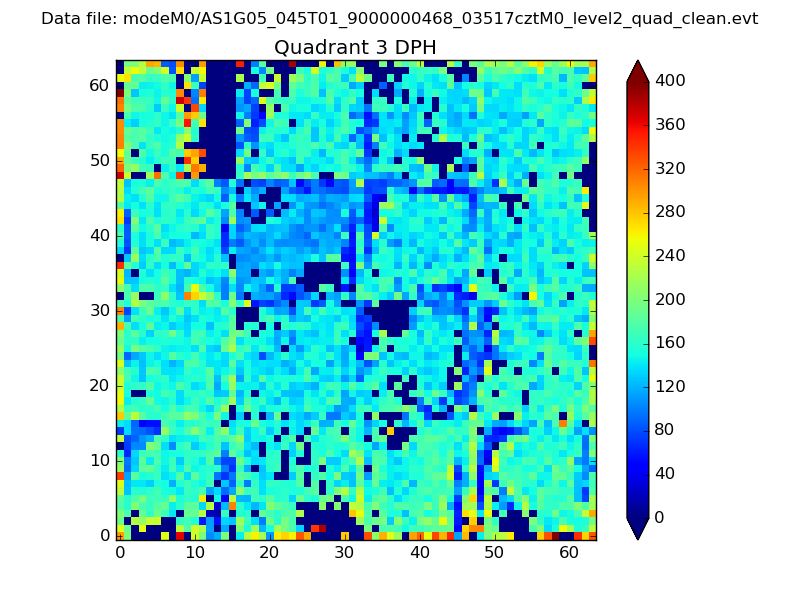 |
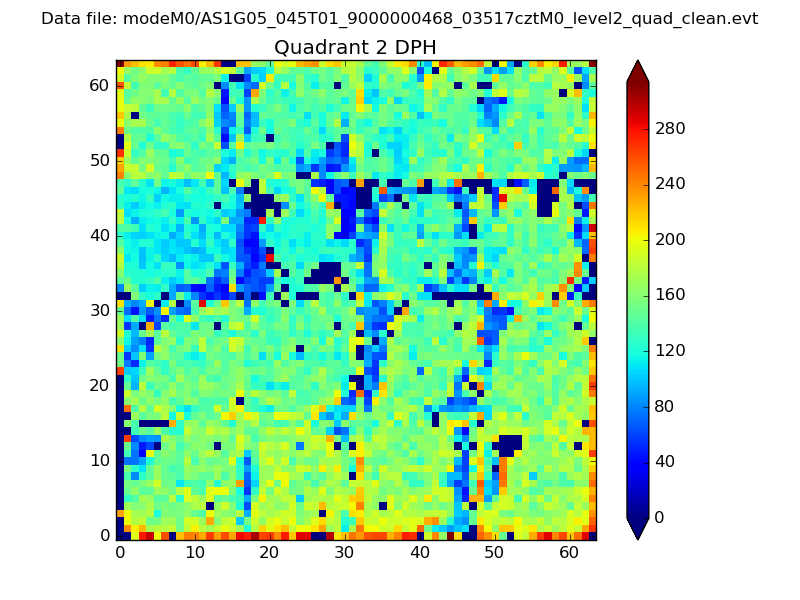 |
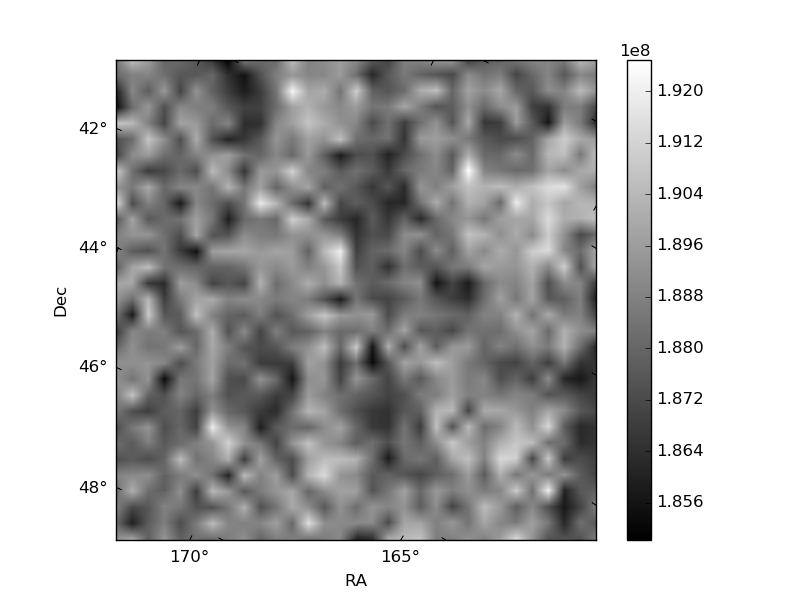
Quadrant C |
| Plot type | Count rate plots | Images |
|---|---|---|
| Comparison with Poisson distribution Blue bars denote a histogram of data divided into 1 sec bins. Red curve is a Poisson curve with rate = median count rate of data. |
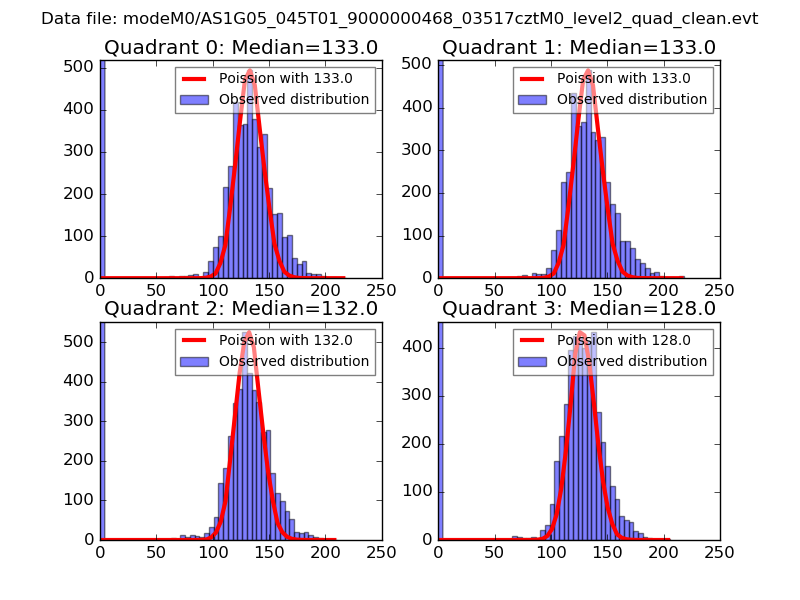 |
 |
| Quadrant-wise count rates Data is divided into 100 sec bins |
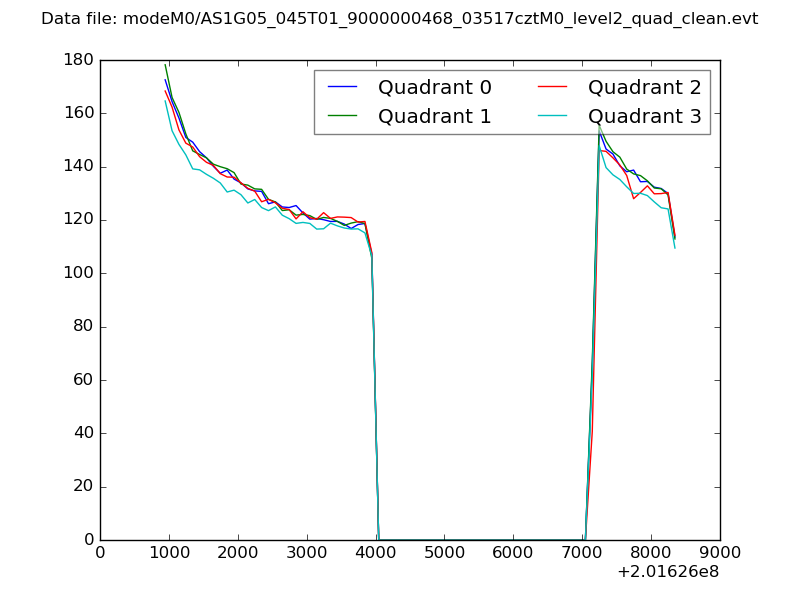 |
|
| Module-wise count rates for Quadrant A Data is divided into 100 sec bins |
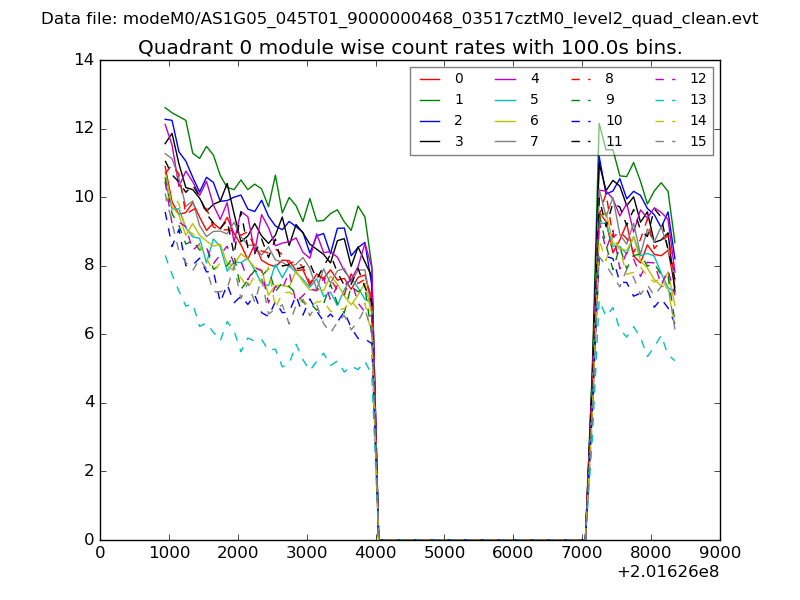 |
 |
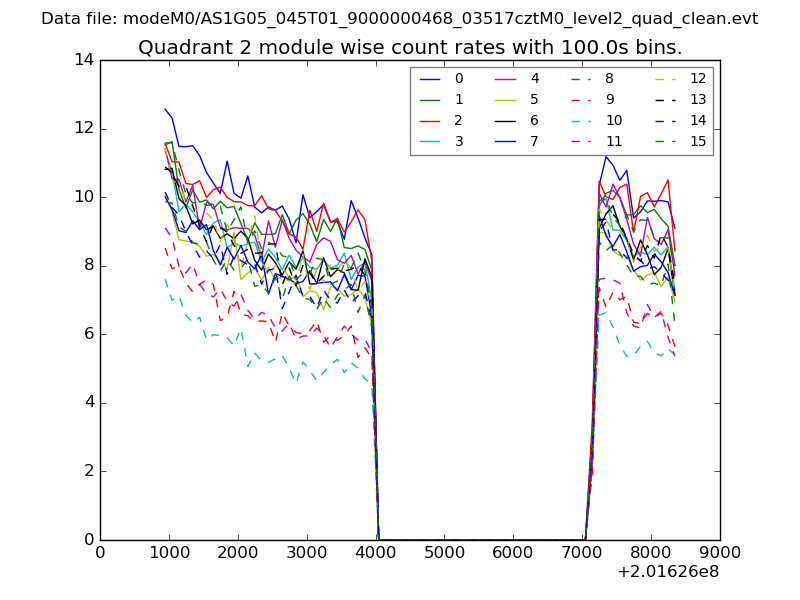
| Module-wise count rates for Quadrant B Data is divided into 100 sec bins |
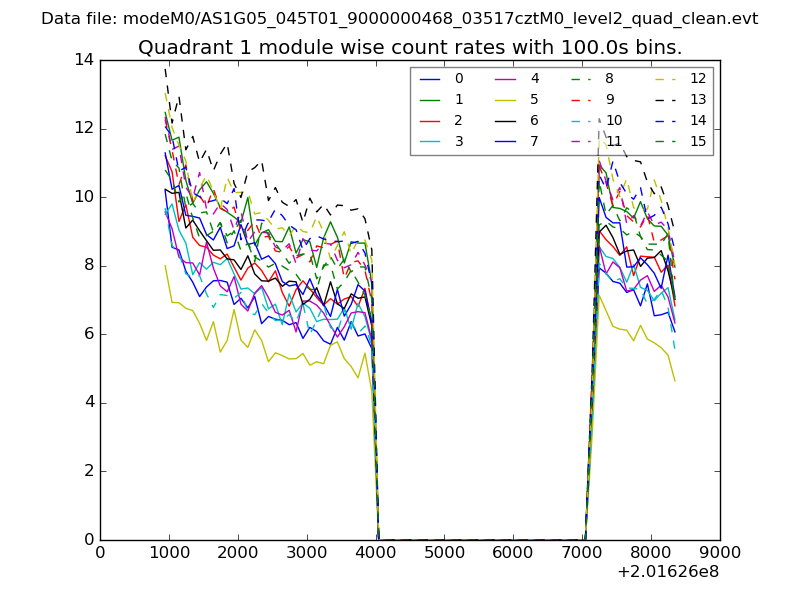 |
 |
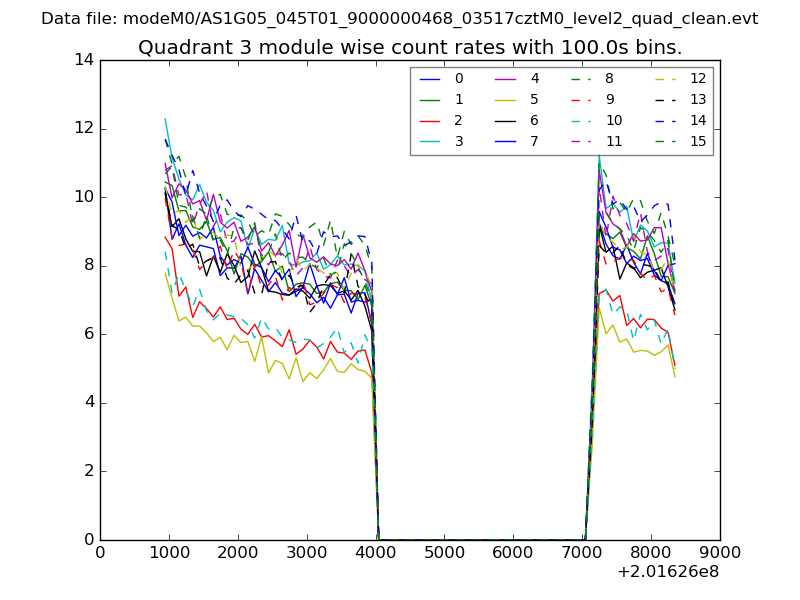
| Module-wise count rates for Quadrant C Data is divided into 100 sec bins |
 |
 |
| Module-wise count rates for Quadrant D Data is divided into 100 sec bins |
 |
 |
| Parameter | Plot |
|---|---|
| CZT HV Monitor | 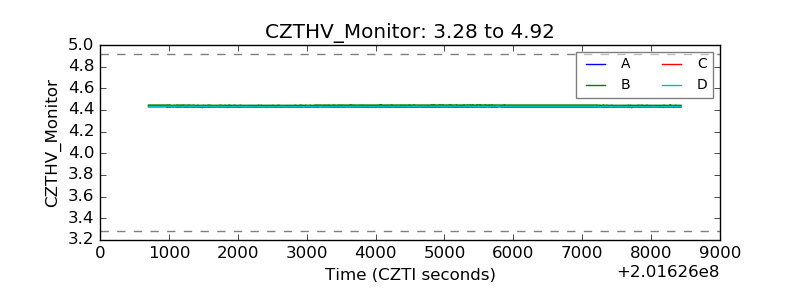 |
| D_VDD | 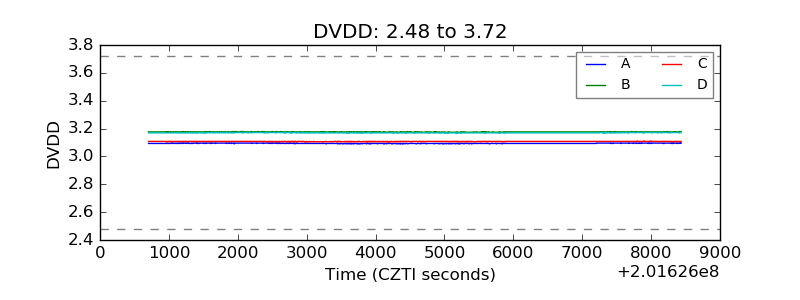 |
| Temperature 1 | 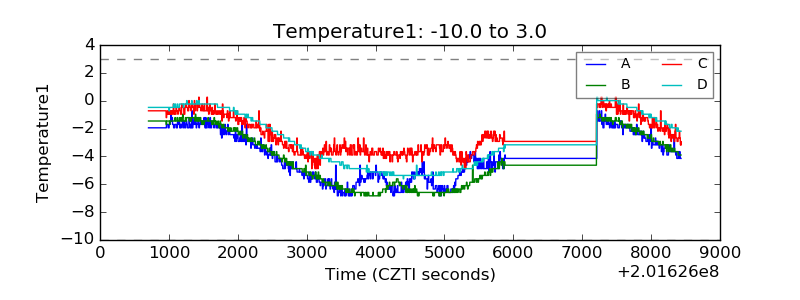 |
| Veto HV Monitor | 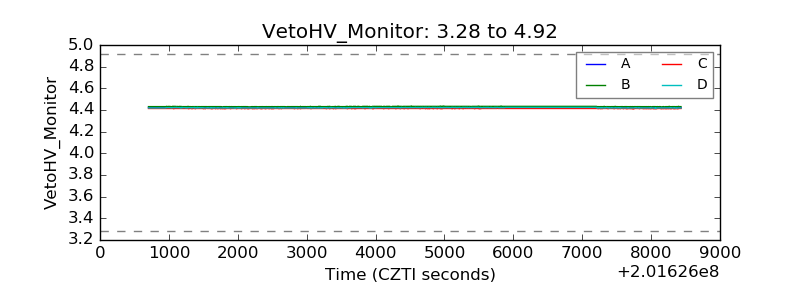 |
| Veto LLD | 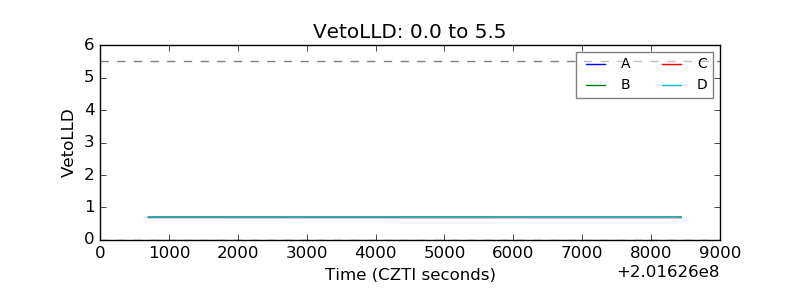 |
| Alpha Counter | 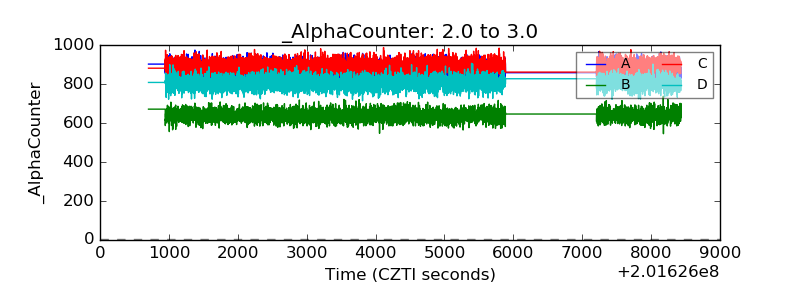 |
| _CPM_Rate | 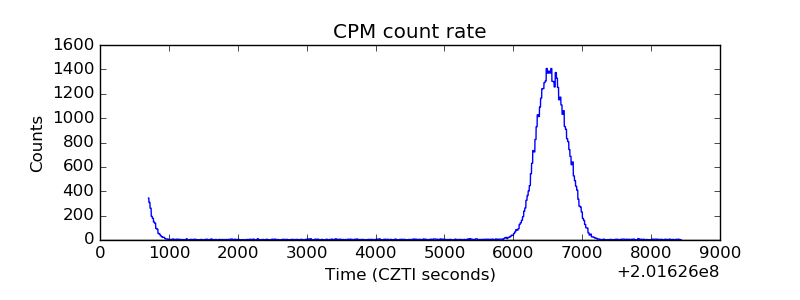 |
| CZT Counter | 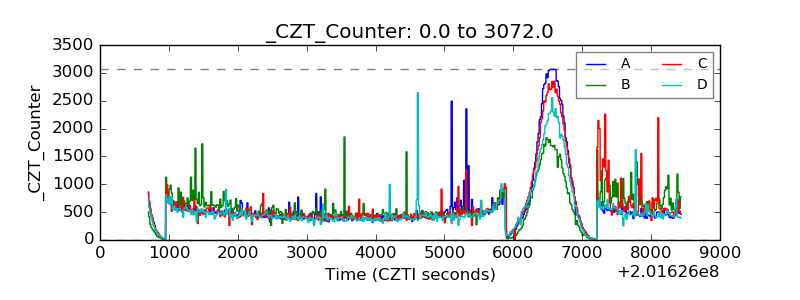 |
| +2.5 Volts monitor |  |
| +5 Volts monitor |  |
| _ROLL_ROT | 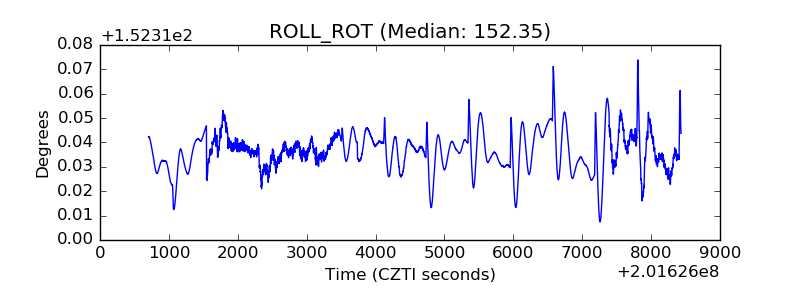 |
| _Roll_DEC | 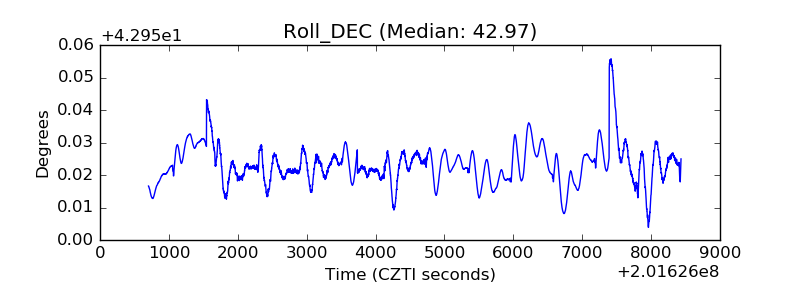 |
| _Roll_RA | 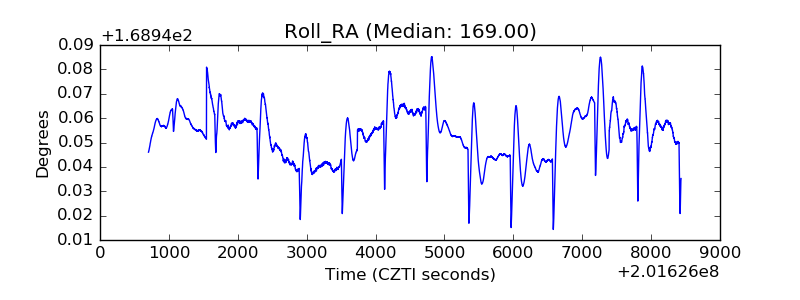 |
| Veto Counter | 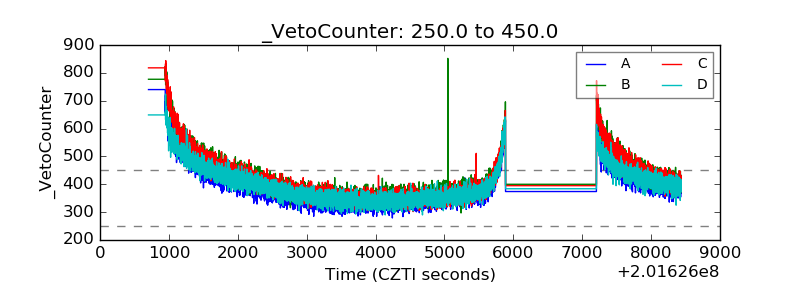 |