| Param | Original file | Final file |
|---|---|---|
| Filename | modeM0/AS1G05_045T01_9000000468_03518cztM0_level2.evt | modeM0/AS1G05_045T01_9000000468_03518cztM0_level2_quad_clean.evt |
| Size (bytes) | 439,145,280 | 83,580,480 |
| Size | 418.8 MB | 79.7 MB |
| Events in quadrant A | 2,881,188 | 530,700 |
| Events in quadrant B | 3,613,294 | 533,480 |
| Events in quadrant C | 3,540,588 | 523,182 |
| Events in quadrant D | 2,843,924 | 511,700 |
| Mode M0 | |||
|---|---|---|---|
| Quadrant | BADHDUFLAG | Total packets | Discarded packets |
| A | 0 | 12903 | 3 |
| B | 0 | 15066 | 2 |
| C | 0 | 14727 | 2 |
| D | 0 | 13118 | 2 |
| Mode M9 | |||
|---|---|---|---|
| Quadrant | BADHDUFLAG | Total packets | Discarded packets |
| A | 0 | 19 | 0 |
| B | 0 | 19 | 0 |
| C | 0 | 19 | 0 |
| D | 0 | 20 | 0 |
| Mode SS | |||
|---|---|---|---|
| Quadrant | BADHDUFLAG | Total packets | Discarded packets |
| A | 0 | 124 | 0 |
| B | 0 | 124 | 0 |
| C | 0 | 124 | 0 |
| D | 0 | 124 | 0 |
| Quadrant | Total seconds | Saturated seconds | Saturation percentage |
|---|---|---|---|
| A | 6193 | 37 | 0.597449% |
| B | 6193 | 50 | 0.807363% |
| C | 6193 | 163 | 2.632004% |
| D | 6193 | 40 | 0.645891% |
Noise dominated data is calculated using 1-second bins in cleaned event files. If a bin has >2000 counts, and if more than 50% of those come from <1% of pixels, then it is considered to be noise-dominated and hence unusable.
| Quadrant | # 1 sec bins | Bins with >0 counts | Bins with >2000 counts | High rate bins dominated by noise | Noise dominated (total time) | Noise dominated (detector-on time) | Marked lightcurve |
|---|---|---|---|---|---|---|---|
| A | 7463 | 6194 | 7 | 7 | 0.09% | 0.11% | 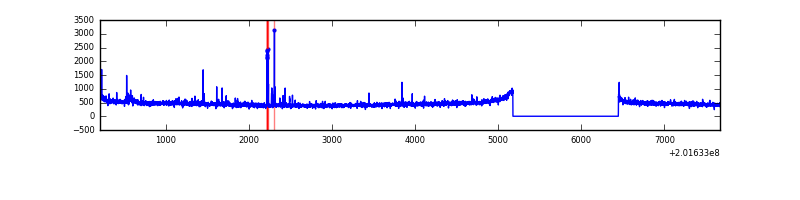 |
| B | 7463 | 6194 | 3 | 3 | 0.04% | 0.05% | 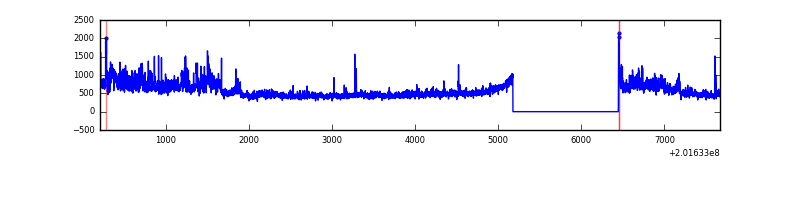 |
| C | 7463 | 6194 | 60 | 60 | 0.80% | 0.97% | 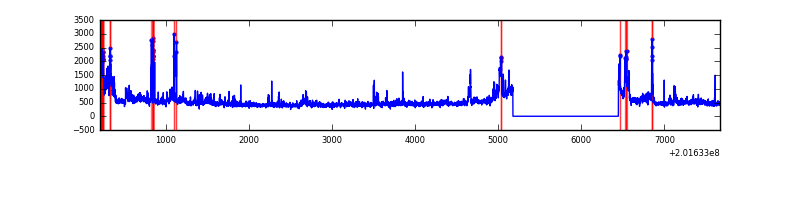 |
| D | 7463 | 6194 | 15 | 15 | 0.20% | 0.24% | 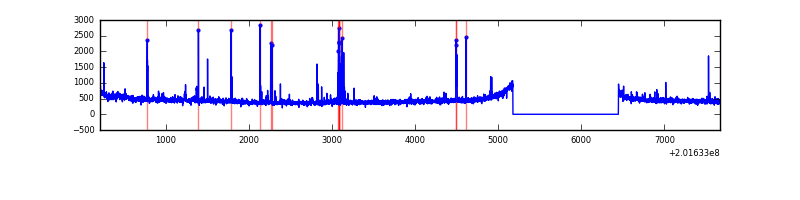 |
Top three noisy pixels from each quadrant. If the there are fewer than three noisy pixels in the level2.evt file, extra rows are filled as -1
| Pixel properties | Quadrant properties | ||||||
|---|---|---|---|---|---|---|---|
| Quadrant | DetID | PixID | Counts | Sigma | Mean | Median | Sigma |
| A | 0 | 149 | 45207 | 301.83 | 720 | 705 | 147.4 |
| A | 8 | 15 | 31904 | 211.61 | 720 | 705 | 147.4 |
| A | 0 | 226 | 12654 | 81.04 | 720 | 705 | 147.4 |
| B | 15 | 204 | 682623 | 4901.4 | 732 | 715 | 139.1 |
| B | 0 | 229 | 34246 | 241.01 | 732 | 715 | 139.1 |
| B | 15 | 85 | 20905 | 145.12 | 732 | 715 | 139.1 |
| C | 1 | 192 | 625455 | 3770.43 | 708 | 713 | 165.7 |
| C | 6 | 80 | 114786 | 688.45 | 708 | 713 | 165.7 |
| C | 1 | 16 | 13805 | 79.01 | 708 | 713 | 165.7 |
| D | 13 | 239 | 62129 | 360.26 | 705 | 685 | 170.6 |
| D | 5 | 233 | 32495 | 186.51 | 705 | 685 | 170.6 |
| D | 2 | 37 | 28113 | 160.82 | 705 | 685 | 170.6 |
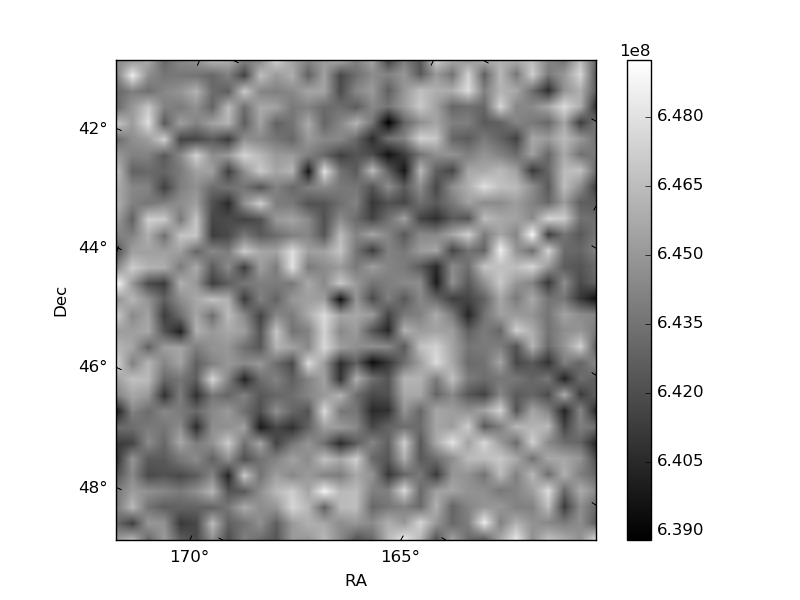
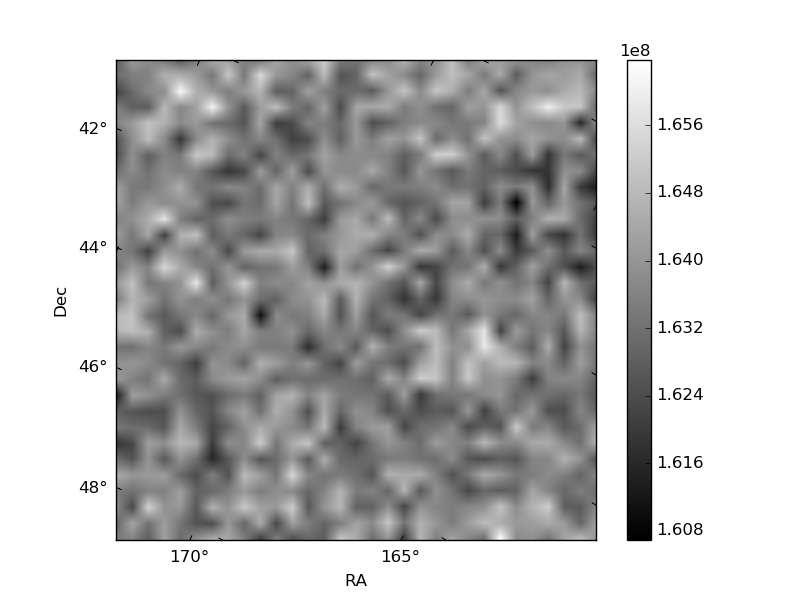
Histogram calculated using DETX and DETY for each event in the final _common_clean file
| Quadrant A | 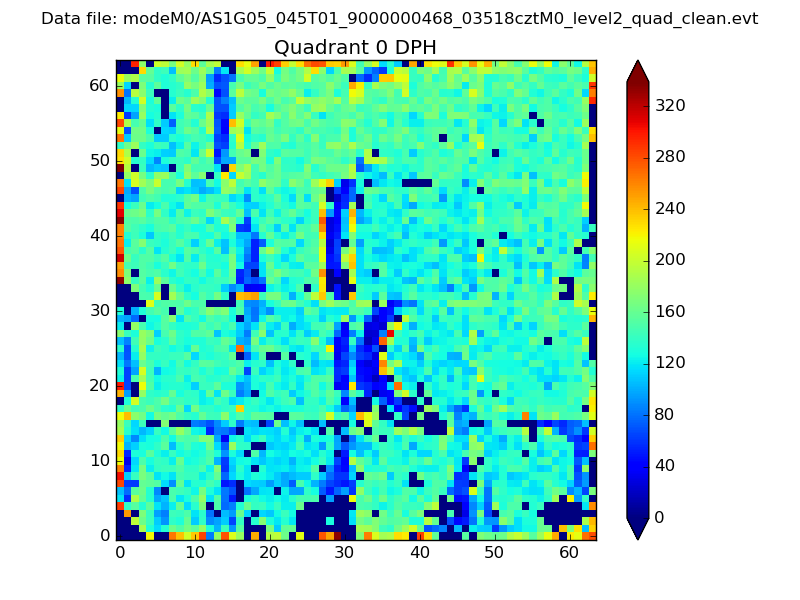 |
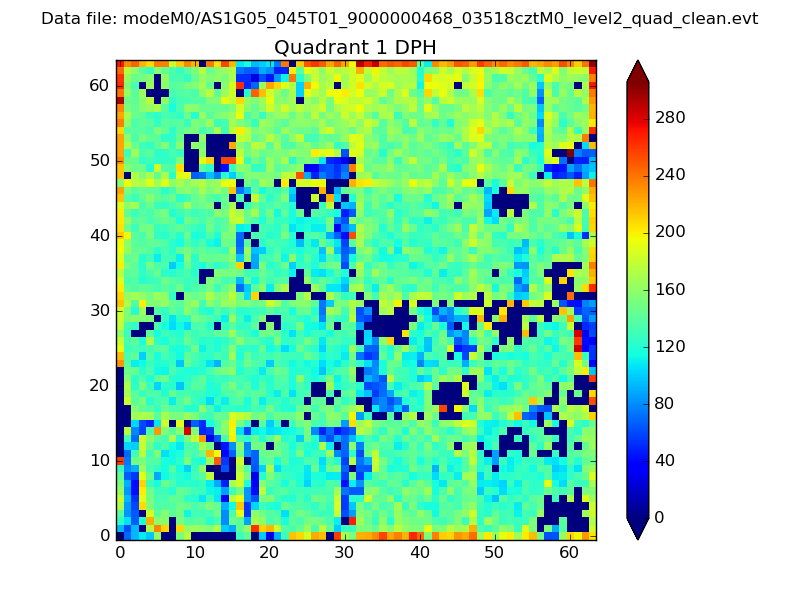 |
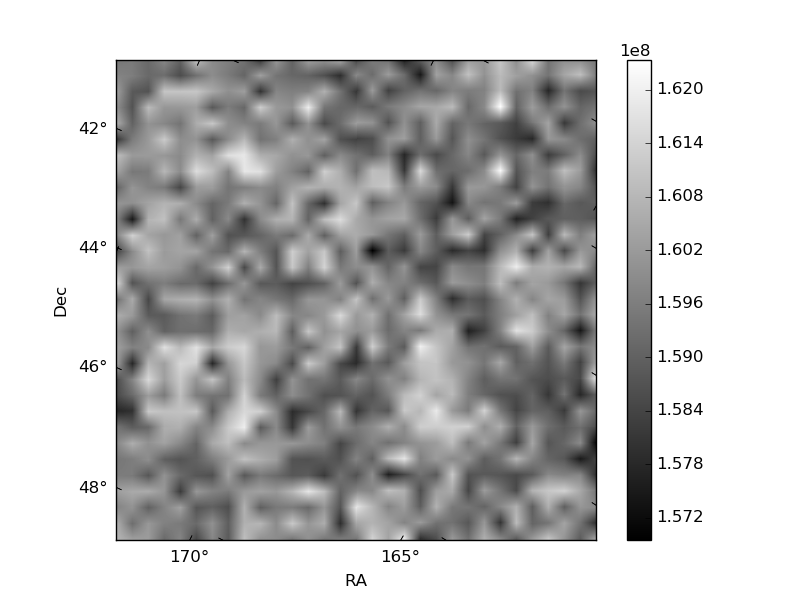
Quadrant B |
|---|---|---|---|
| Quadrant D | 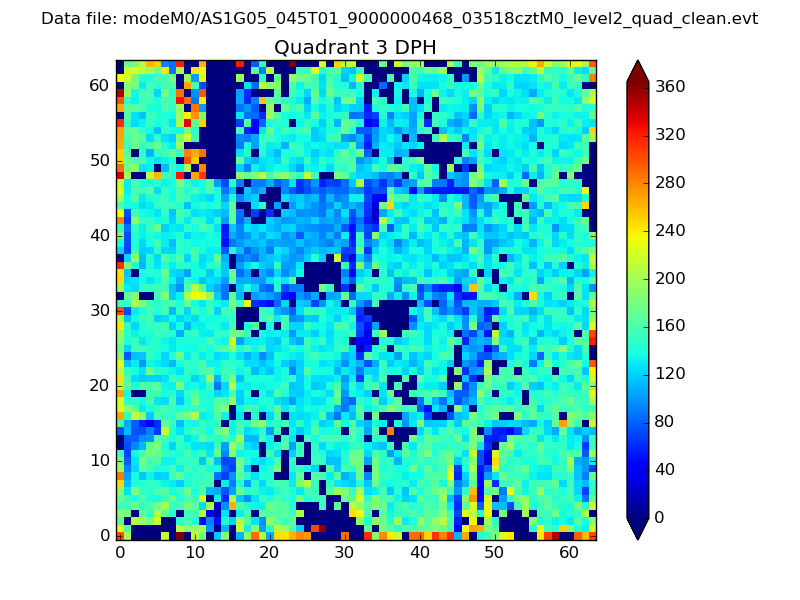 |
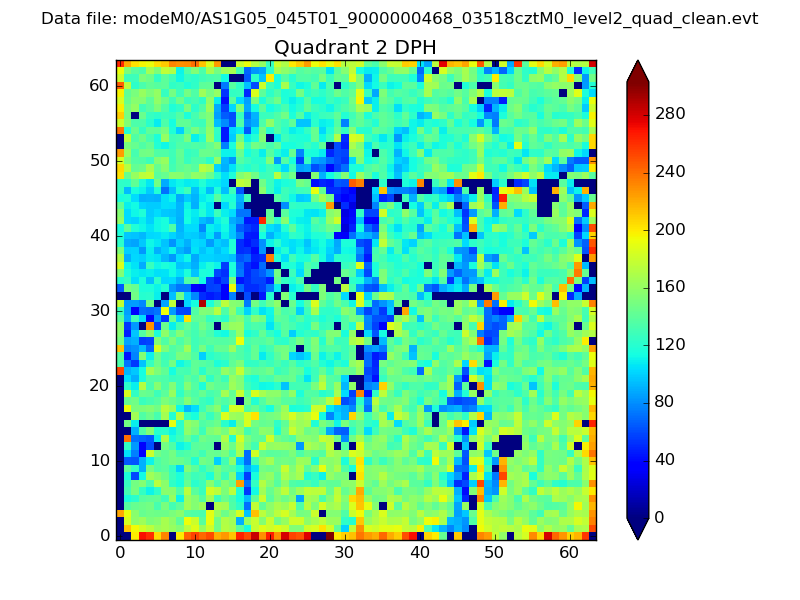 |
Quadrant C |
| Plot type | Count rate plots | Images |
|---|---|---|
| Comparison with Poisson distribution Blue bars denote a histogram of data divided into 1 sec bins. Red curve is a Poisson curve with rate = median count rate of data. |
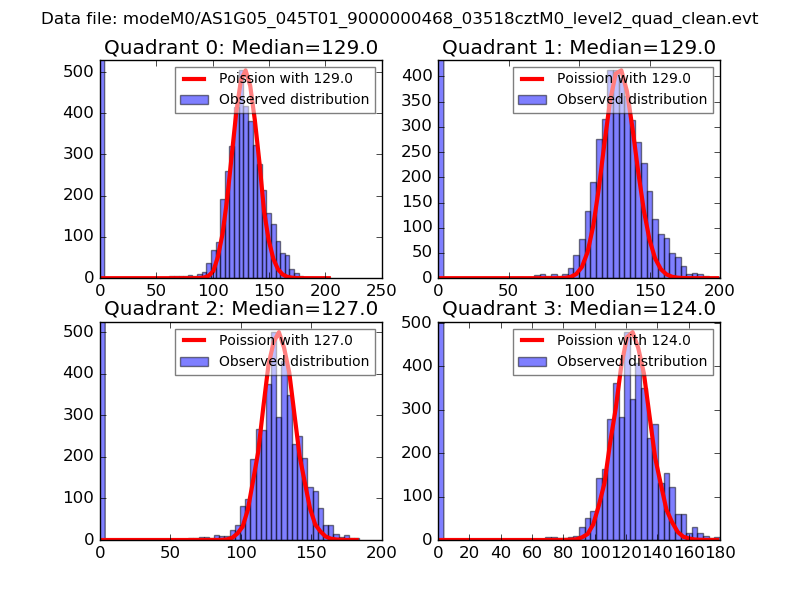 |
 |
| Quadrant-wise count rates Data is divided into 100 sec bins |
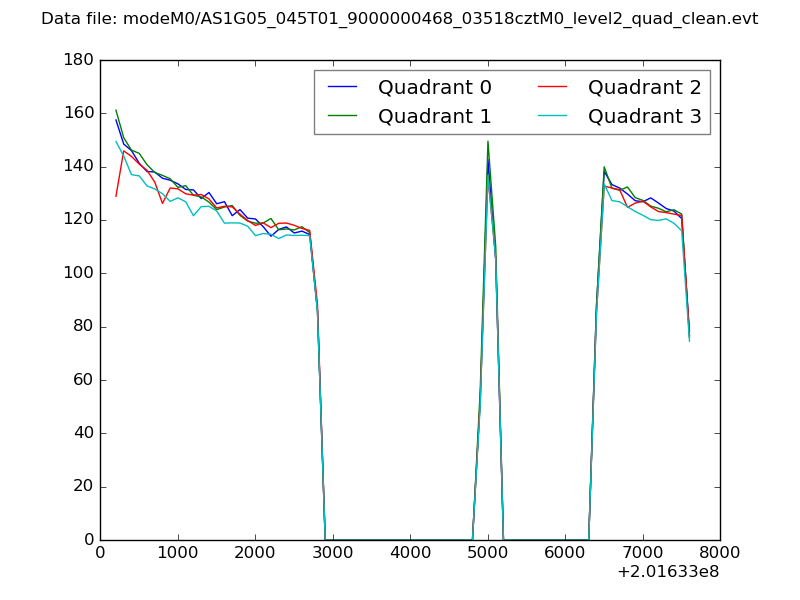 |
|
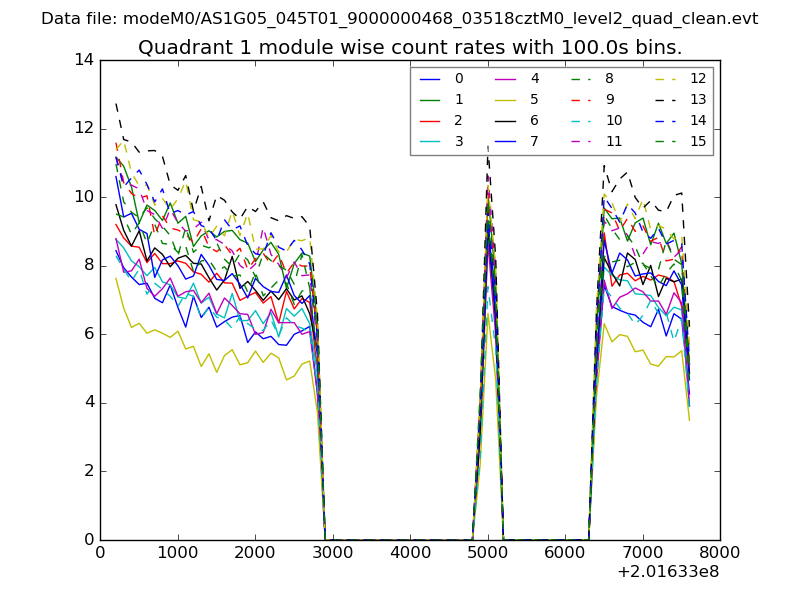
| Module-wise count rates for Quadrant A Data is divided into 100 sec bins |
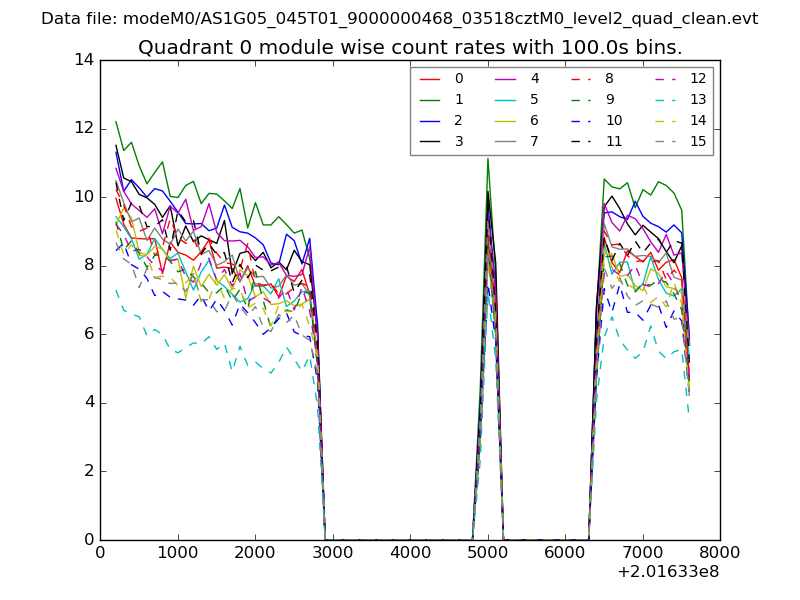 |
 |
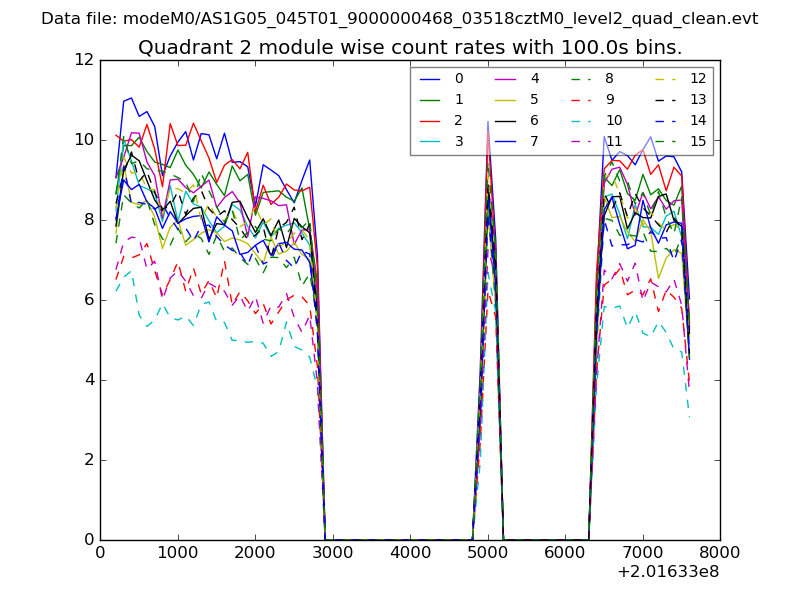
| Module-wise count rates for Quadrant B Data is divided into 100 sec bins |
 |
 |
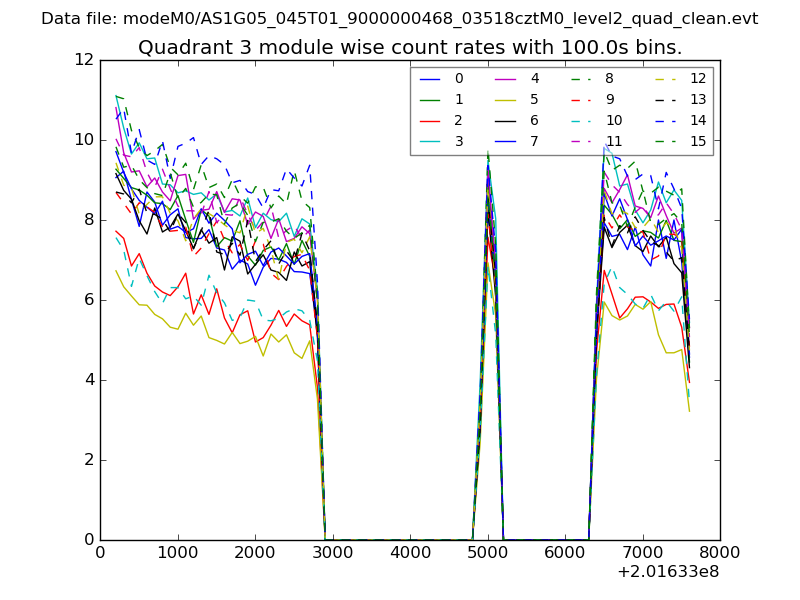
| Module-wise count rates for Quadrant C Data is divided into 100 sec bins |
 |
 |
| Module-wise count rates for Quadrant D Data is divided into 100 sec bins |
 |
 |
| Parameter | Plot |
|---|---|
| CZT HV Monitor | 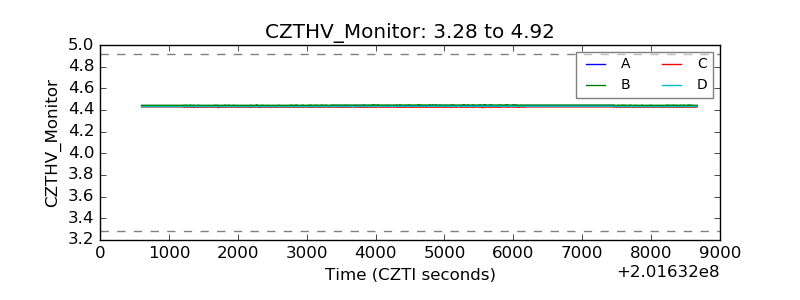 |
| D_VDD | 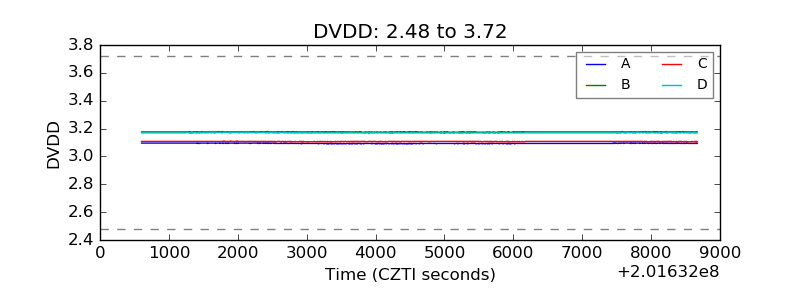 |
| Temperature 1 | 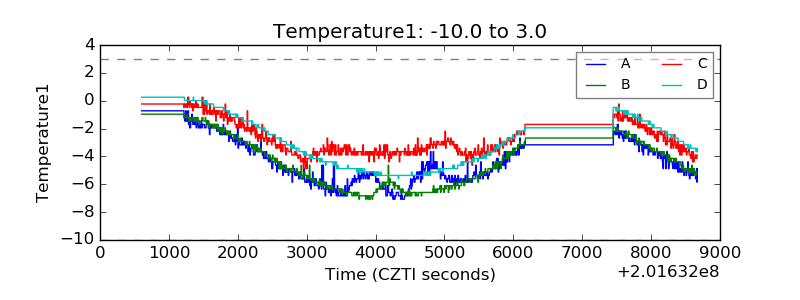 |
| Veto HV Monitor | 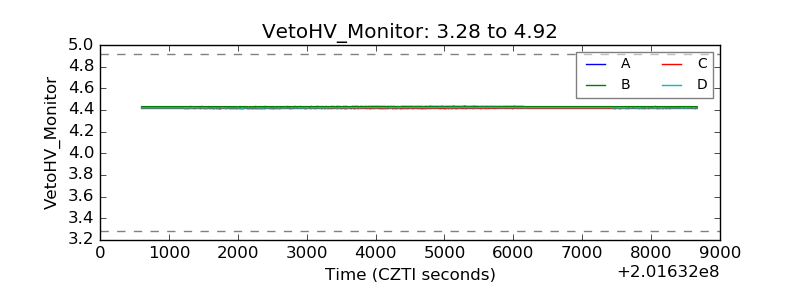 |
| Veto LLD | 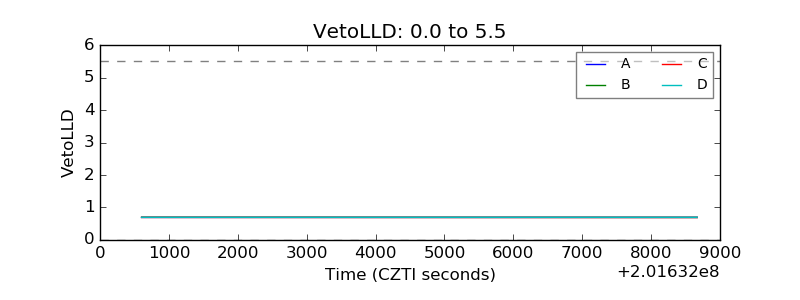 |
| Alpha Counter | 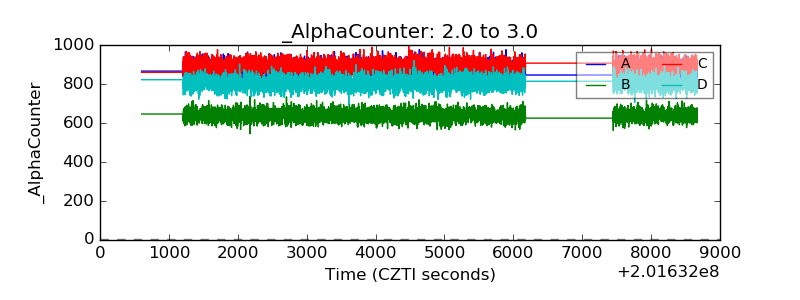 |
| _CPM_Rate | 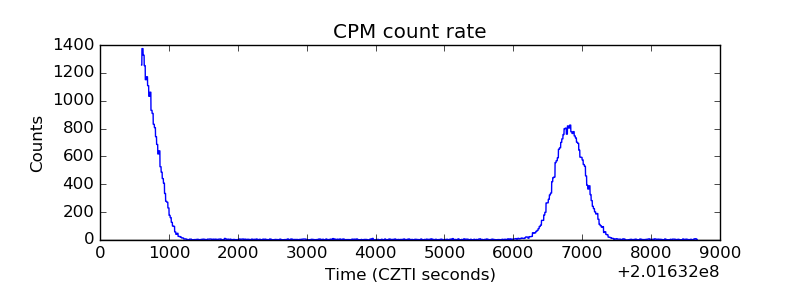 |
| CZT Counter | 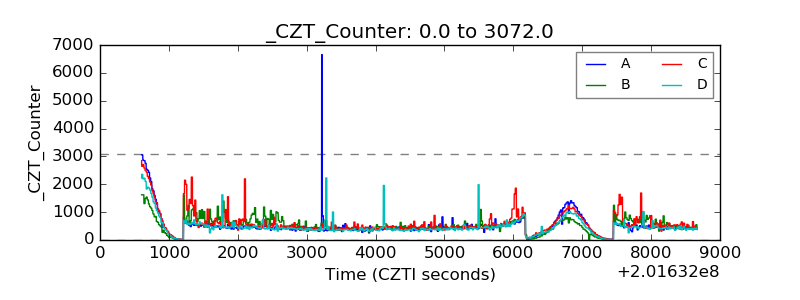 |
| +2.5 Volts monitor |  |
| +5 Volts monitor |  |
| _ROLL_ROT | 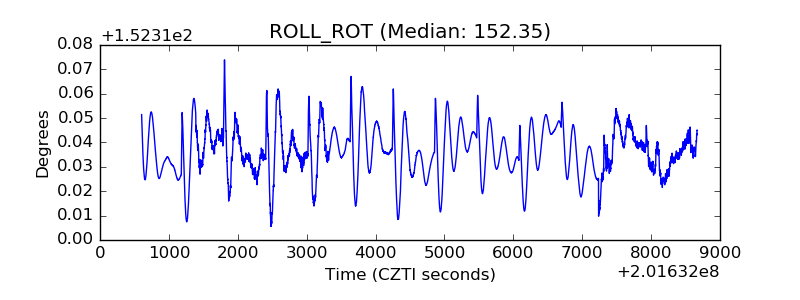 |
| _Roll_DEC | 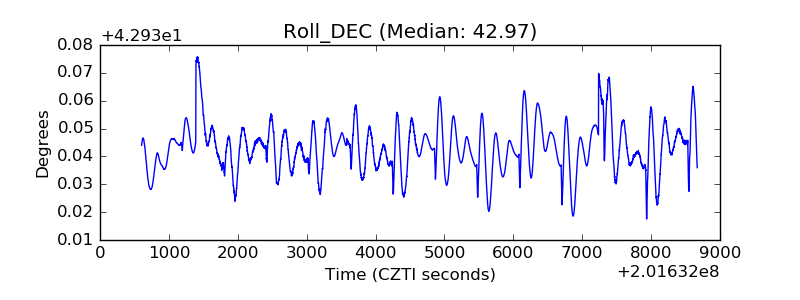 |
| _Roll_RA | 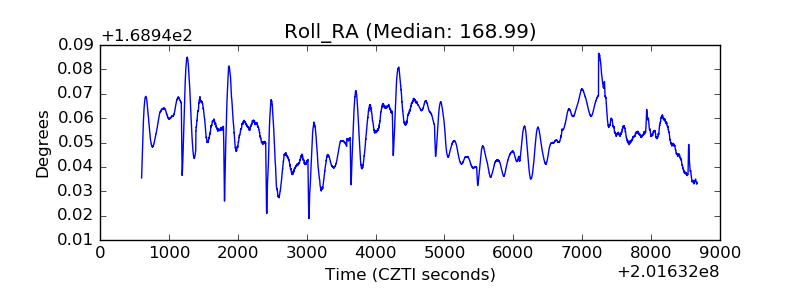 |
| Veto Counter | 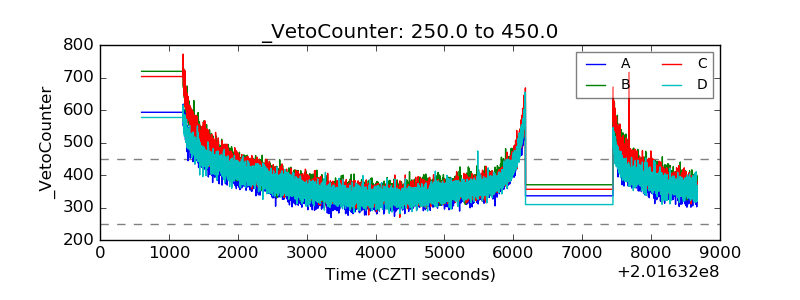 |