| Param | Original file | Final file |
|---|---|---|
| Filename | modeM0/AS1G05_045T01_9000000468_03519cztM0_level2.evt | modeM0/AS1G05_045T01_9000000468_03519cztM0_level2_quad_clean.evt |
| Size (bytes) | 432,293,760 | 84,571,200 |
| Size | 412.3 MB | 80.7 MB |
| Events in quadrant A | 2,854,077 | 536,092 |
| Events in quadrant B | 3,275,643 | 537,483 |
| Events in quadrant C | 3,413,664 | 532,516 |
| Events in quadrant D | 3,110,571 | 505,559 |
| Mode M0 | |||
|---|---|---|---|
| Quadrant | BADHDUFLAG | Total packets | Discarded packets |
| A | 0 | 13179 | 3 |
| B | 0 | 14273 | 2 |
| C | 0 | 14485 | 2 |
| D | 0 | 14176 | 2 |
| Mode M9 | |||
|---|---|---|---|
| Quadrant | BADHDUFLAG | Total packets | Discarded packets |
| A | 0 | 20 | 0 |
| B | 0 | 20 | 0 |
| C | 0 | 20 | 0 |
| D | 0 | 21 | 0 |
| Mode SS | |||
|---|---|---|---|
| Quadrant | BADHDUFLAG | Total packets | Discarded packets |
| A | 0 | 130 | 0 |
| B | 0 | 130 | 0 |
| C | 0 | 130 | 0 |
| D | 0 | 130 | 0 |
| Quadrant | Total seconds | Saturated seconds | Saturation percentage |
|---|---|---|---|
| A | 6445 | 23 | 0.356866% |
| B | 6445 | 36 | 0.558573% |
| C | 6445 | 60 | 0.930954% |
| D | 6445 | 135 | 2.094647% |
Noise dominated data is calculated using 1-second bins in cleaned event files. If a bin has >2000 counts, and if more than 50% of those come from <1% of pixels, then it is considered to be noise-dominated and hence unusable.
| Quadrant | # 1 sec bins | Bins with >0 counts | Bins with >2000 counts | High rate bins dominated by noise | Noise dominated (total time) | Noise dominated (detector-on time) | Marked lightcurve |
|---|---|---|---|---|---|---|---|
| A | 7515 | 6446 | 0 | 0 | 0.00% | 0.00% | 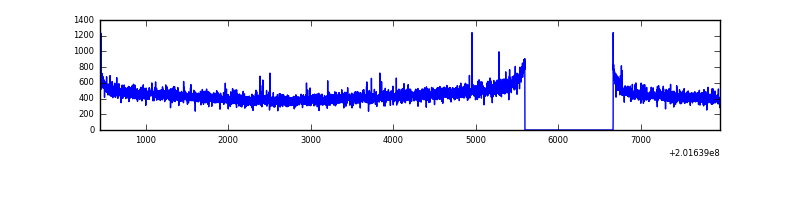 |
| B | 7515 | 6446 | 5 | 5 | 0.07% | 0.08% | 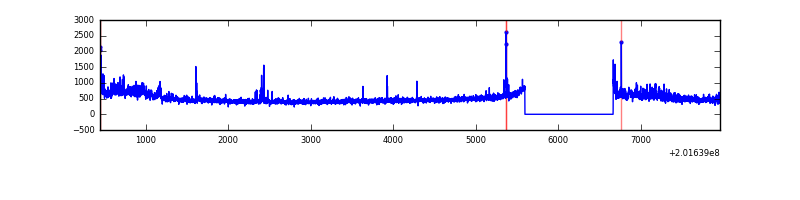 |
| C | 7515 | 6446 | 23 | 23 | 0.31% | 0.36% | 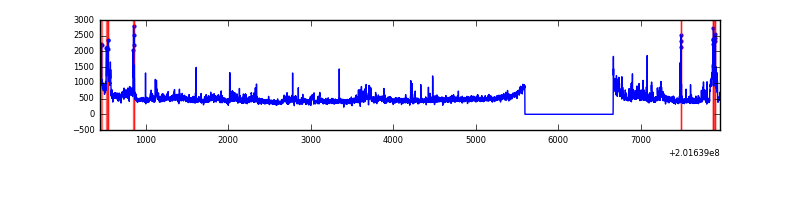 |
| D | 7515 | 6446 | 129 | 129 | 1.72% | 2.00% | 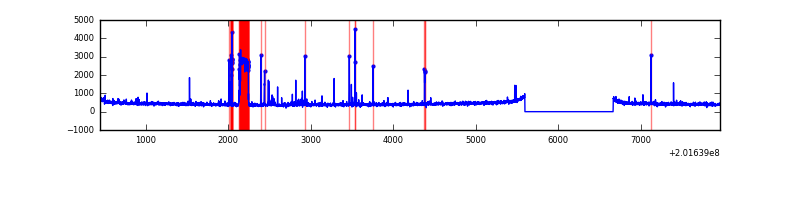 |
Top three noisy pixels from each quadrant. If the there are fewer than three noisy pixels in the level2.evt file, extra rows are filled as -1
| Pixel properties | Quadrant properties | ||||||
|---|---|---|---|---|---|---|---|
| Quadrant | DetID | PixID | Counts | Sigma | Mean | Median | Sigma |
| A | 8 | 15 | 41770 | 275.38 | 725 | 707 | 149.1 |
| A | 0 | 226 | 8198 | 50.24 | 725 | 707 | 149.1 |
| A | 12 | 194 | 7779 | 47.43 | 725 | 707 | 149.1 |
| B | 15 | 204 | 303930 | 2149.11 | 739 | 721 | 141.1 |
| B | 15 | 85 | 35935 | 249.59 | 739 | 721 | 141.1 |
| B | 0 | 229 | 30125 | 208.41 | 739 | 721 | 141.1 |
| C | 1 | 192 | 548721 | 3296.63 | 713 | 717 | 166.2 |
| C | 1 | 16 | 49343 | 292.52 | 713 | 717 | 166.2 |
| C | 15 | 208 | 14645 | 83.79 | 713 | 717 | 166.2 |
| D | 2 | 31 | 328796 | 1950.3 | 699 | 680 | 168.2 |
| D | 13 | 239 | 48440 | 283.88 | 699 | 680 | 168.2 |
| D | 5 | 233 | 29714 | 172.57 | 699 | 680 | 168.2 |
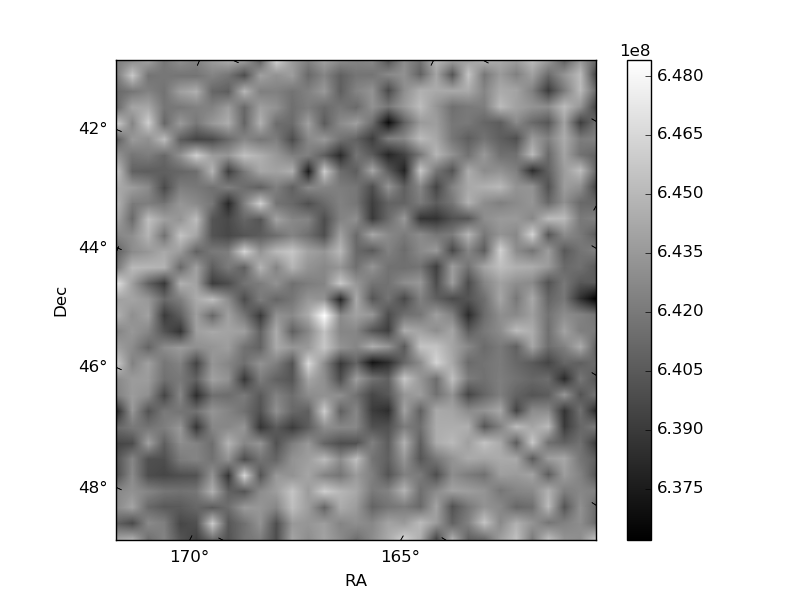
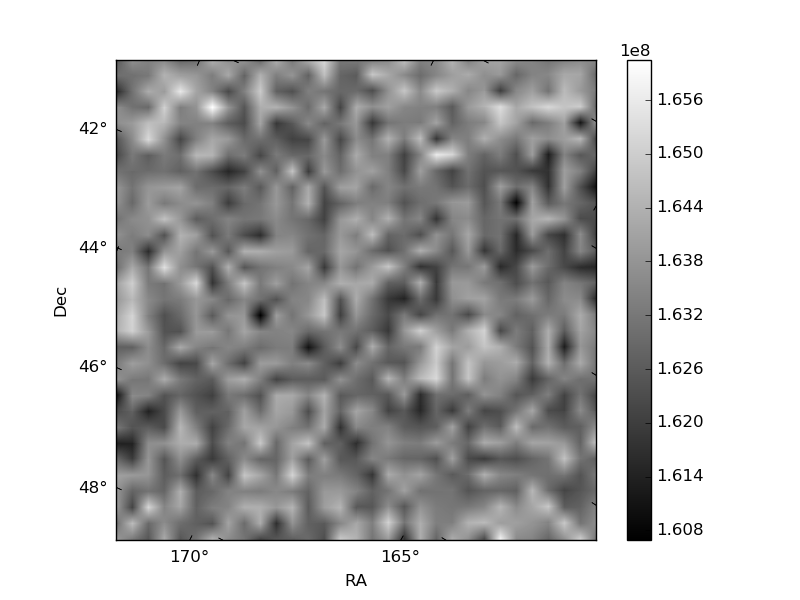
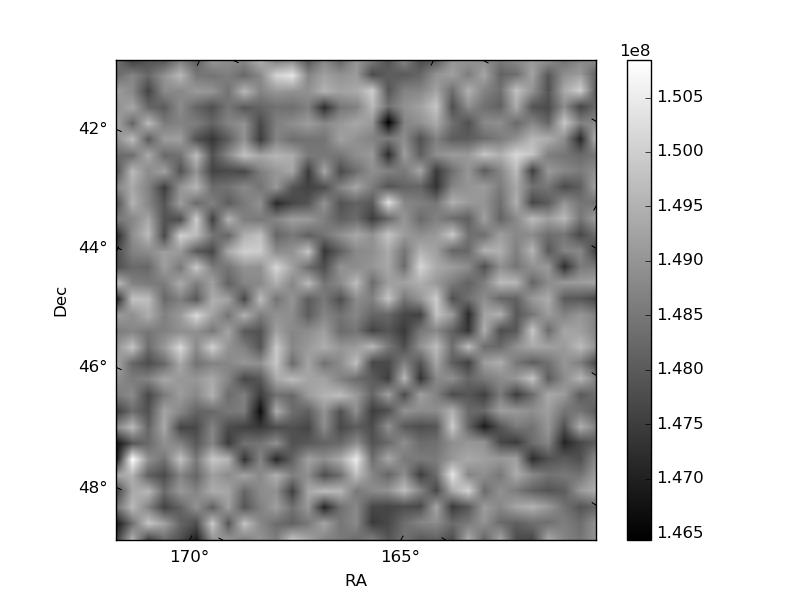
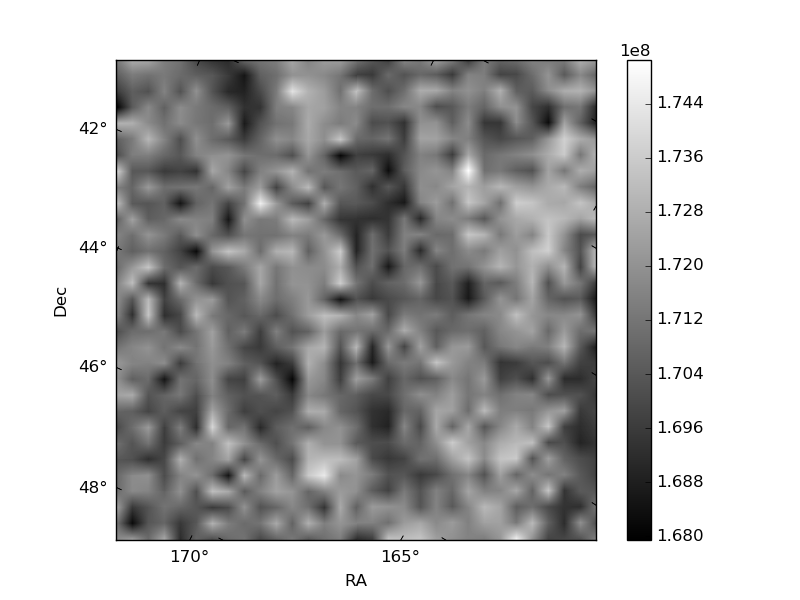
Histogram calculated using DETX and DETY for each event in the final _common_clean file
| Quadrant A | 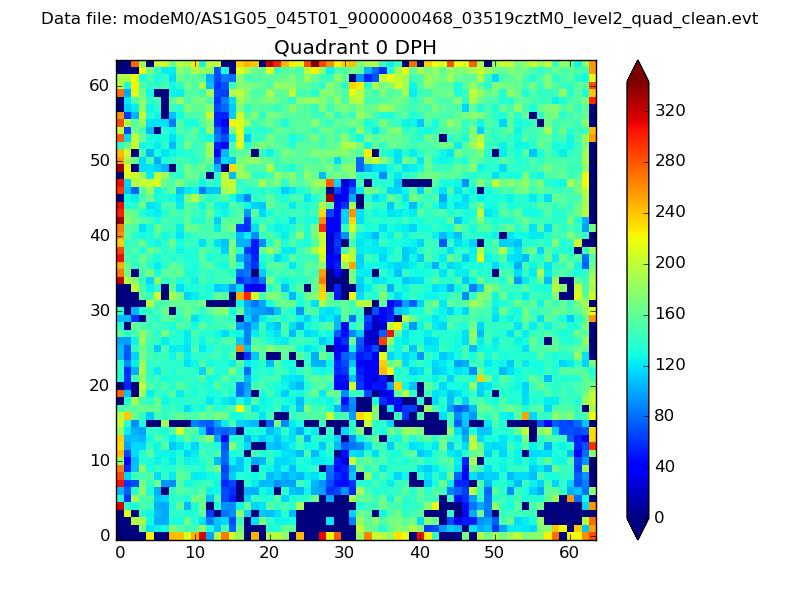 |
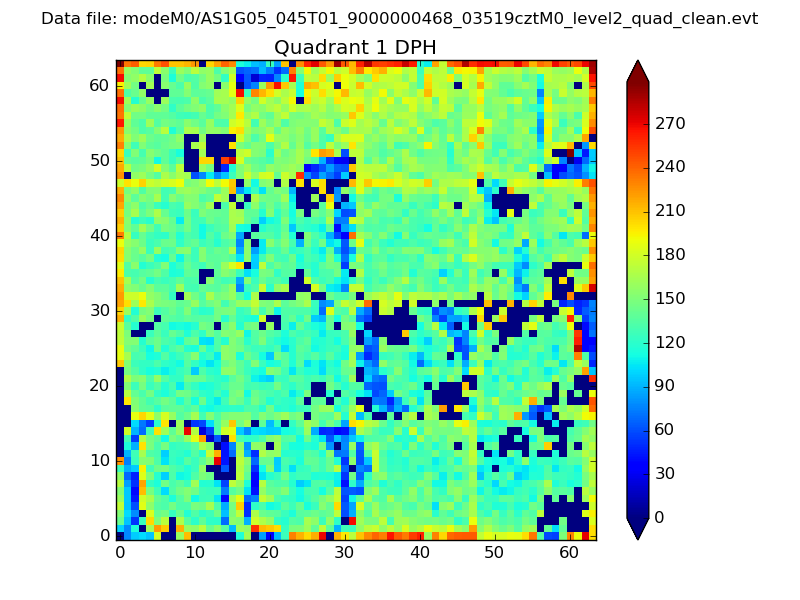 |
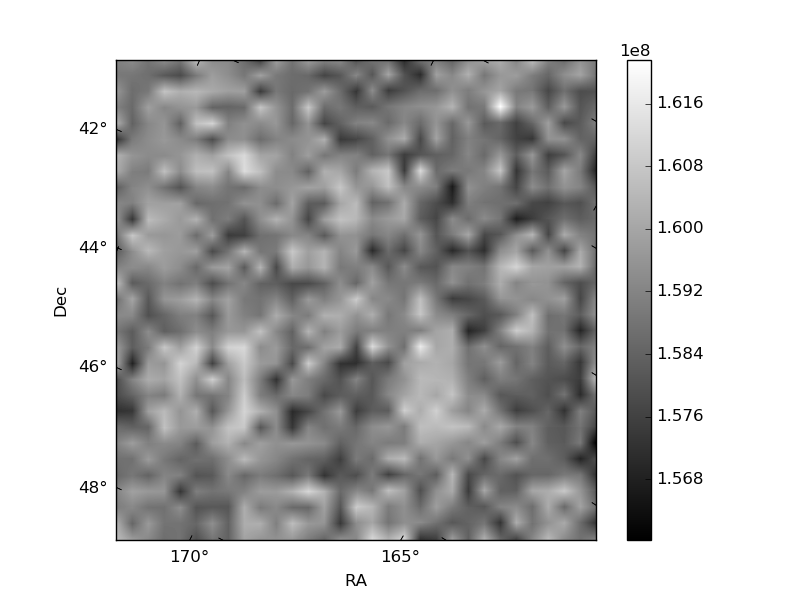
Quadrant B |
|---|---|---|---|
| Quadrant D | 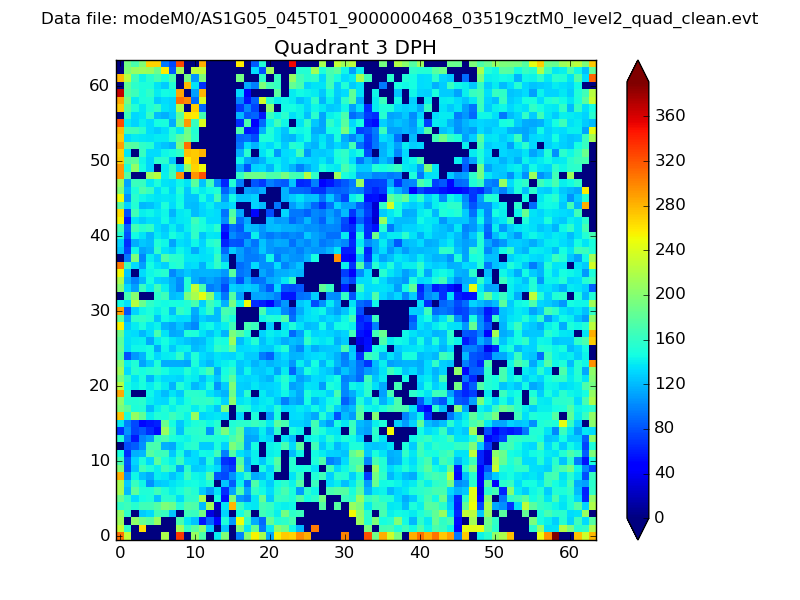 |
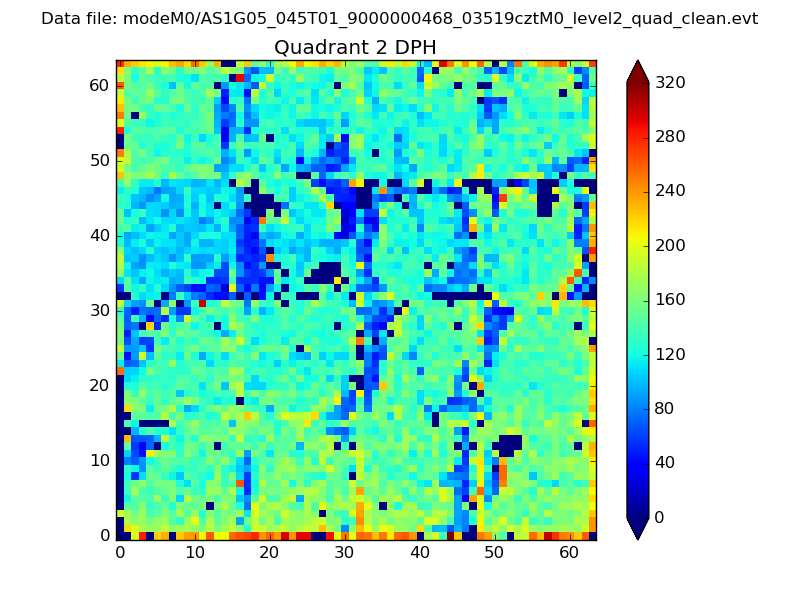 |
Quadrant C |
| Plot type | Count rate plots | Images |
|---|---|---|
| Comparison with Poisson distribution Blue bars denote a histogram of data divided into 1 sec bins. Red curve is a Poisson curve with rate = median count rate of data. |
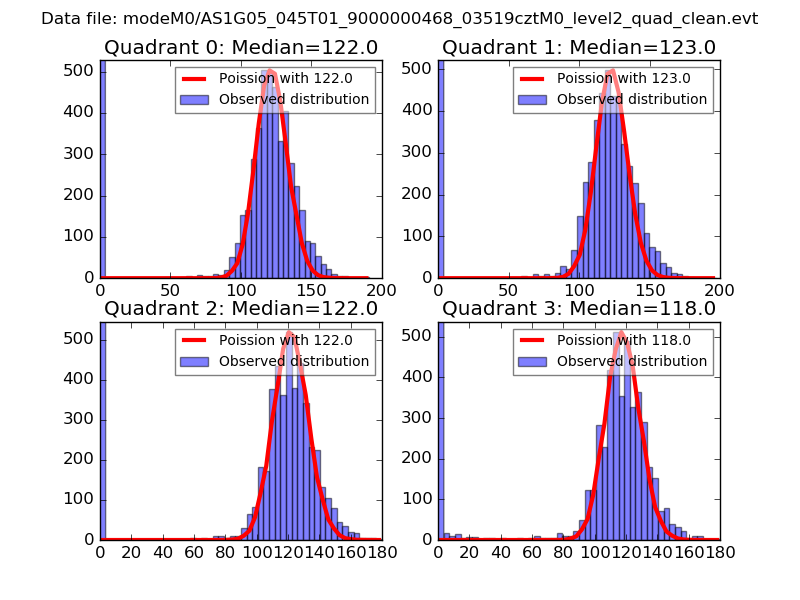 |
 |
| Quadrant-wise count rates Data is divided into 100 sec bins |
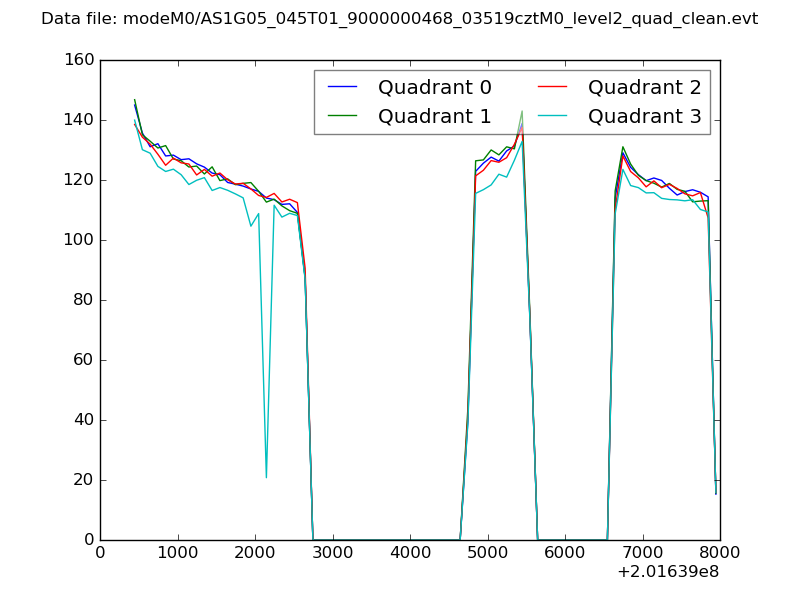 |
|
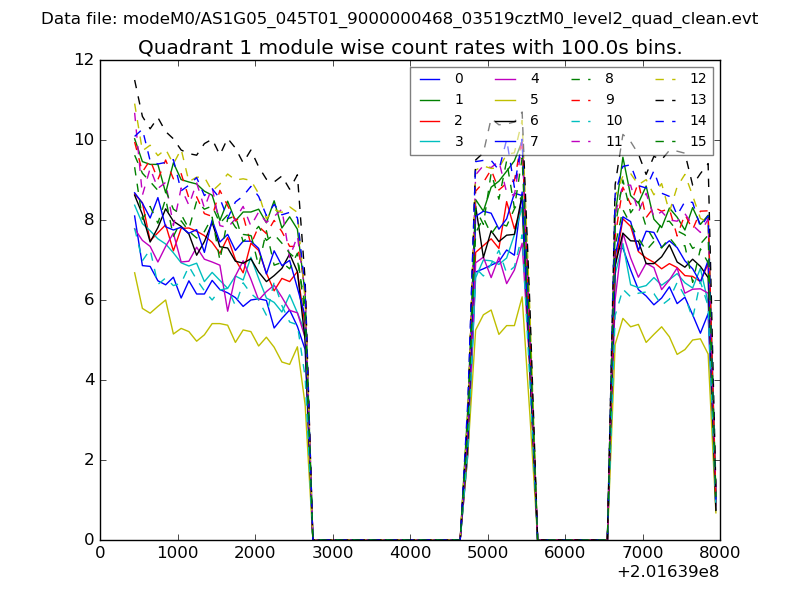
| Module-wise count rates for Quadrant A Data is divided into 100 sec bins |
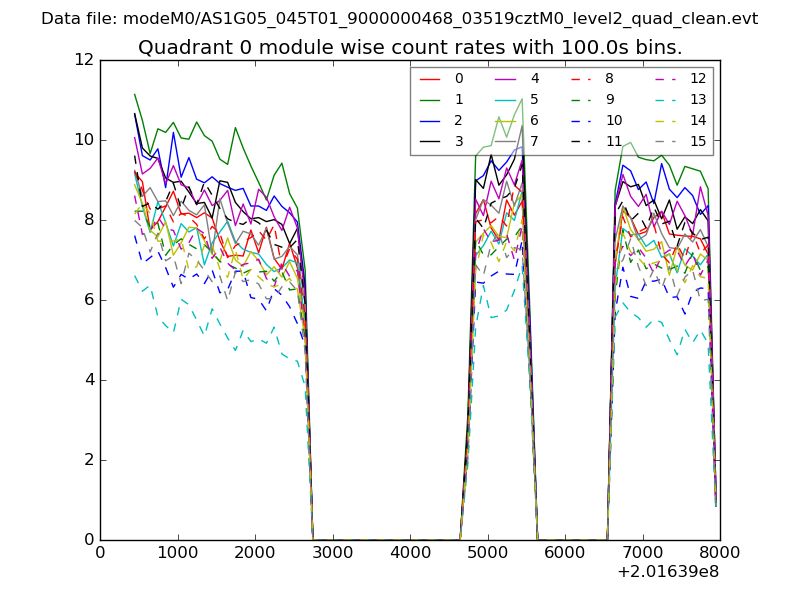 |
 |
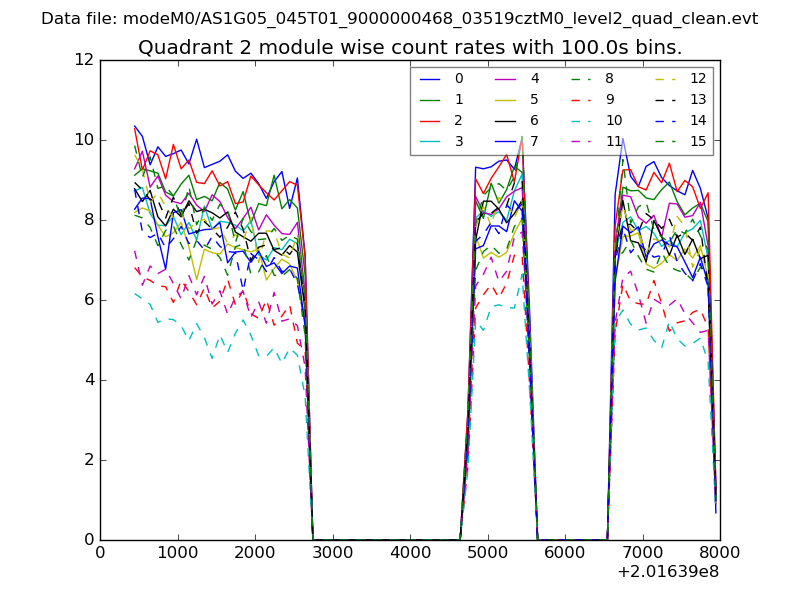
| Module-wise count rates for Quadrant B Data is divided into 100 sec bins |
 |
 |
| Module-wise count rates for Quadrant C Data is divided into 100 sec bins |
 |
 |
| Module-wise count rates for Quadrant D Data is divided into 100 sec bins |
 |
 |
| Parameter | Plot |
|---|---|
| CZT HV Monitor | 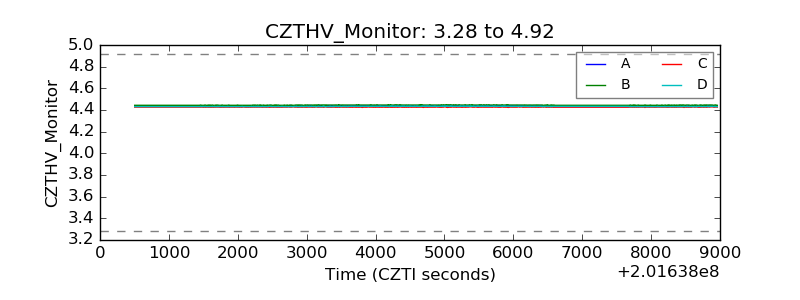 |
| D_VDD | 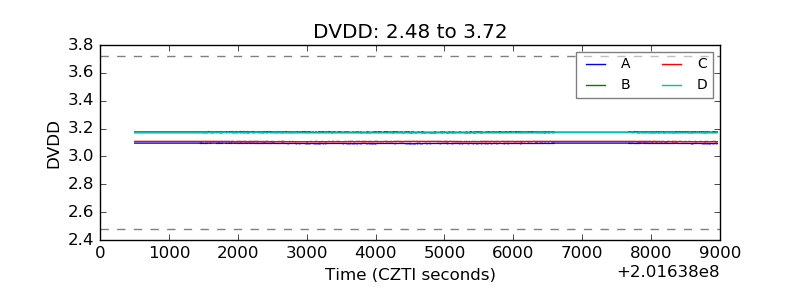 |
| Temperature 1 |  |
| Veto HV Monitor | 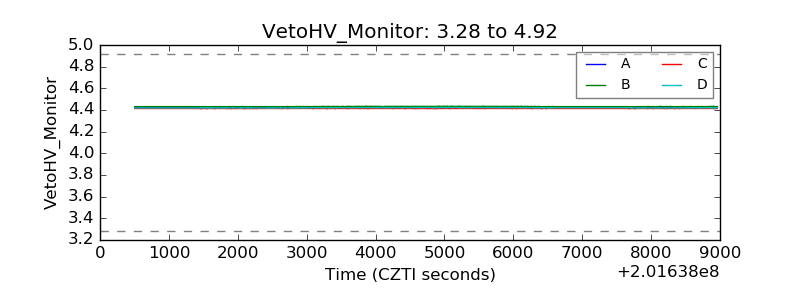 |
| Veto LLD | 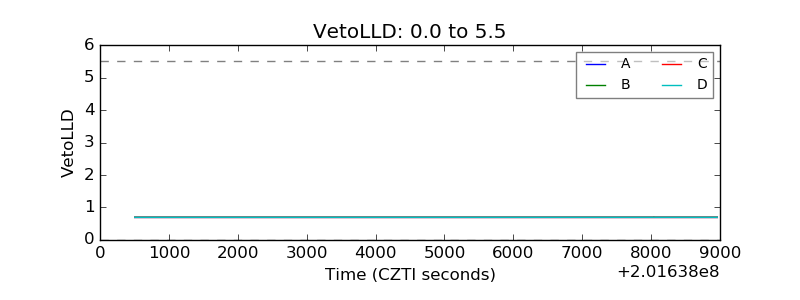 |
| Alpha Counter | 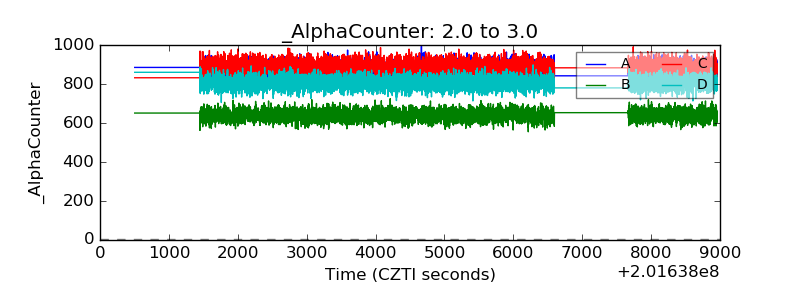 |
| _CPM_Rate | 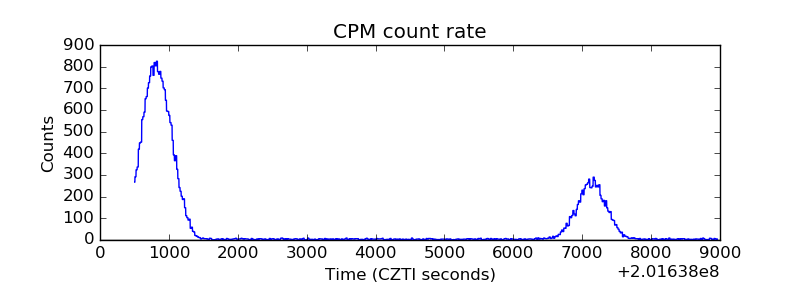 |
| CZT Counter | 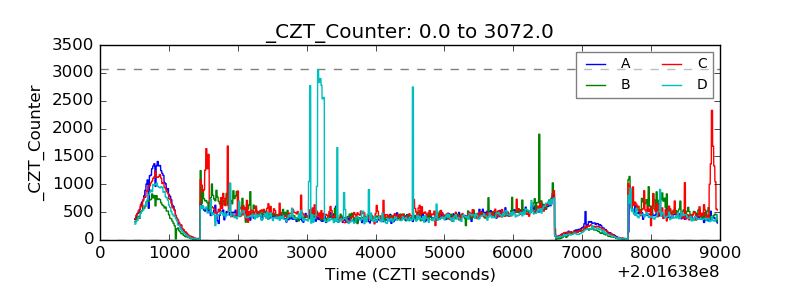 |
| +2.5 Volts monitor |  |
| +5 Volts monitor |  |
| _ROLL_ROT | 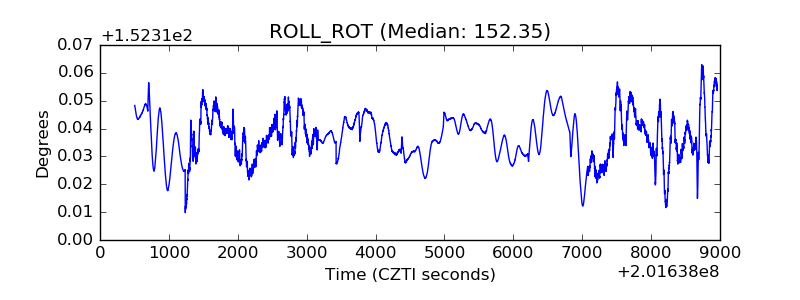 |
| _Roll_DEC | 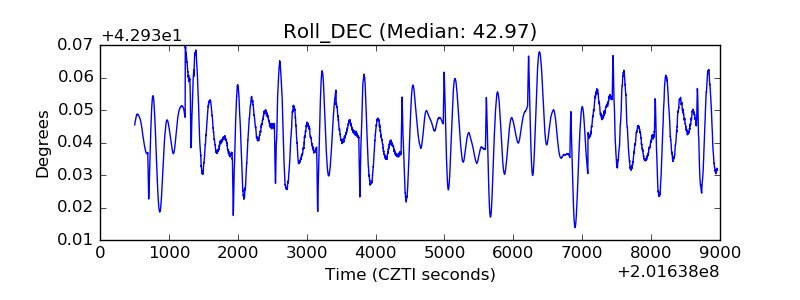 |
| _Roll_RA | 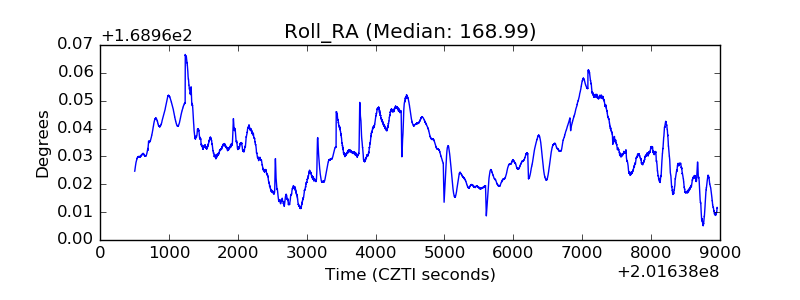 |
| Veto Counter | 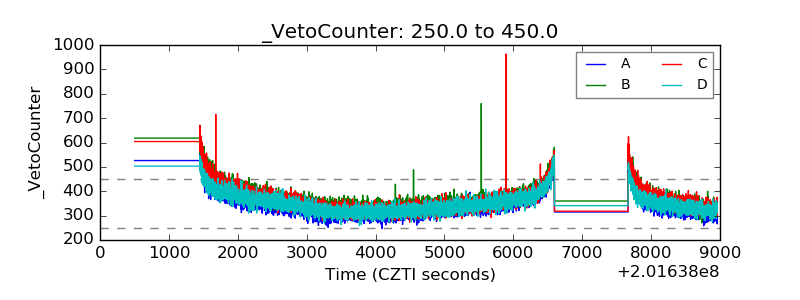 |