| Param | Original file | Final file |
|---|---|---|
| Filename | modeM0/AS1G05_045T01_9000000468_03520cztM0_level2.evt | modeM0/AS1G05_045T01_9000000468_03520cztM0_level2_quad_clean.evt |
| Size (bytes) | 472,417,920 | 92,603,520 |
| Size | 450.5 MB | 88.3 MB |
| Events in quadrant A | 3,624,058 | 583,669 |
| Events in quadrant B | 3,507,597 | 587,119 |
| Events in quadrant C | 3,550,404 | 581,081 |
| Events in quadrant D | 3,148,318 | 563,736 |
| Mode M0 | |||
|---|---|---|---|
| Quadrant | BADHDUFLAG | Total packets | Discarded packets |
| A | 0 | 15803 | 3 |
| B | 0 | 15374 | 2 |
| C | 0 | 15426 | 2 |
| D | 0 | 14821 | 2 |
| Mode M9 | |||
|---|---|---|---|
| Quadrant | BADHDUFLAG | Total packets | Discarded packets |
| A | 0 | 8 | 0 |
| B | 0 | 8 | 0 |
| C | 0 | 8 | 0 |
| D | 0 | 9 | 0 |
| Mode SS | |||
|---|---|---|---|
| Quadrant | BADHDUFLAG | Total packets | Discarded packets |
| A | 0 | 144 | 0 |
| B | 0 | 144 | 0 |
| C | 0 | 144 | 0 |
| D | 0 | 144 | 0 |
| Quadrant | Total seconds | Saturated seconds | Saturation percentage |
|---|---|---|---|
| A | 7012 | 147 | 2.096406% |
| B | 7012 | 64 | 0.912721% |
| C | 7012 | 69 | 0.984027% |
| D | 7012 | 41 | 0.584712% |
Noise dominated data is calculated using 1-second bins in cleaned event files. If a bin has >2000 counts, and if more than 50% of those come from <1% of pixels, then it is considered to be noise-dominated and hence unusable.
| Quadrant | # 1 sec bins | Bins with >0 counts | Bins with >2000 counts | High rate bins dominated by noise | Noise dominated (total time) | Noise dominated (detector-on time) | Marked lightcurve |
|---|---|---|---|---|---|---|---|
| A | 7662 | 7013 | 97 | 97 | 1.27% | 1.38% | 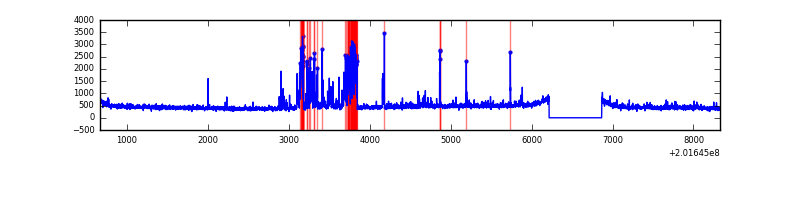 |
| B | 7662 | 7013 | 9 | 9 | 0.12% | 0.13% | 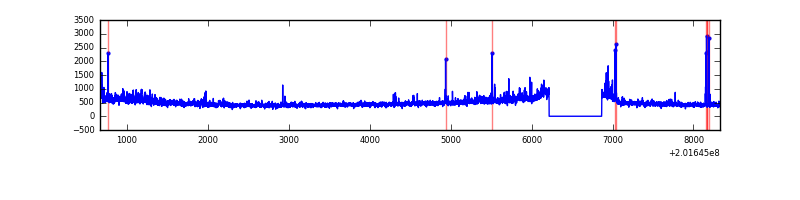 |
| C | 7662 | 7013 | 31 | 31 | 0.40% | 0.44% | 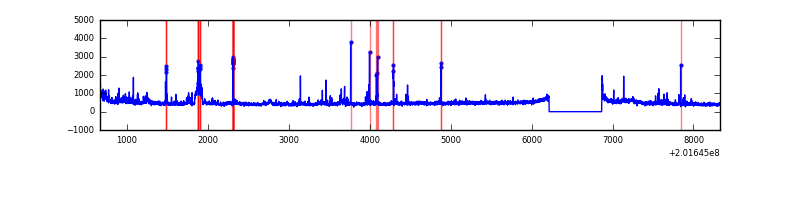 |
| D | 7662 | 7013 | 33 | 33 | 0.43% | 0.47% | 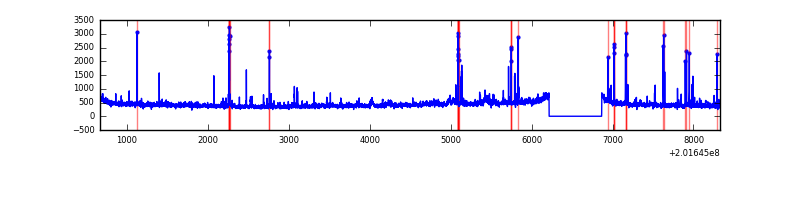 |
Top three noisy pixels from each quadrant. If the there are fewer than three noisy pixels in the level2.evt file, extra rows are filled as -1
| Pixel properties | Quadrant properties | ||||||
|---|---|---|---|---|---|---|---|
| Quadrant | DetID | PixID | Counts | Sigma | Mean | Median | Sigma |
| A | 0 | 50 | 486549 | 3072.23 | 774 | 756 | 158.1 |
| A | 8 | 15 | 49424 | 307.78 | 774 | 756 | 158.1 |
| A | 14 | 238 | 39989 | 248.12 | 774 | 756 | 158.1 |
| B | 15 | 204 | 268746 | 1738.38 | 793 | 773 | 154.2 |
| B | 0 | 228 | 44077 | 280.92 | 793 | 773 | 154.2 |
| B | 0 | 229 | 36396 | 231.09 | 793 | 773 | 154.2 |
| C | 1 | 192 | 392620 | 2193.02 | 764 | 768 | 178.7 |
| C | 1 | 16 | 147190 | 819.46 | 764 | 768 | 178.7 |
| C | 15 | 208 | 11266 | 58.75 | 764 | 768 | 178.7 |
| D | 13 | 223 | 66397 | 355.35 | 758 | 735 | 184.8 |
| D | 1 | 20 | 37752 | 200.33 | 758 | 735 | 184.8 |
| D | 2 | 37 | 34643 | 183.5 | 758 | 735 | 184.8 |
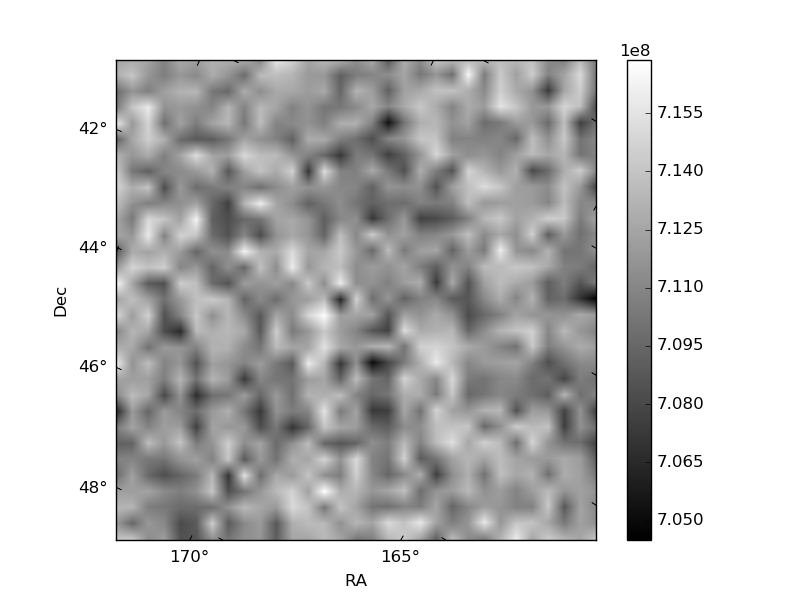
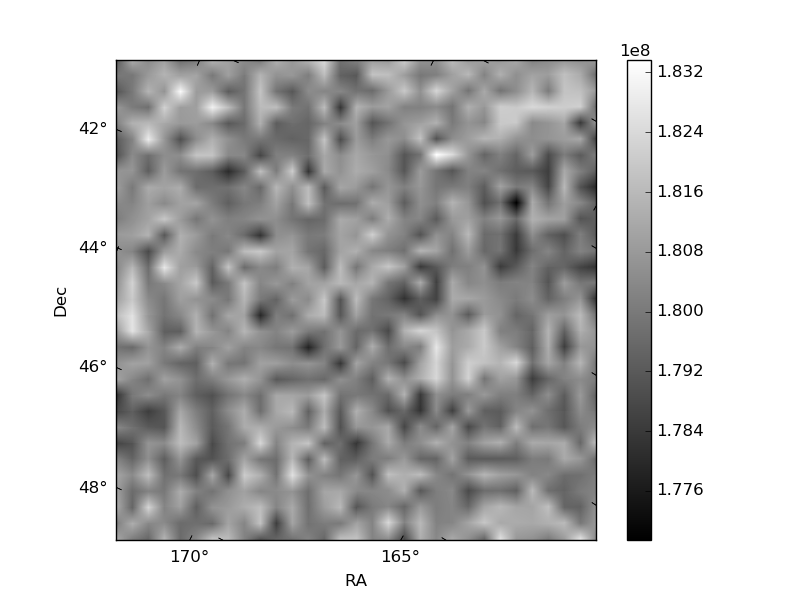
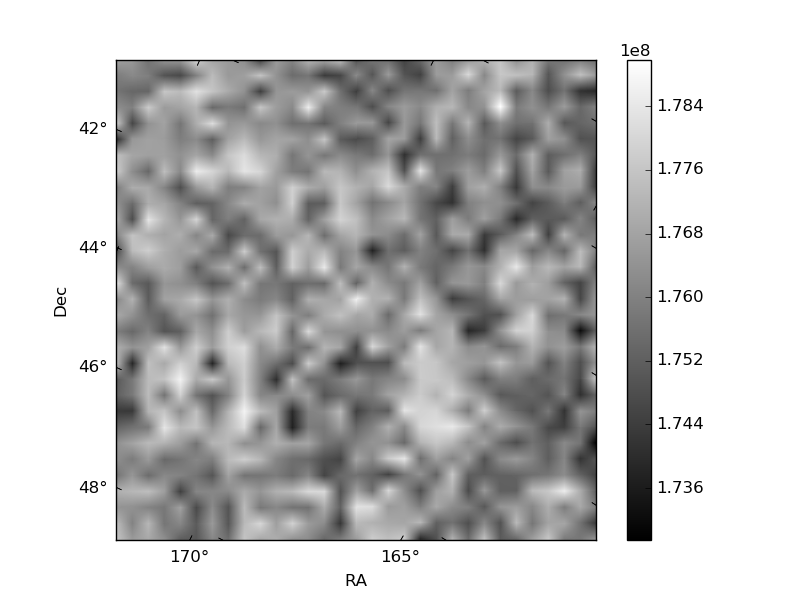
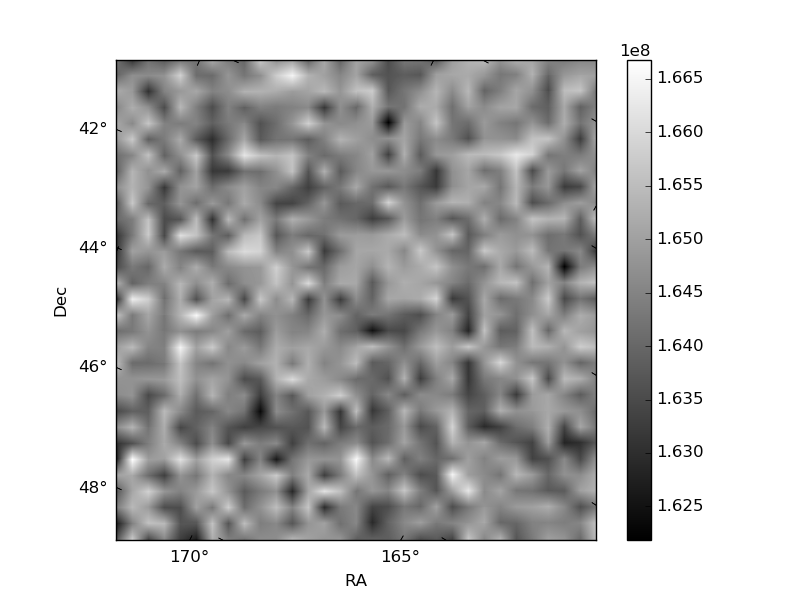
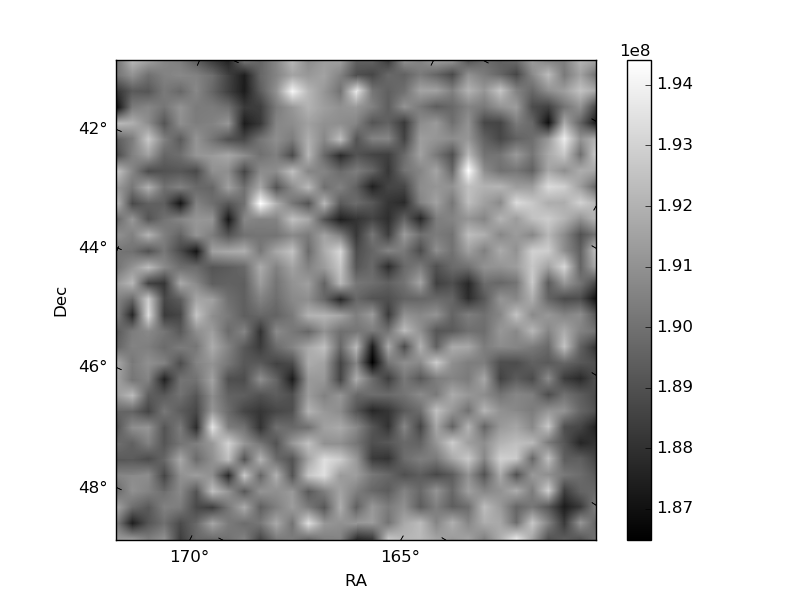
Histogram calculated using DETX and DETY for each event in the final _common_clean file
| Quadrant A | 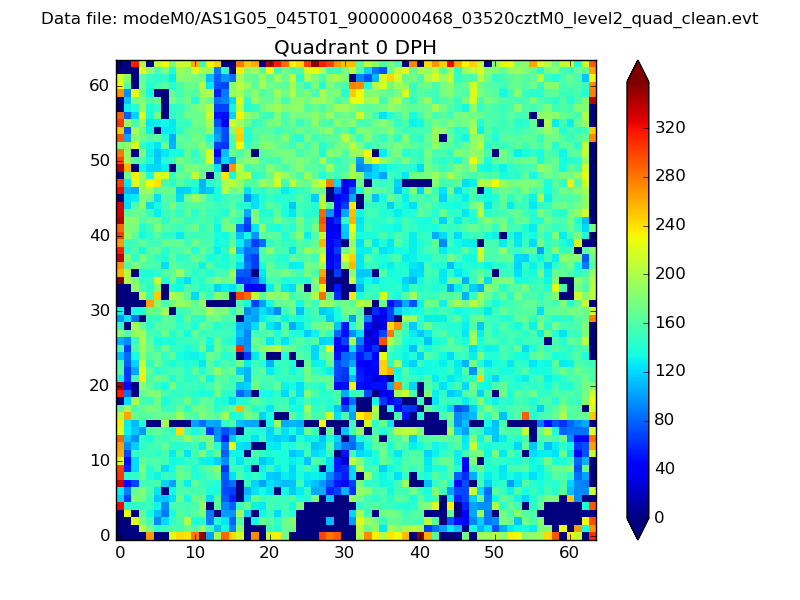 |
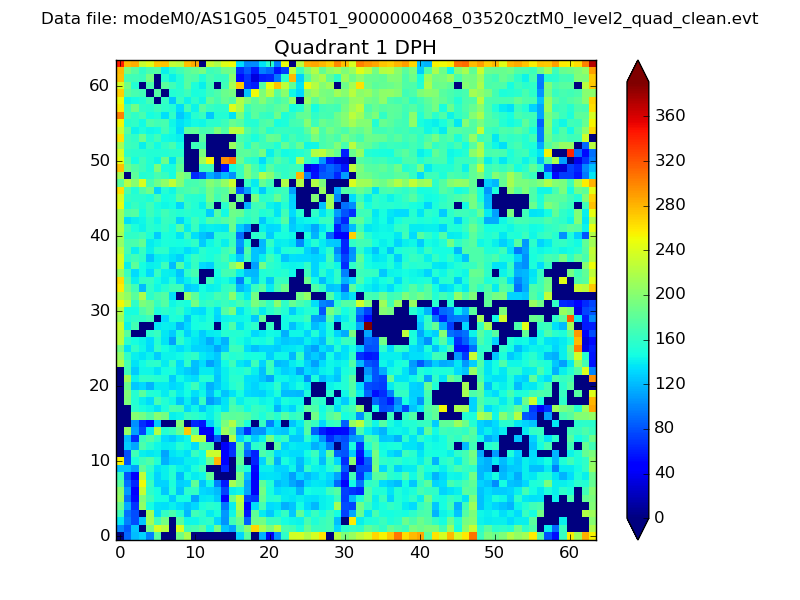 |
Quadrant B |
|---|---|---|---|
| Quadrant D | 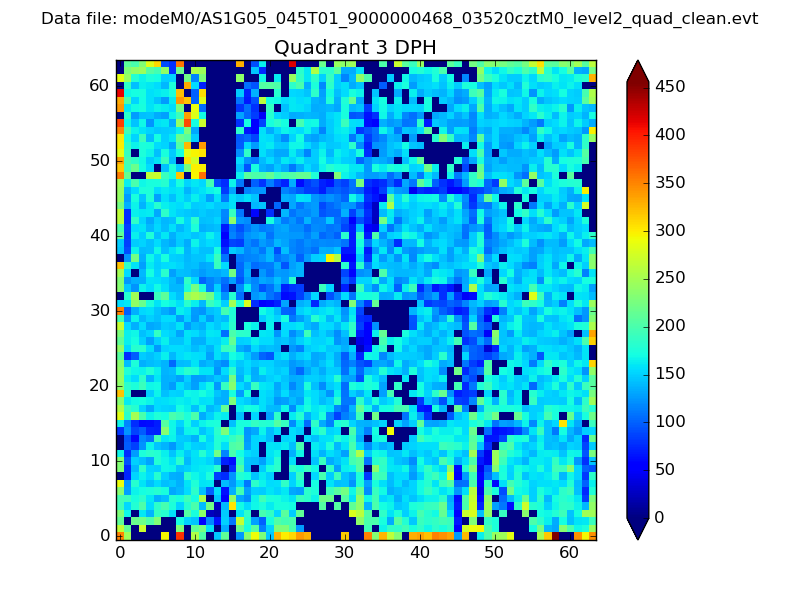 |
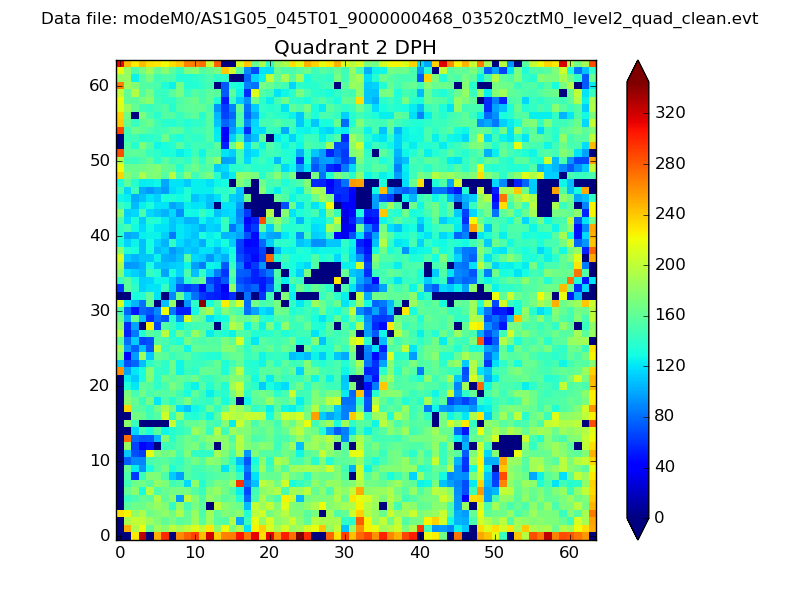 |
Quadrant C |
| Plot type | Count rate plots | Images |
|---|---|---|
| Comparison with Poisson distribution Blue bars denote a histogram of data divided into 1 sec bins. Red curve is a Poisson curve with rate = median count rate of data. |
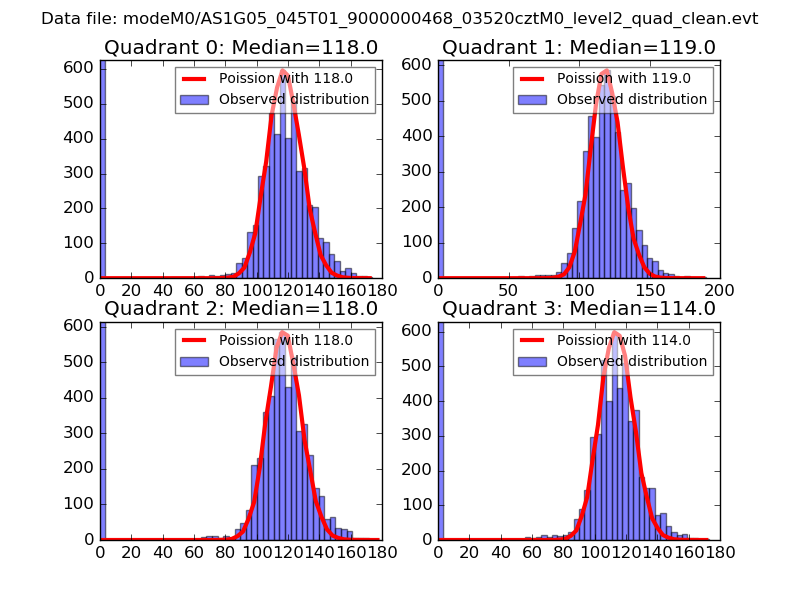 |
 |
| Quadrant-wise count rates Data is divided into 100 sec bins |
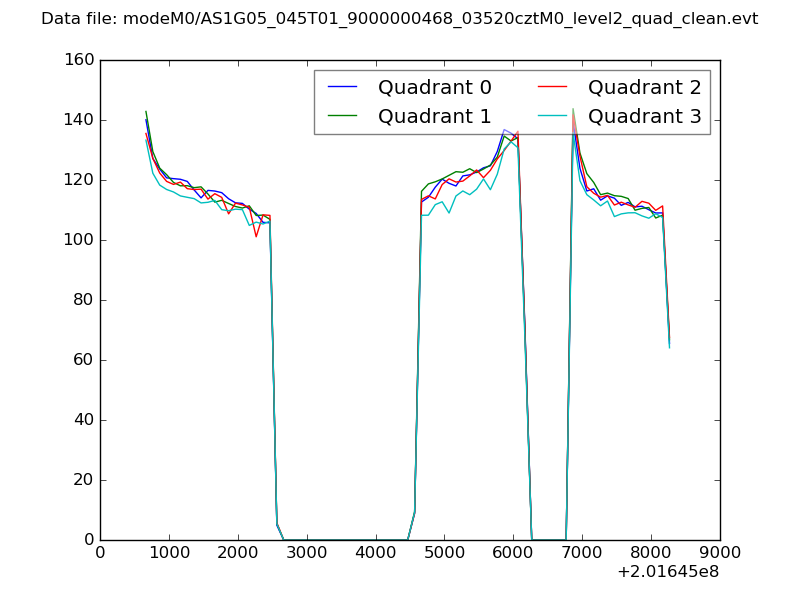 |
|
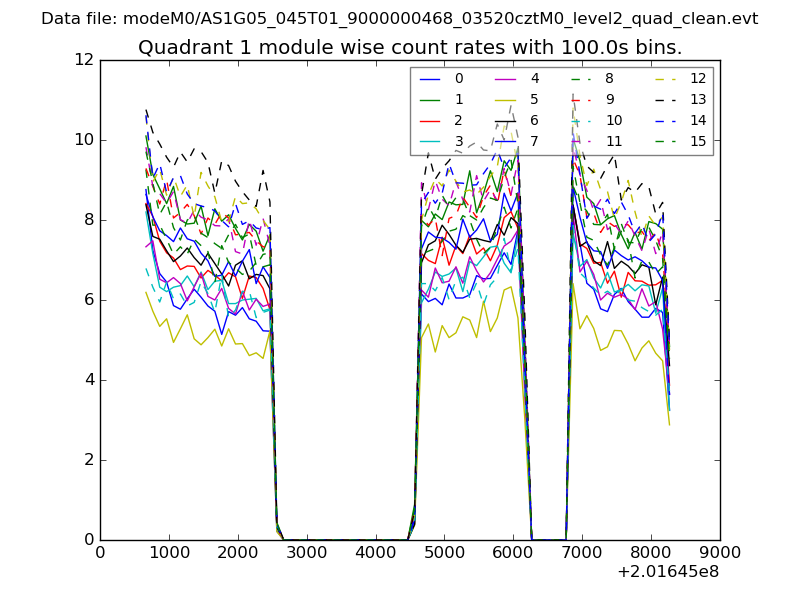
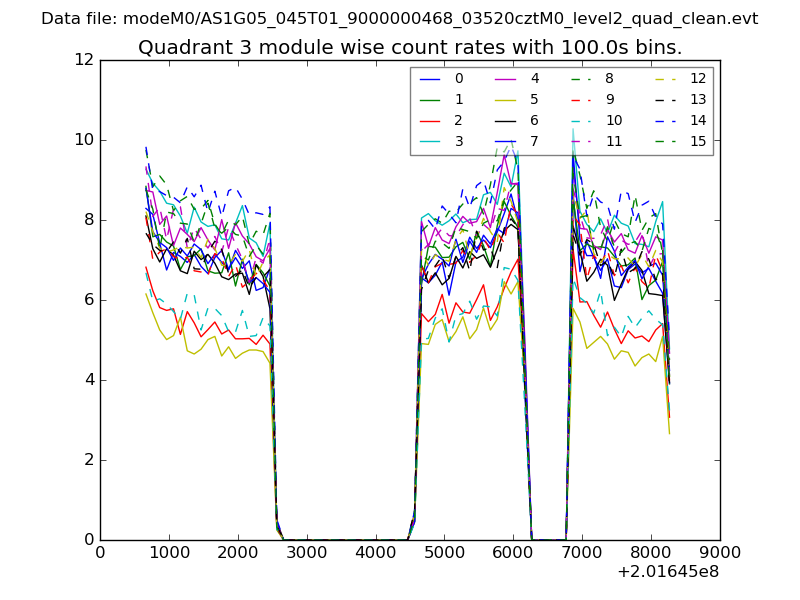
| Module-wise count rates for Quadrant A Data is divided into 100 sec bins |
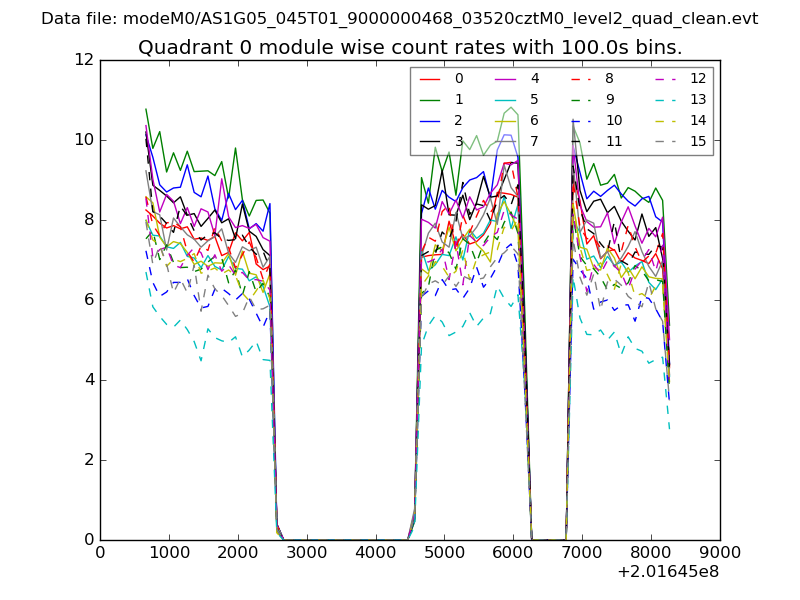 |
 |
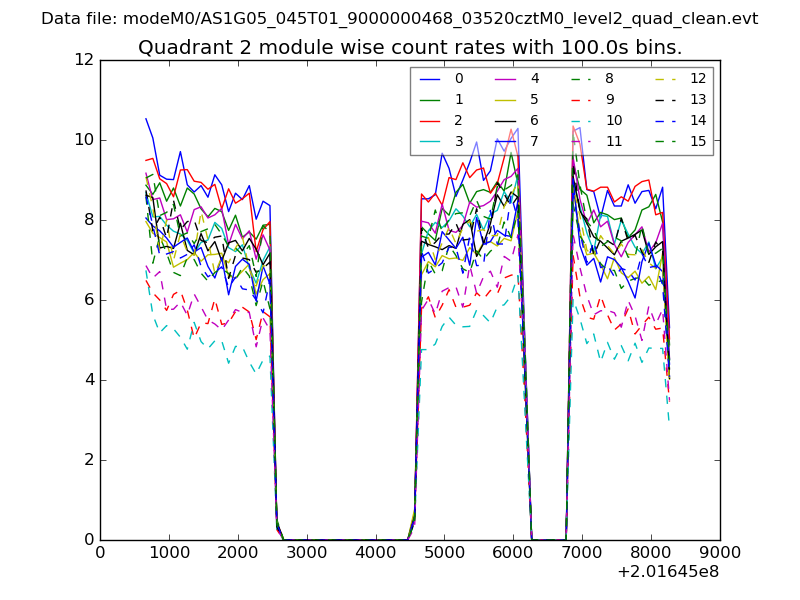
| Module-wise count rates for Quadrant B Data is divided into 100 sec bins |
 |
 |
| Module-wise count rates for Quadrant C Data is divided into 100 sec bins |
 |
 |
| Module-wise count rates for Quadrant D Data is divided into 100 sec bins |
 |
 |
| Parameter | Plot |
|---|---|
| CZT HV Monitor | 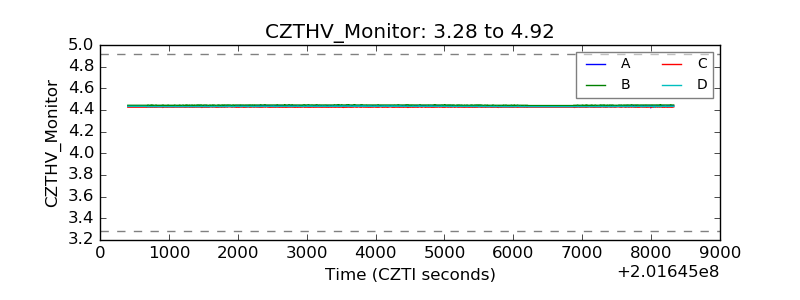 |
| D_VDD | 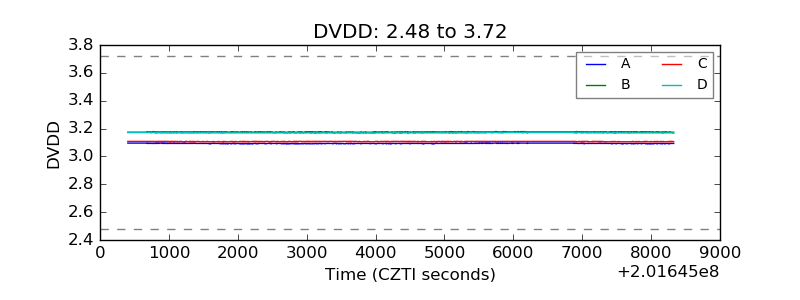 |
| Temperature 1 | 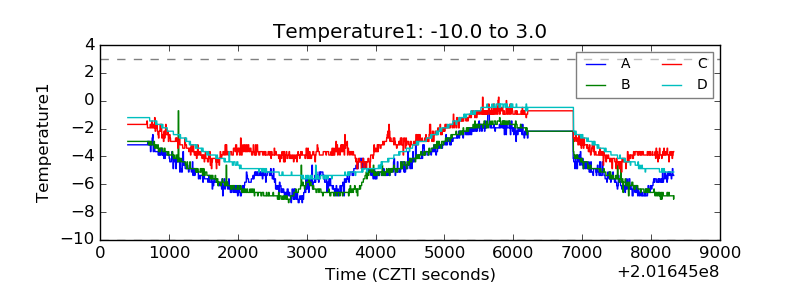 |
| Veto HV Monitor | 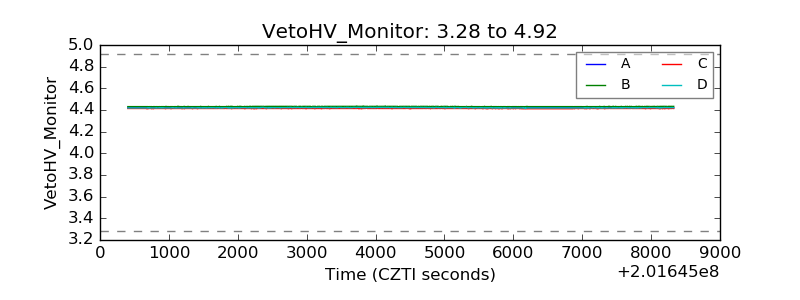 |
| Veto LLD | 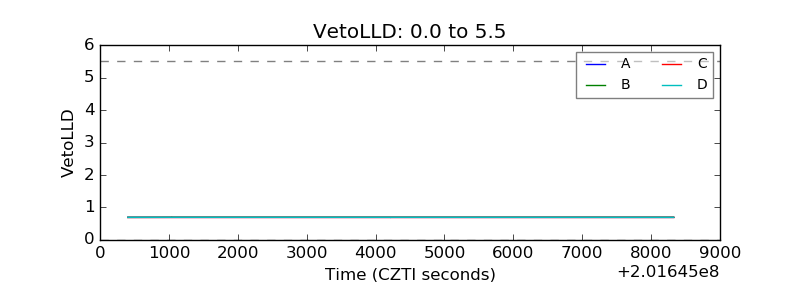 |
| Alpha Counter | 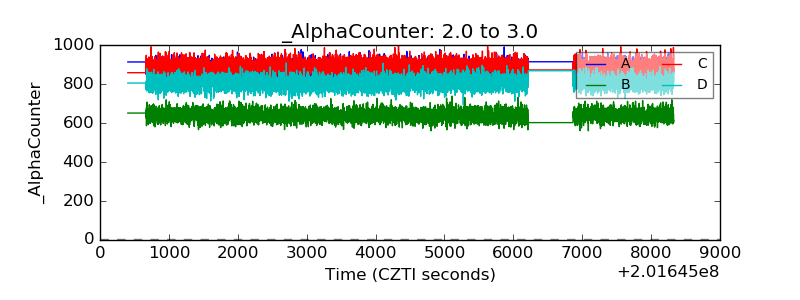 |
| _CPM_Rate | 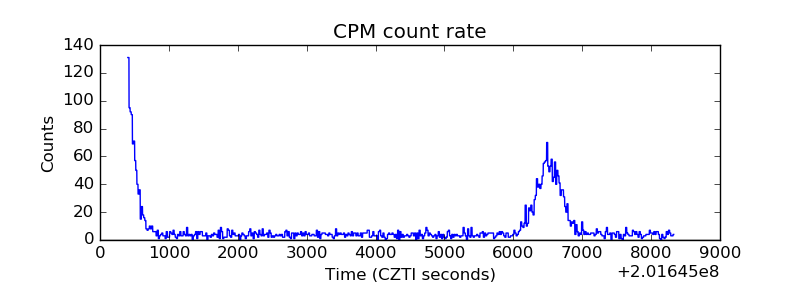 |
| CZT Counter | 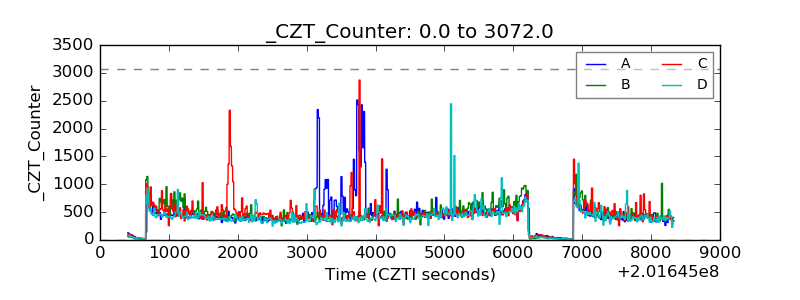 |
| +2.5 Volts monitor |  |
| +5 Volts monitor |  |
| _ROLL_ROT | 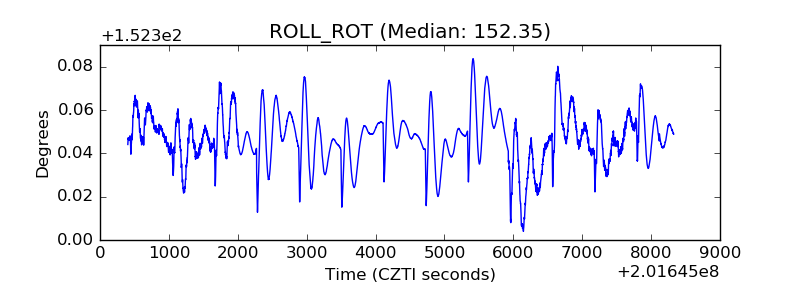 |
| _Roll_DEC | 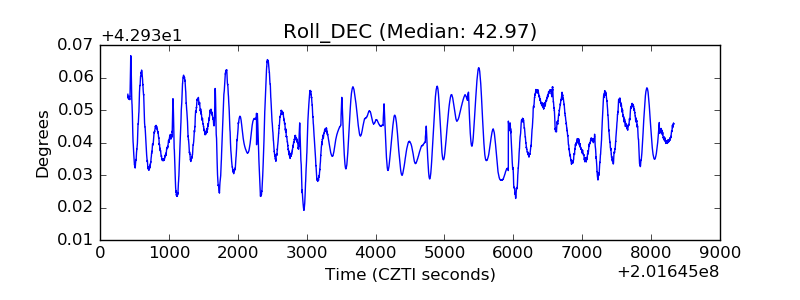 |
| _Roll_RA | 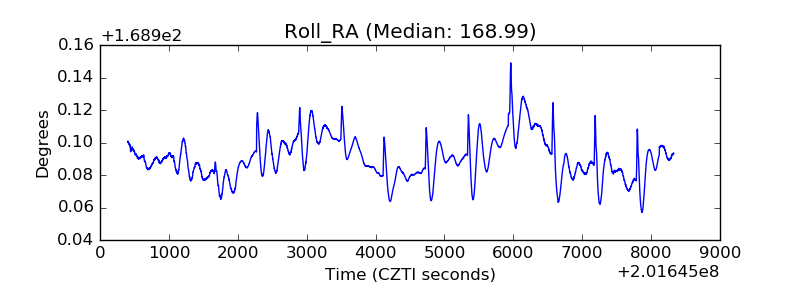 |
| Veto Counter | 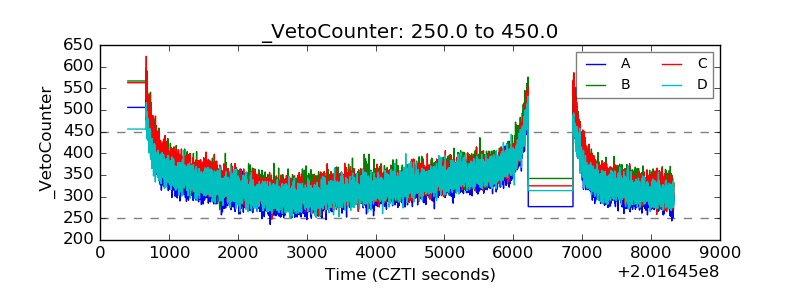 |