| Param | Original file | Final file |
|---|---|---|
| Filename | modeM0/AS1G05_045T01_9000000468_03522cztM0_level2.evt | modeM0/AS1G05_045T01_9000000468_03522cztM0_level2_quad_clean.evt |
| Size (bytes) | 612,682,560 | 109,514,880 |
| Size | 584.3 MB | 104.4 MB |
| Events in quadrant A | 4,738,230 | 680,941 |
| Events in quadrant B | 4,847,640 | 686,561 |
| Events in quadrant C | 4,128,946 | 683,853 |
| Events in quadrant D | 4,252,969 | 664,138 |
| Mode M0 | |||
|---|---|---|---|
| Quadrant | BADHDUFLAG | Total packets | Discarded packets |
| A | 0 | 20276 | 3 |
| B | 0 | 20334 | 2 |
| C | 0 | 18377 | 2 |
| D | 0 | 19318 | 2 |
| Mode M9 | |||
|---|---|---|---|
| Quadrant | BADHDUFLAG | Total packets | Discarded packets |
| A | 0 | 1 | 0 |
| B | 0 | 1 | 0 |
| C | 0 | 1 | 0 |
| D | 0 | 1 | 0 |
| Mode SS | |||
|---|---|---|---|
| Quadrant | BADHDUFLAG | Total packets | Discarded packets |
| A | 0 | 178 | 0 |
| B | 0 | 178 | 0 |
| C | 0 | 178 | 0 |
| D | 0 | 178 | 0 |
| Quadrant | Total seconds | Saturated seconds | Saturation percentage |
|---|---|---|---|
| A | 8647 | 351 | 4.059211% |
| B | 8647 | 294 | 3.400023% |
| C | 8647 | 88 | 1.017694% |
| D | 8647 | 97 | 1.121776% |
Noise dominated data is calculated using 1-second bins in cleaned event files. If a bin has >2000 counts, and if more than 50% of those come from <1% of pixels, then it is considered to be noise-dominated and hence unusable.
| Quadrant | # 1 sec bins | Bins with >0 counts | Bins with >2000 counts | High rate bins dominated by noise | Noise dominated (total time) | Noise dominated (detector-on time) | Marked lightcurve |
|---|---|---|---|---|---|---|---|
| A | 8817 | 8649 | 160 | 160 | 1.81% | 1.85% | 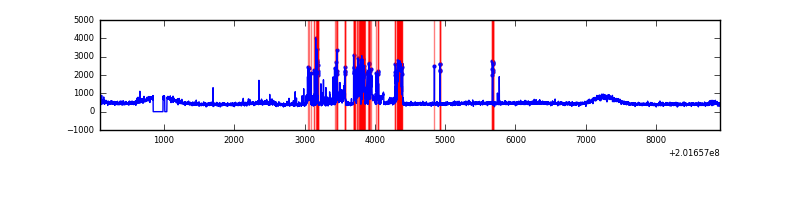 |
| B | 8817 | 8648 | 24 | 24 | 0.27% | 0.28% | 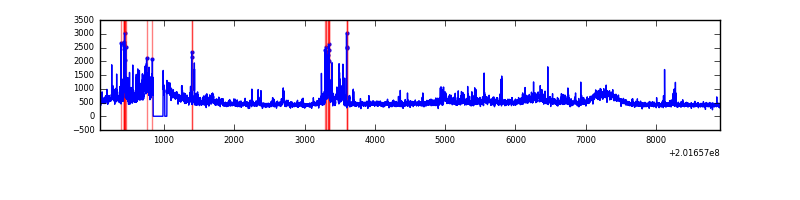 |
| C | 8817 | 8649 | 13 | 13 | 0.15% | 0.15% | 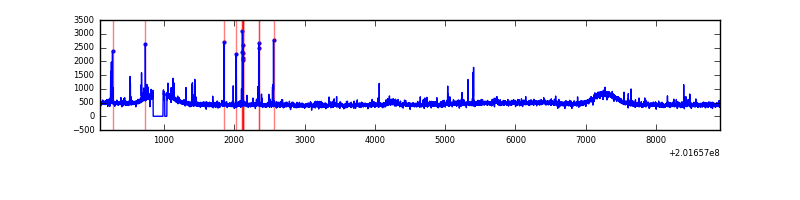 |
| D | 8817 | 8649 | 61 | 61 | 0.69% | 0.71% |  |
Top three noisy pixels from each quadrant. If the there are fewer than three noisy pixels in the level2.evt file, extra rows are filled as -1
| Pixel properties | Quadrant properties | ||||||
|---|---|---|---|---|---|---|---|
| Quadrant | DetID | PixID | Counts | Sigma | Mean | Median | Sigma |
| A | 0 | 50 | 796455 | 3906.57 | 990 | 964 | 203.6 |
| A | 8 | 15 | 79354 | 384.96 | 990 | 964 | 203.6 |
| A | 15 | 174 | 28784 | 136.62 | 990 | 964 | 203.6 |
| B | 15 | 204 | 473517 | 2379.01 | 1014 | 985 | 198.6 |
| B | 2 | 249 | 141200 | 705.93 | 1014 | 985 | 198.6 |
| B | 4 | 81 | 132844 | 663.86 | 1014 | 985 | 198.6 |
| C | 15 | 208 | 88628 | 377.62 | 987 | 990 | 232.1 |
| C | 14 | 223 | 52145 | 220.42 | 987 | 990 | 232.1 |
| C | 1 | 192 | 45829 | 193.21 | 987 | 990 | 232.1 |
| D | 5 | 233 | 221374 | 929.46 | 976 | 944 | 237.2 |
| D | 13 | 223 | 139944 | 586.11 | 976 | 944 | 237.2 |
| D | 12 | 110 | 103738 | 433.44 | 976 | 944 | 237.2 |
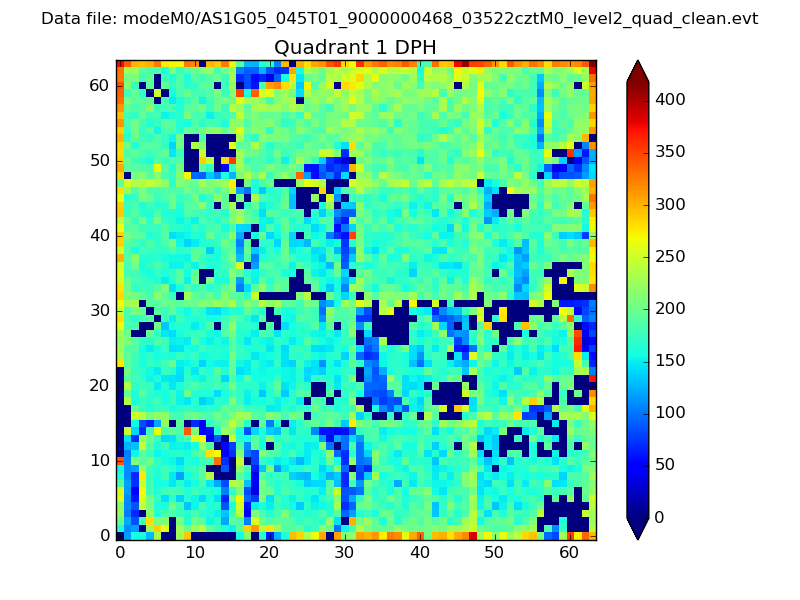
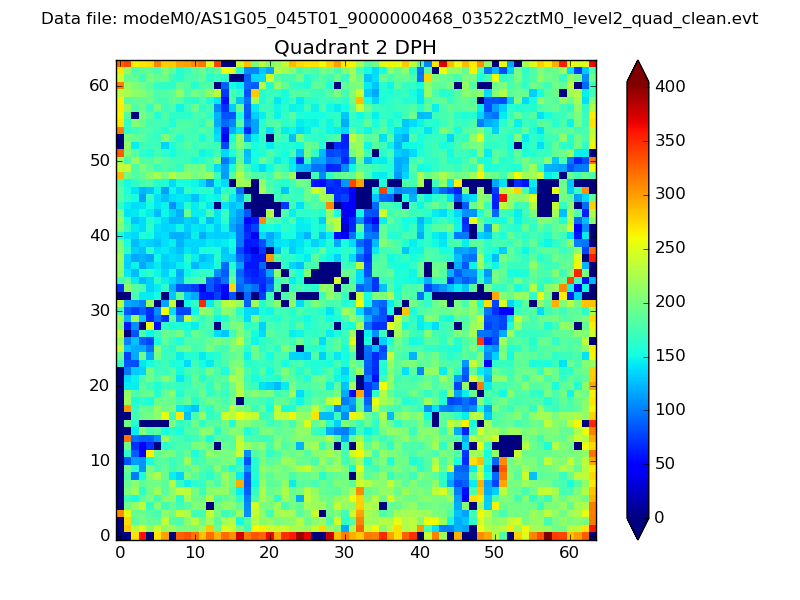
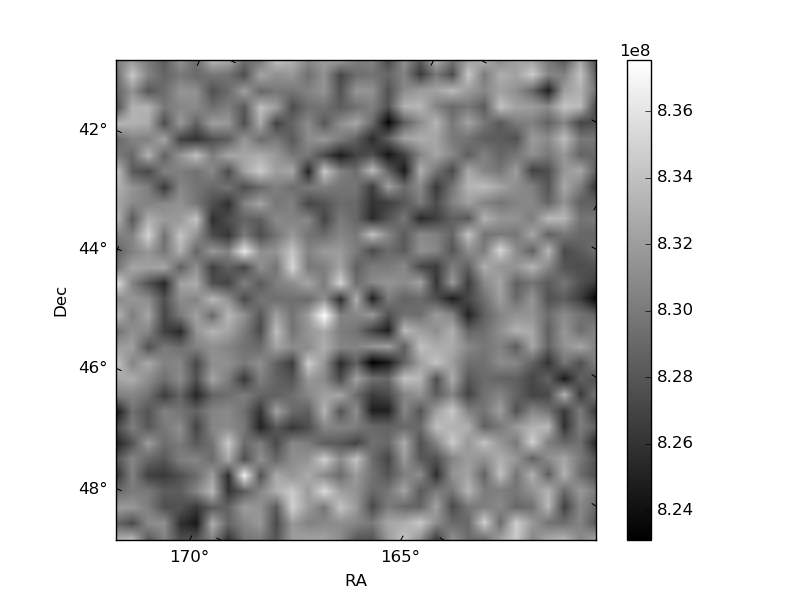
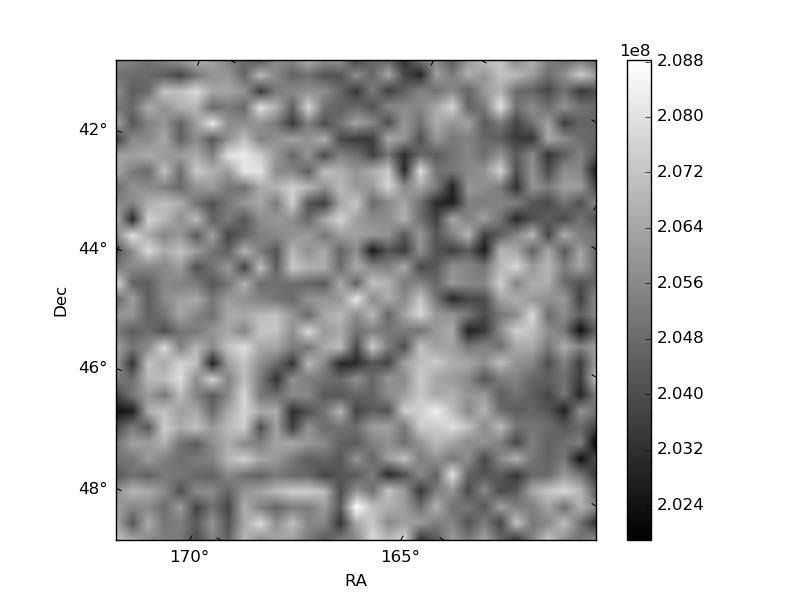
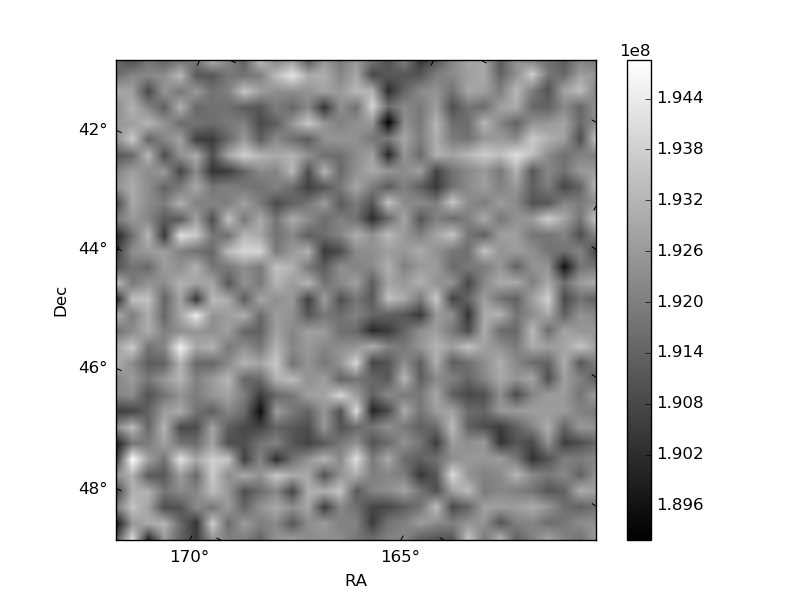
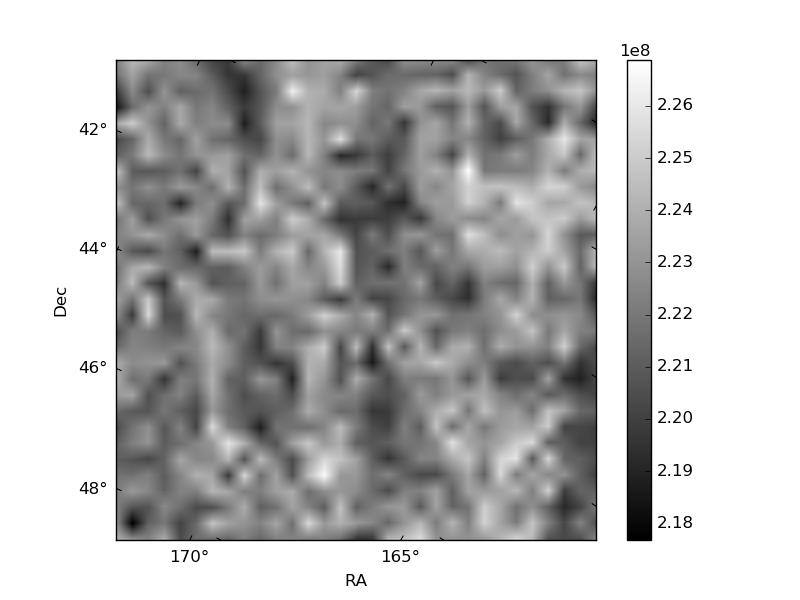
Histogram calculated using DETX and DETY for each event in the final _common_clean file
| Quadrant A | 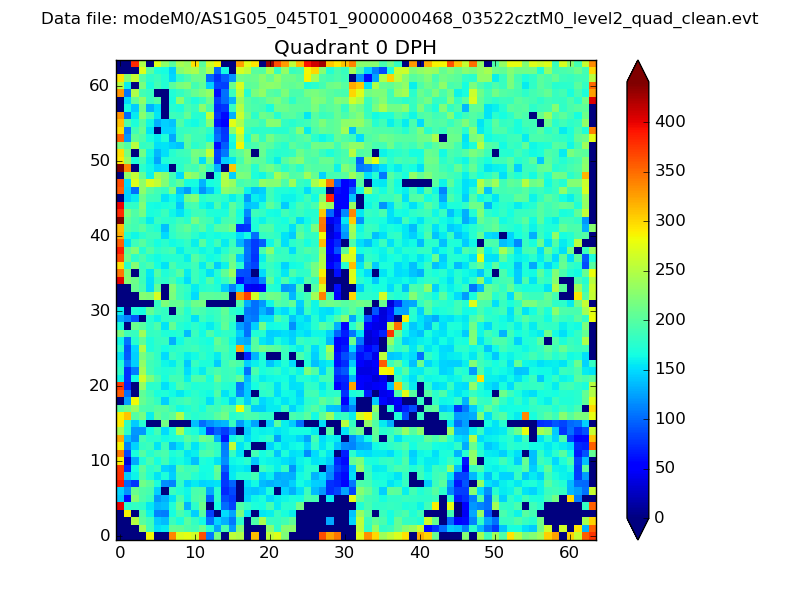 |
 |
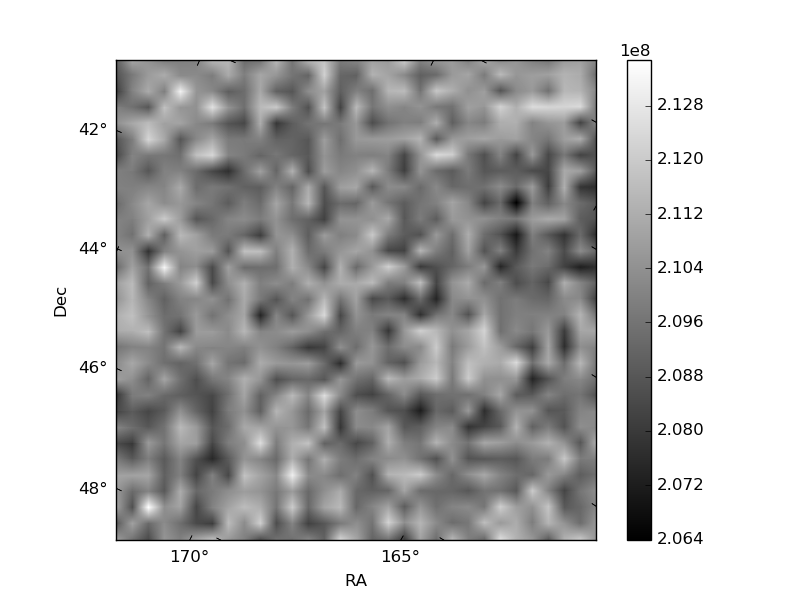
Quadrant B |
|---|---|---|---|
| Quadrant D | 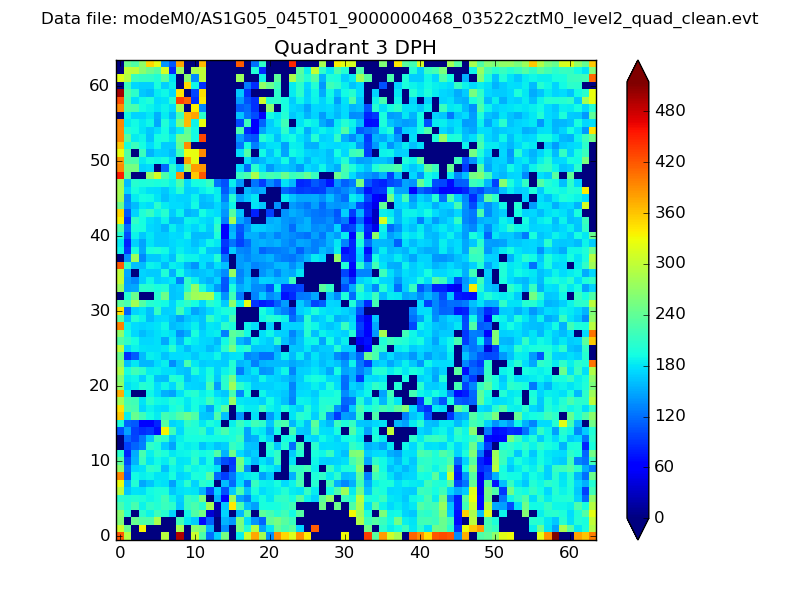 |
 |
Quadrant C |
| Plot type | Count rate plots | Images |
|---|---|---|
| Comparison with Poisson distribution Blue bars denote a histogram of data divided into 1 sec bins. Red curve is a Poisson curve with rate = median count rate of data. |
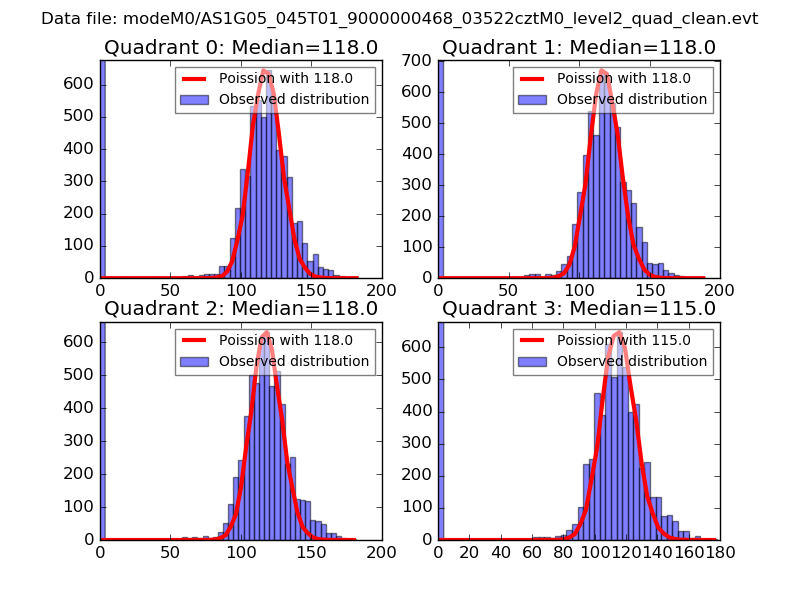 |
 |
| Quadrant-wise count rates Data is divided into 100 sec bins |
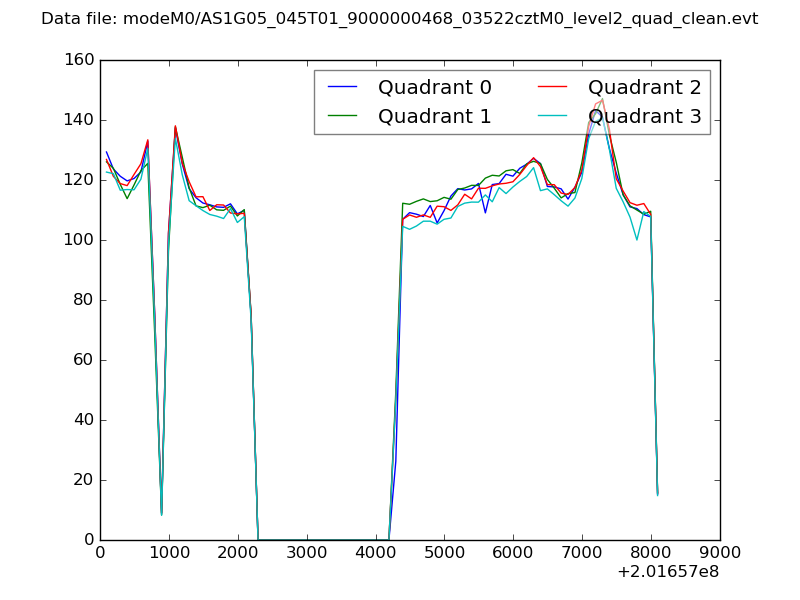 |
|
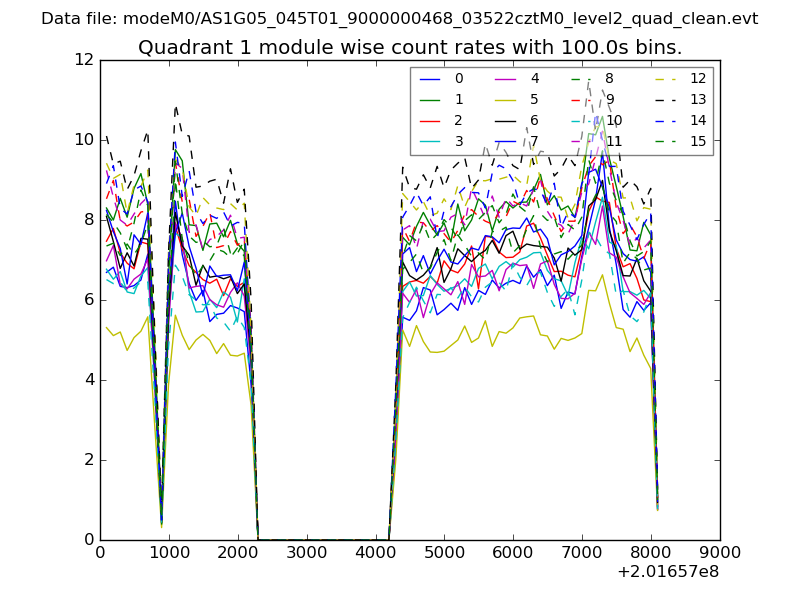
| Module-wise count rates for Quadrant A Data is divided into 100 sec bins |
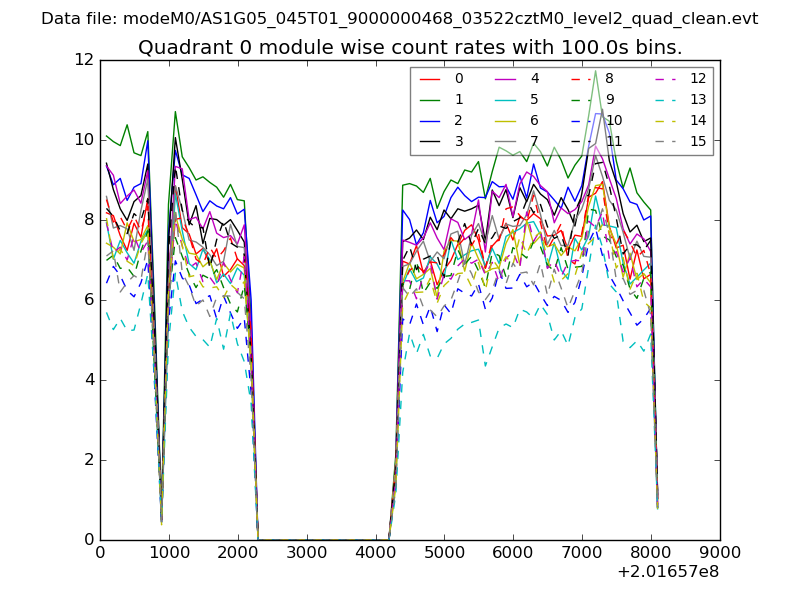 |
 |
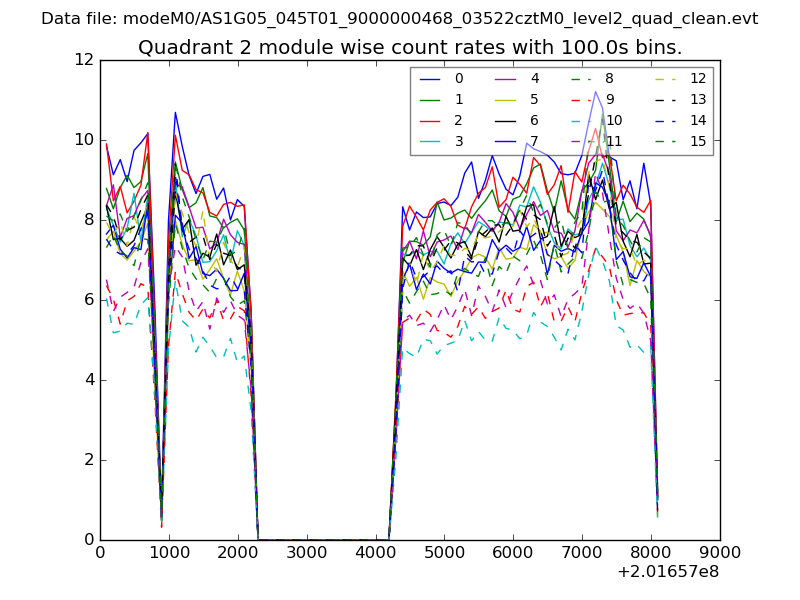
| Module-wise count rates for Quadrant B Data is divided into 100 sec bins |
 |
 |
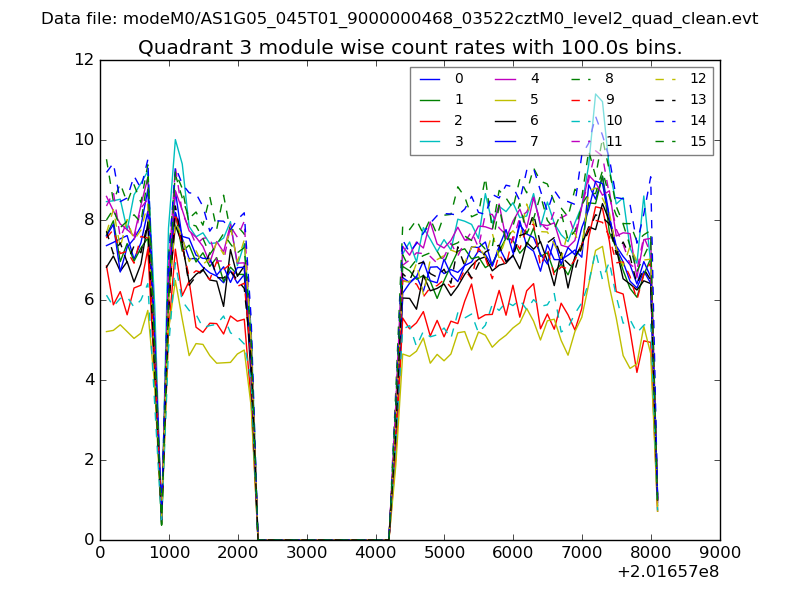
| Module-wise count rates for Quadrant C Data is divided into 100 sec bins |
 |
 |
| Module-wise count rates for Quadrant D Data is divided into 100 sec bins |
 |
 |
| Parameter | Plot |
|---|---|
| CZT HV Monitor | 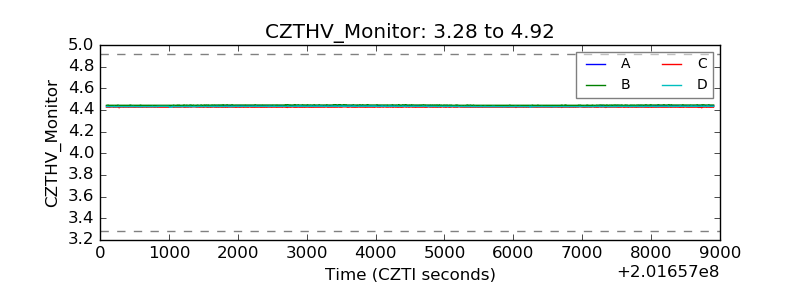 |
| D_VDD | 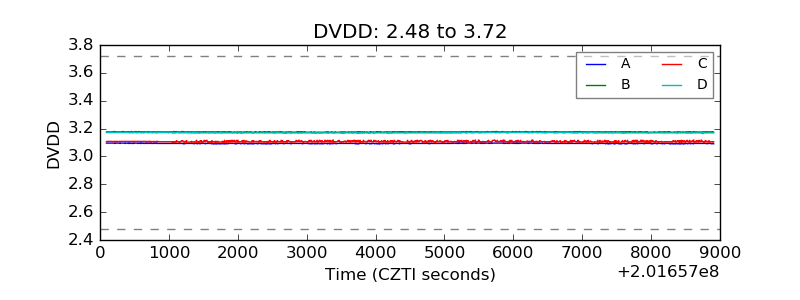 |
| Temperature 1 | 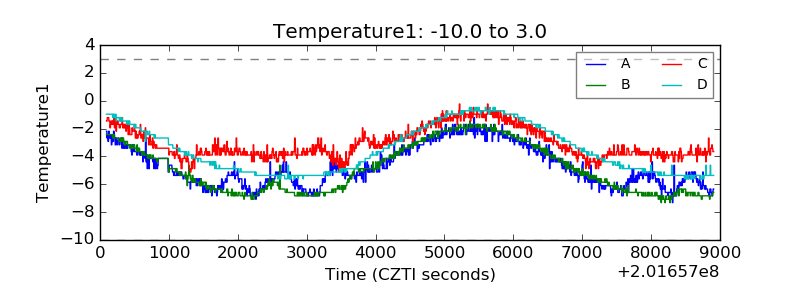 |
| Veto HV Monitor | 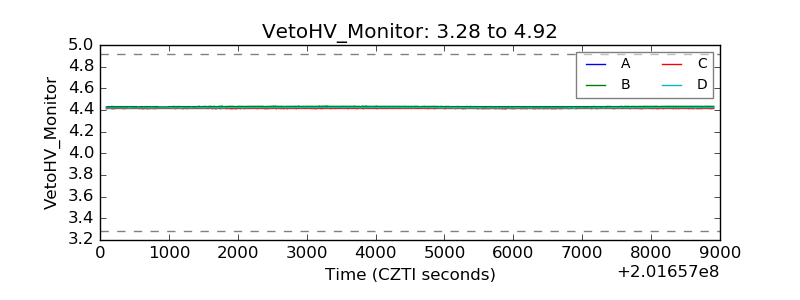 |
| Veto LLD | 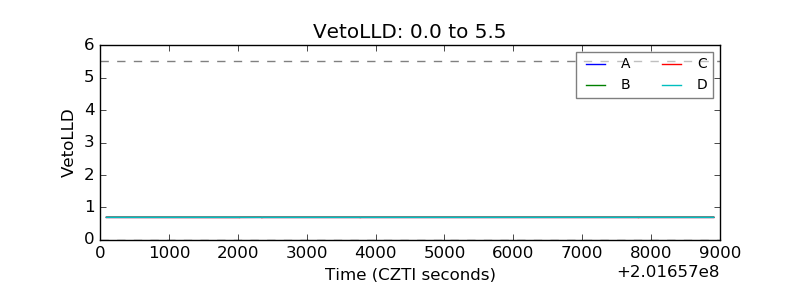 |
| Alpha Counter | 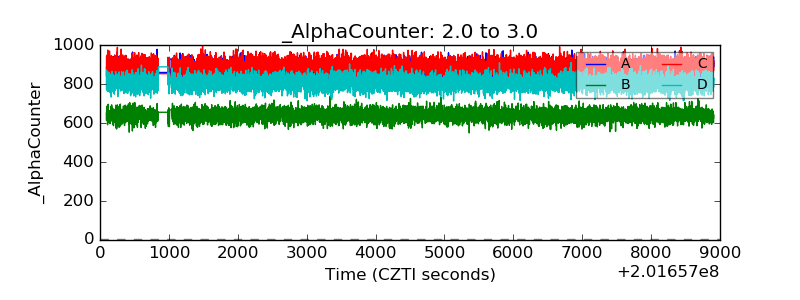 |
| _CPM_Rate | 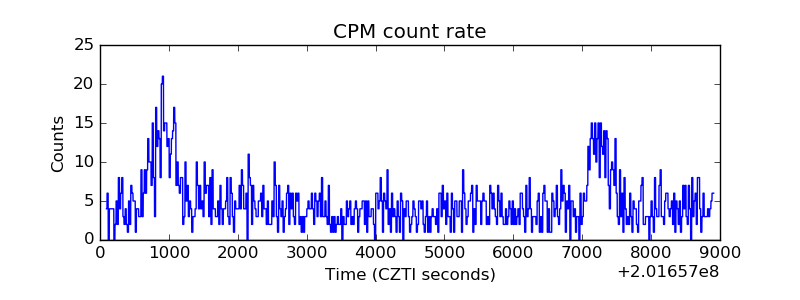 |
| CZT Counter | 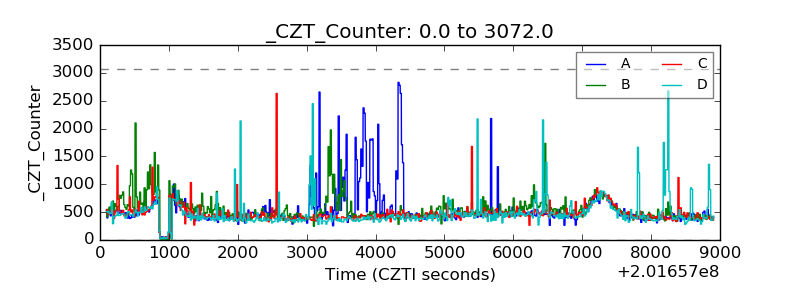 |
| +2.5 Volts monitor |  |
| +5 Volts monitor |  |
| _ROLL_ROT | 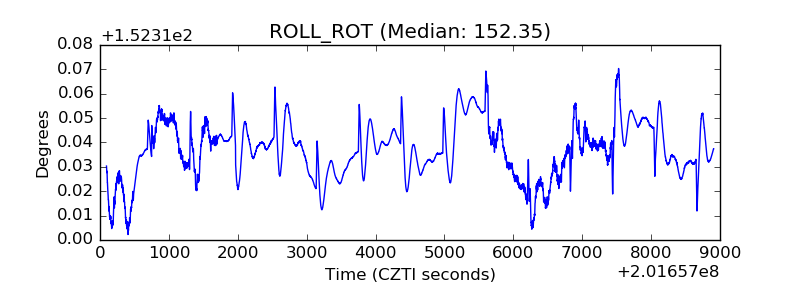 |
| _Roll_DEC | 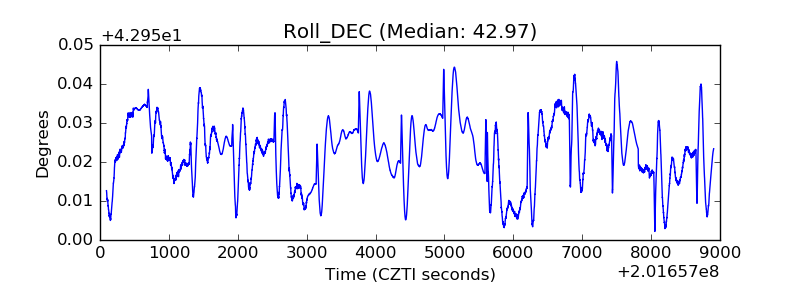 |
| _Roll_RA | 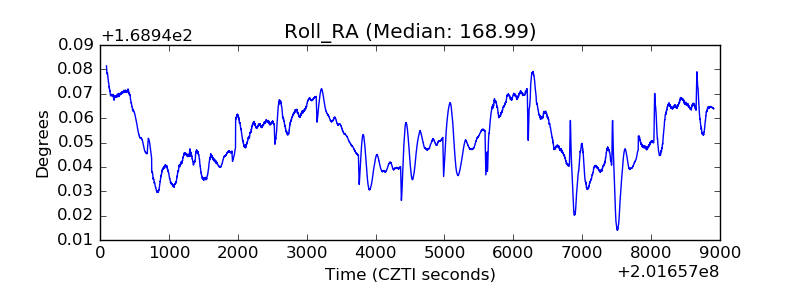 |
| Veto Counter | 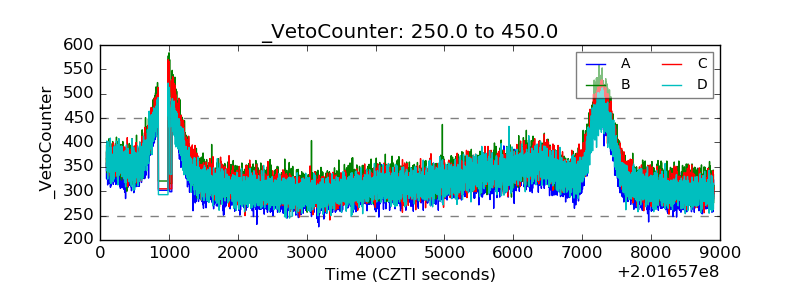 |