| Param | Original file | Final file |
|---|---|---|
| Filename | modeM0/AS1G05_045T01_9000000468_03523cztM0_level2.evt | modeM0/AS1G05_045T01_9000000468_03523cztM0_level2_quad_clean.evt |
| Size (bytes) | 504,812,160 | 81,374,400 |
| Size | 481.4 MB | 77.6 MB |
| Events in quadrant A | 3,545,658 | 484,573 |
| Events in quadrant B | 4,066,655 | 486,171 |
| Events in quadrant C | 3,436,310 | 485,692 |
| Events in quadrant D | 3,713,820 | 469,479 |
| Mode M0 | |||
|---|---|---|---|
| Quadrant | BADHDUFLAG | Total packets | Discarded packets |
| A | 0 | 16218 | 2 |
| B | 0 | 17373 | 1 |
| C | 0 | 15949 | 1 |
| D | 0 | 17053 | 1 |
| Mode M9 | |||
|---|---|---|---|
| Quadrant | BADHDUFLAG | Total packets | Discarded packets |
| A | 0 | 3 | 0 |
| B | 0 | 3 | 0 |
| C | 0 | 3 | 0 |
| D | 0 | 3 | 0 |
| Mode SS | |||
|---|---|---|---|
| Quadrant | BADHDUFLAG | Total packets | Discarded packets |
| A | 0 | 158 | 0 |
| B | 0 | 158 | 0 |
| C | 0 | 158 | 0 |
| D | 0 | 158 | 0 |
| Quadrant | Total seconds | Saturated seconds | Saturation percentage |
|---|---|---|---|
| A | 7733 | 79 | 1.021596% |
| B | 7733 | 123 | 1.590586% |
| C | 7733 | 35 | 0.452606% |
| D | 7733 | 104 | 1.344886% |
Noise dominated data is calculated using 1-second bins in cleaned event files. If a bin has >2000 counts, and if more than 50% of those come from <1% of pixels, then it is considered to be noise-dominated and hence unusable.
| Quadrant | # 1 sec bins | Bins with >0 counts | Bins with >2000 counts | High rate bins dominated by noise | Noise dominated (total time) | Noise dominated (detector-on time) | Marked lightcurve |
|---|---|---|---|---|---|---|---|
| A | 8043 | 7733 | 7 | 7 | 0.09% | 0.09% | 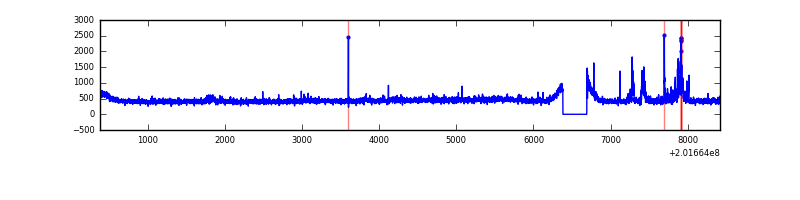 |
| B | 8043 | 7733 | 46 | 46 | 0.57% | 0.59% | 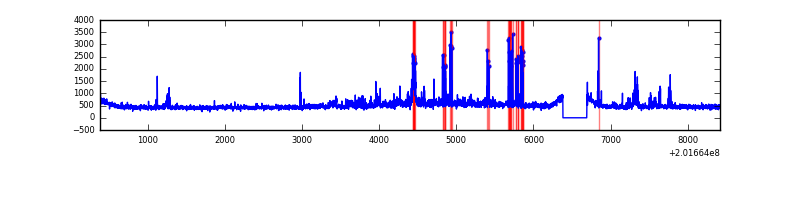 |
| C | 8043 | 7734 | 4 | 4 | 0.05% | 0.05% | 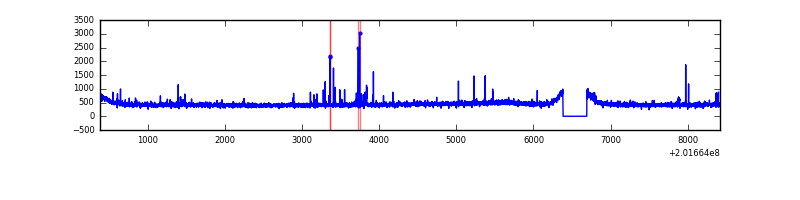 |
| D | 8043 | 7733 | 68 | 68 | 0.85% | 0.88% | 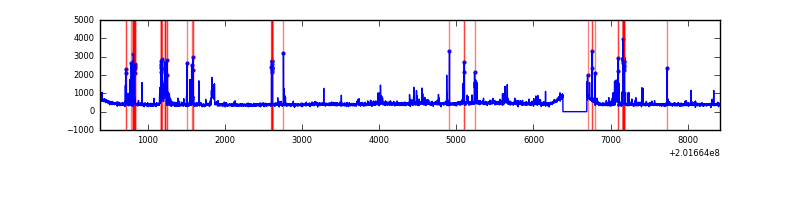 |
Top three noisy pixels from each quadrant. If the there are fewer than three noisy pixels in the level2.evt file, extra rows are filled as -1
| Pixel properties | Quadrant properties | ||||||
|---|---|---|---|---|---|---|---|
| Quadrant | DetID | PixID | Counts | Sigma | Mean | Median | Sigma |
| A | 0 | 50 | 169852 | 945.56 | 863 | 840 | 178.7 |
| A | 8 | 15 | 38008 | 207.94 | 863 | 840 | 178.7 |
| A | 0 | 226 | 9367 | 47.71 | 863 | 840 | 178.7 |
| B | 15 | 204 | 288611 | 1672.02 | 876 | 854 | 172.1 |
| B | 14 | 167 | 140580 | 811.88 | 876 | 854 | 172.1 |
| B | 15 | 85 | 94019 | 541.34 | 876 | 854 | 172.1 |
| C | 14 | 223 | 34376 | 167.94 | 845 | 846 | 199.7 |
| C | 15 | 208 | 28830 | 140.16 | 845 | 846 | 199.7 |
| C | 8 | 128 | 17798 | 84.9 | 845 | 846 | 199.7 |
| D | 5 | 233 | 242527 | 1200.34 | 833 | 808 | 201.4 |
| D | 2 | 31 | 149472 | 738.25 | 833 | 808 | 201.4 |
| D | 13 | 223 | 107174 | 528.2 | 833 | 808 | 201.4 |
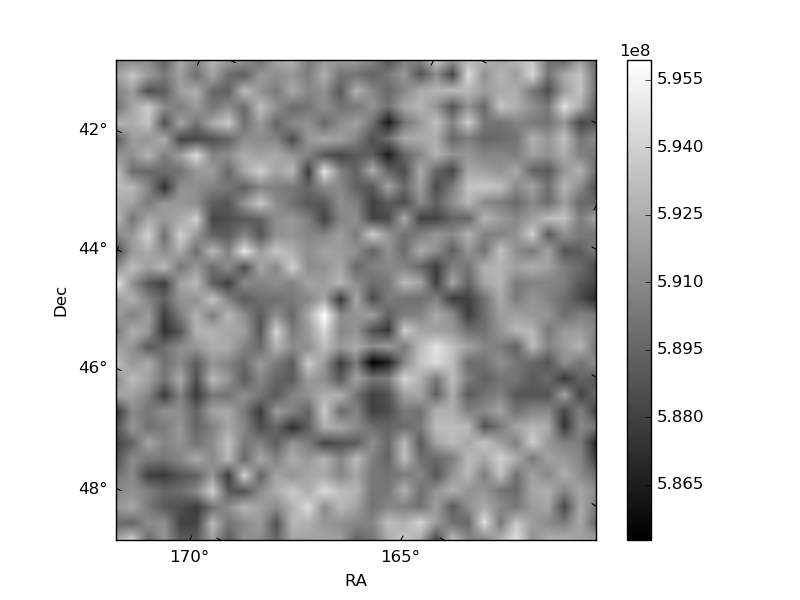
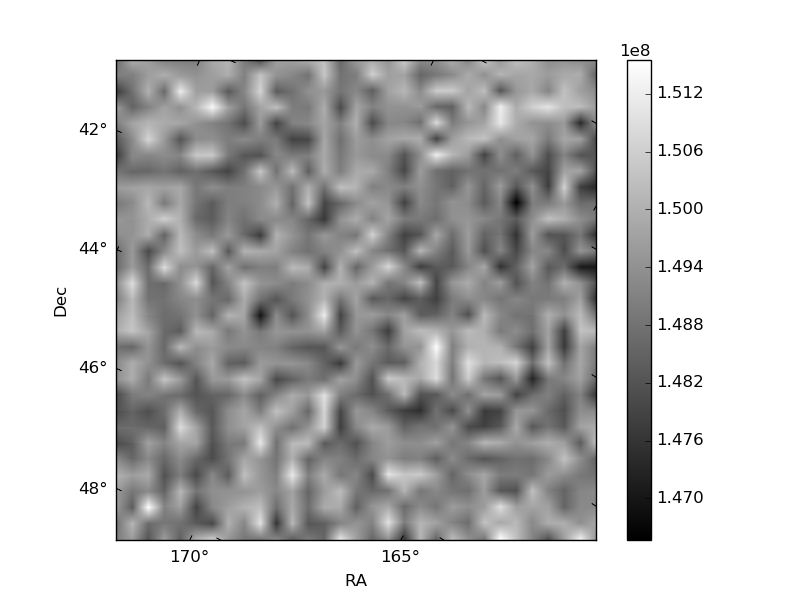
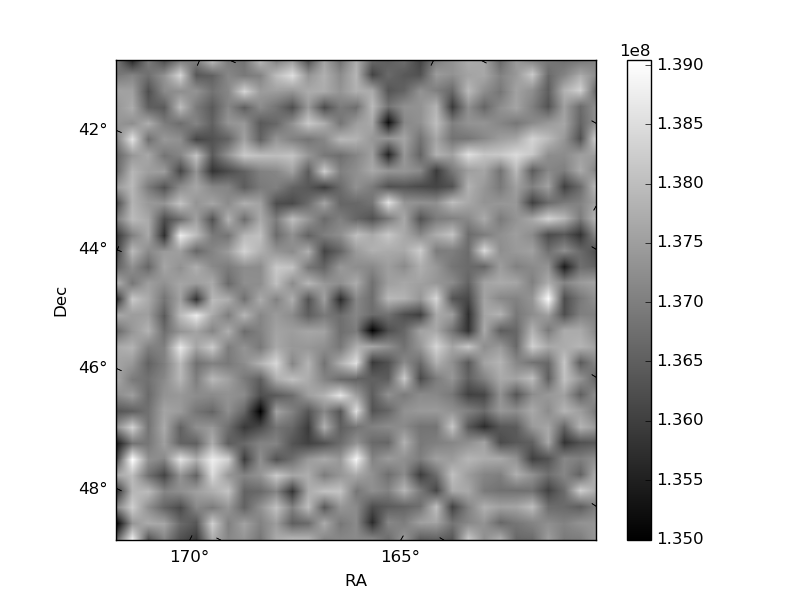
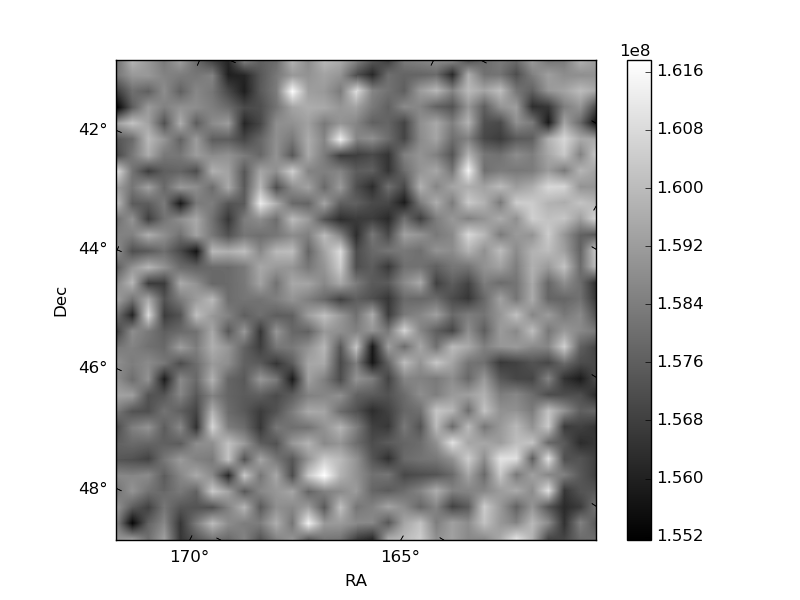
Histogram calculated using DETX and DETY for each event in the final _common_clean file
| Quadrant A | 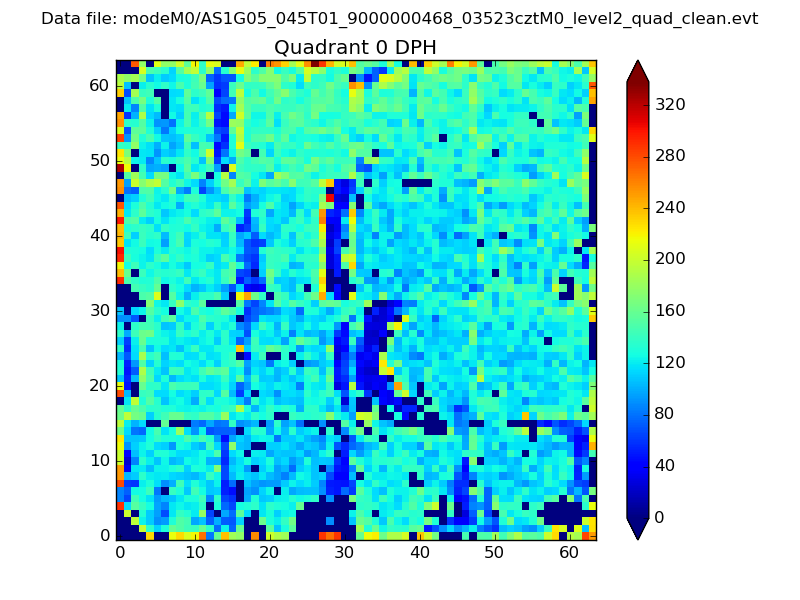 |
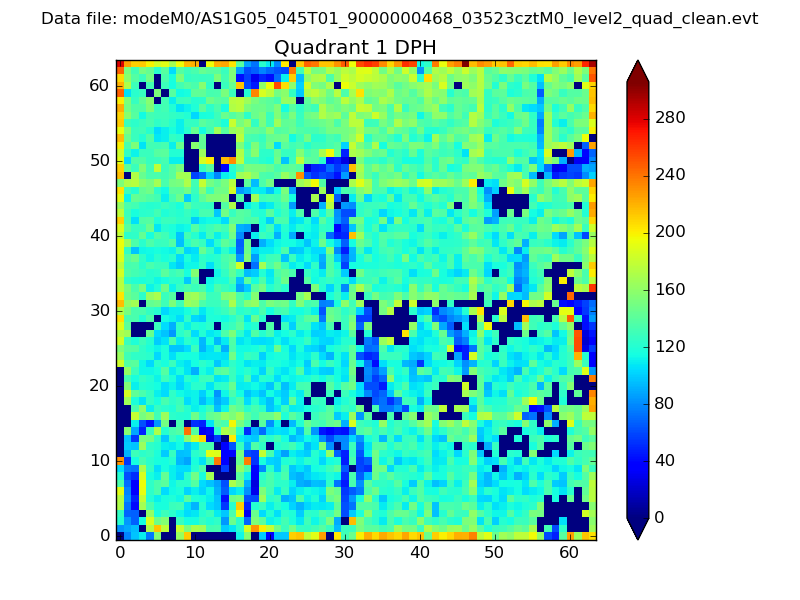 |
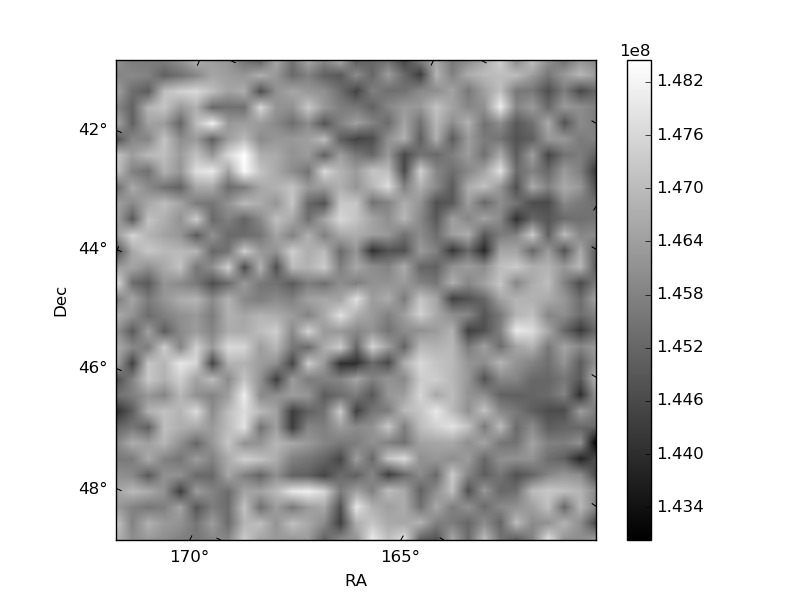
Quadrant B |
|---|---|---|---|
| Quadrant D | 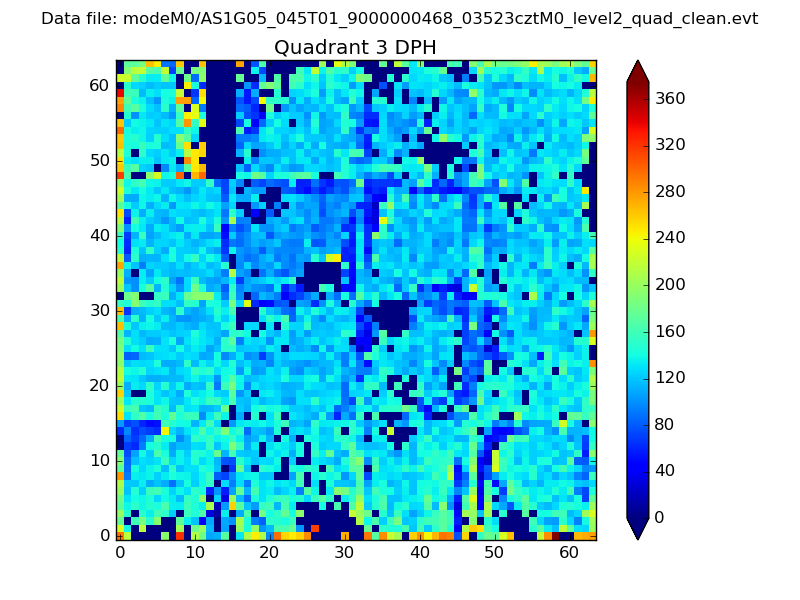 |
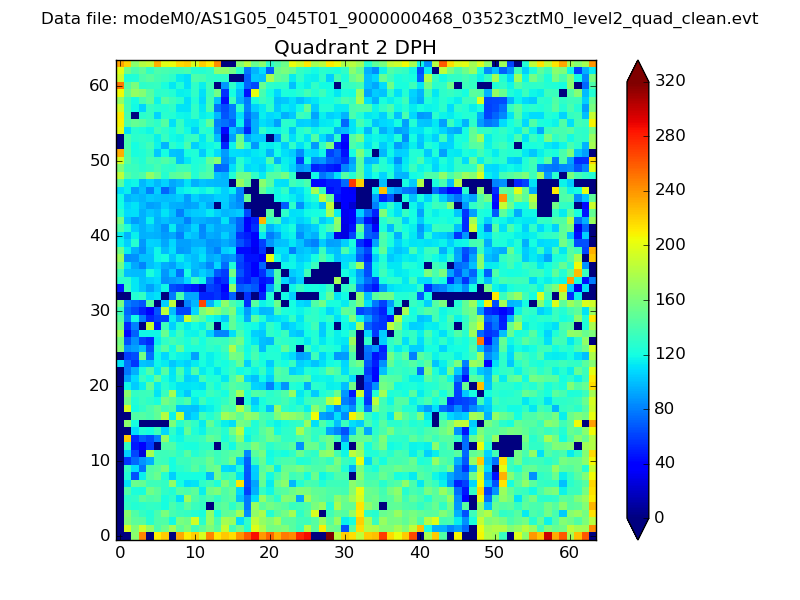 |
Quadrant C |
| Plot type | Count rate plots | Images |
|---|---|---|
| Comparison with Poisson distribution Blue bars denote a histogram of data divided into 1 sec bins. Red curve is a Poisson curve with rate = median count rate of data. |
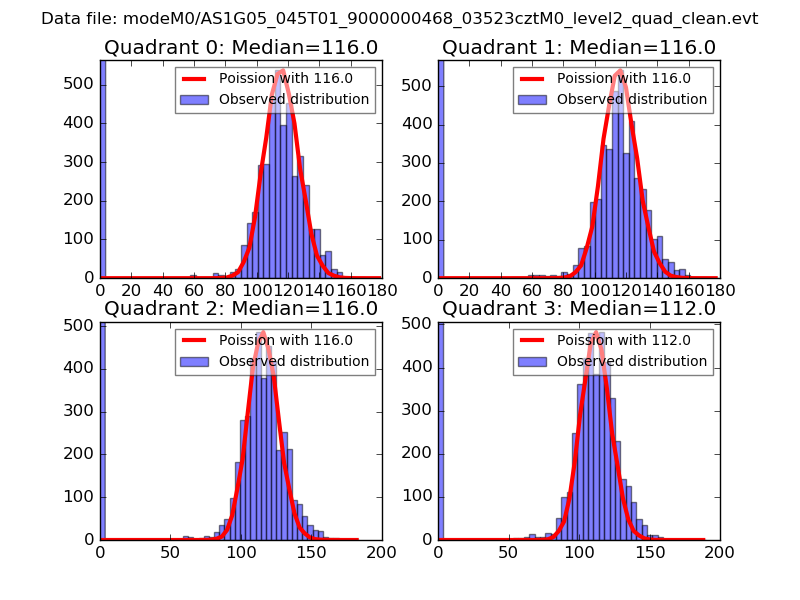 |
 |
| Quadrant-wise count rates Data is divided into 100 sec bins |
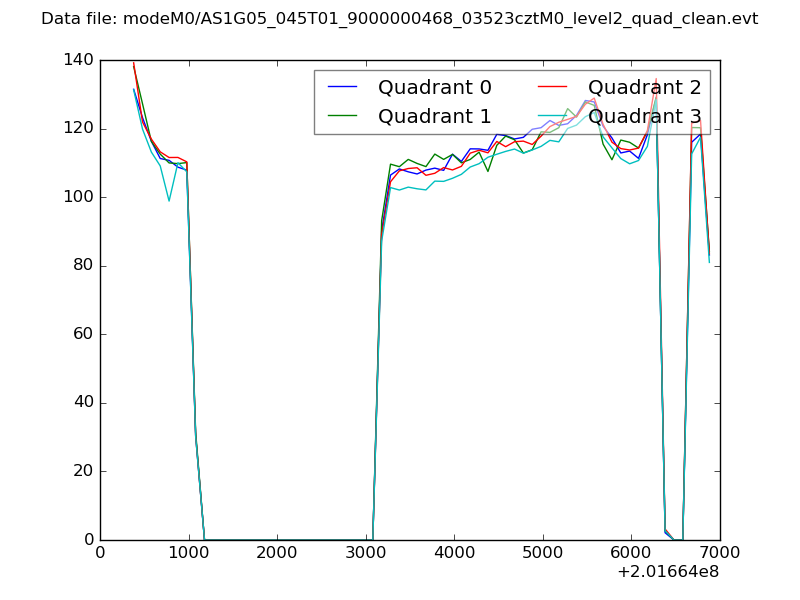 |
|
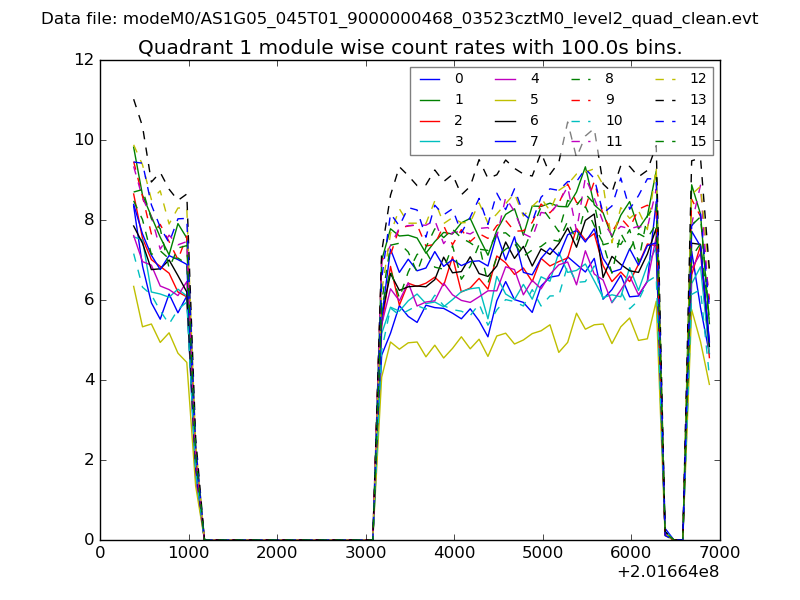
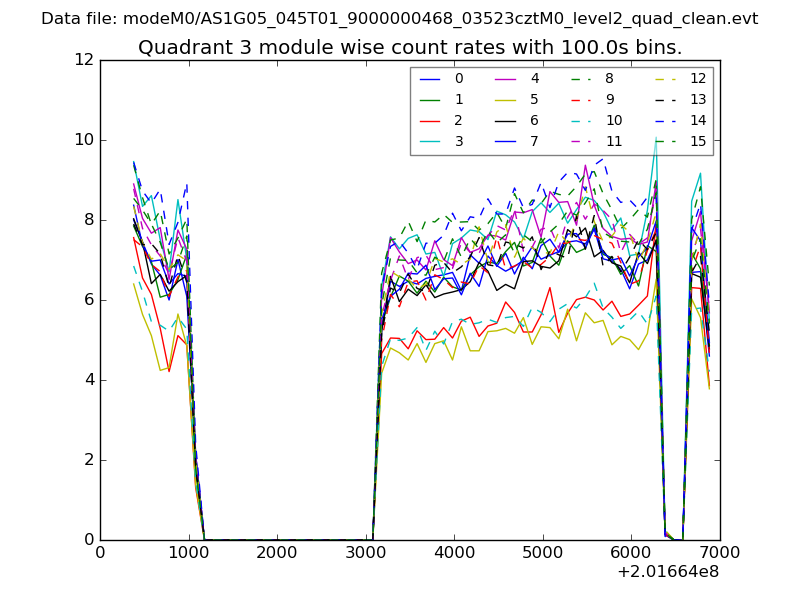
| Module-wise count rates for Quadrant A Data is divided into 100 sec bins |
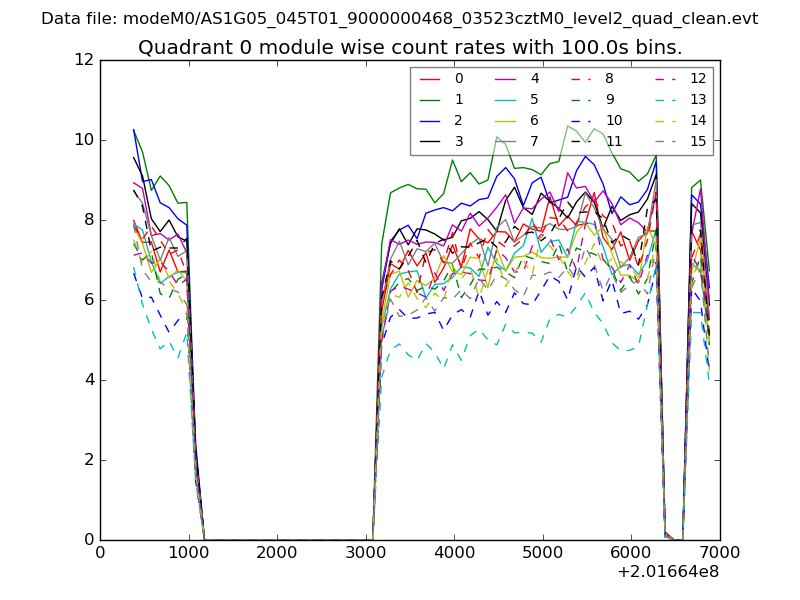 |
 |
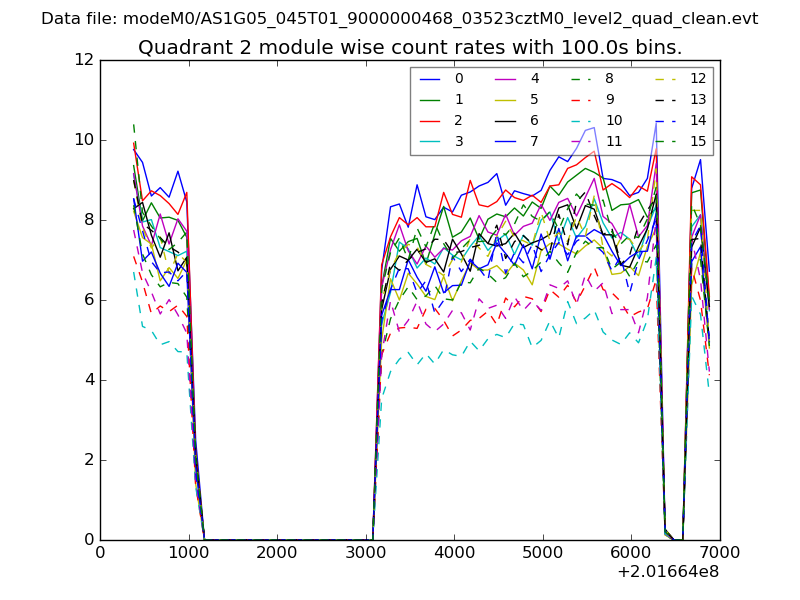
| Module-wise count rates for Quadrant B Data is divided into 100 sec bins |
 |
 |
| Module-wise count rates for Quadrant C Data is divided into 100 sec bins |
 |
 |
| Module-wise count rates for Quadrant D Data is divided into 100 sec bins |
 |
 |
| Parameter | Plot |
|---|---|
| CZT HV Monitor | 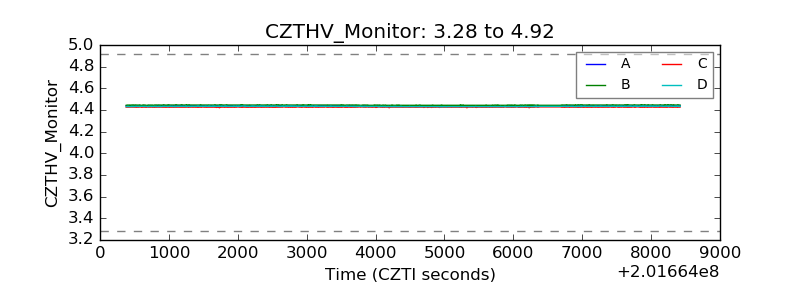 |
| D_VDD | 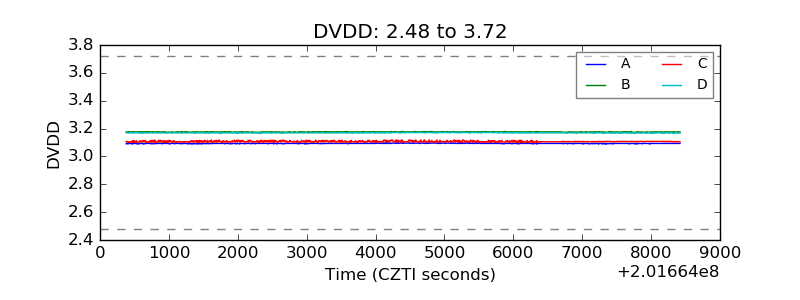 |
| Temperature 1 | 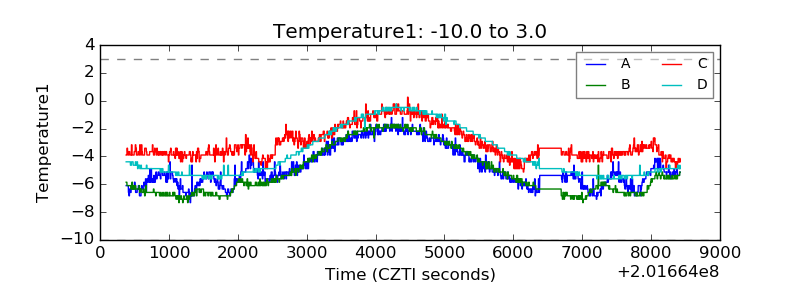 |
| Veto HV Monitor | 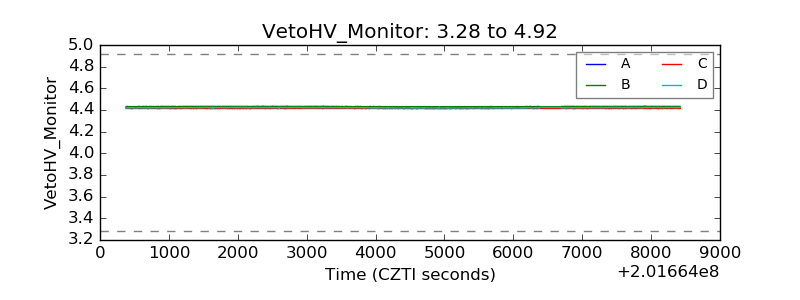 |
| Veto LLD | 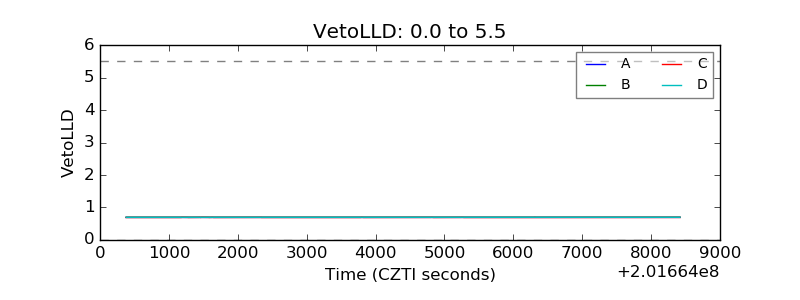 |
| Alpha Counter | 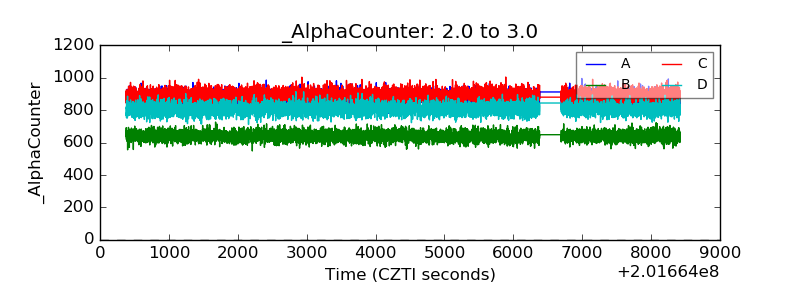 |
| _CPM_Rate | 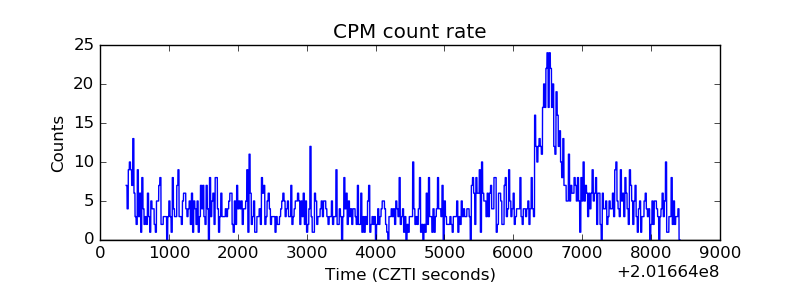 |
| CZT Counter | 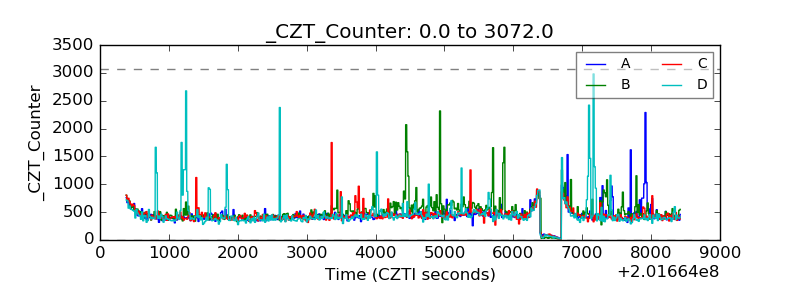 |
| +2.5 Volts monitor |  |
| +5 Volts monitor |  |
| _ROLL_ROT | 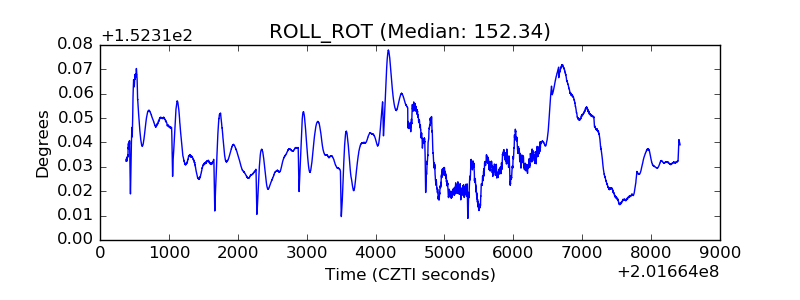 |
| _Roll_DEC |  |
| _Roll_RA | 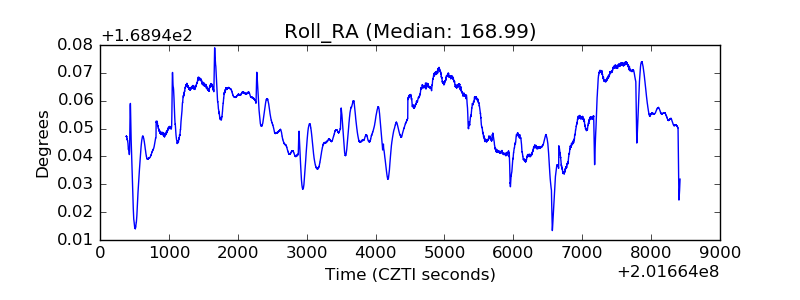 |
| Veto Counter | 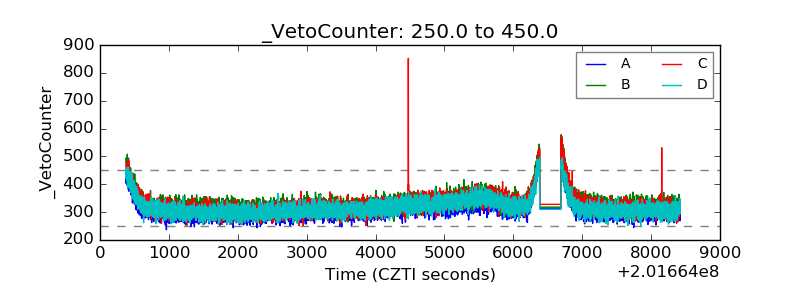 |