| Param | Original file | Final file |
|---|---|---|
| Filename | modeM0/AS1G05_045T01_9000000468_03527cztM0_level2.evt | modeM0/AS1G05_045T01_9000000468_03527cztM0_level2_quad_clean.evt |
| Size (bytes) | 525,467,520 | 77,929,920 |
| Size | 501.1 MB | 74.3 MB |
| Events in quadrant A | 3,790,972 | 477,349 |
| Events in quadrant B | 3,921,851 | 479,165 |
| Events in quadrant C | 3,804,088 | 469,383 |
| Events in quadrant D | 3,933,968 | 458,476 |
| Mode M0 | |||
|---|---|---|---|
| Quadrant | BADHDUFLAG | Total packets | Discarded packets |
| A | 0 | 15876 | 3 |
| B | 0 | 15852 | 2 |
| C | 0 | 16174 | 2 |
| D | 0 | 16714 | 2 |
| Mode M9 | |||
|---|---|---|---|
| Quadrant | BADHDUFLAG | Total packets | Discarded packets |
| A | 0 | 14 | 0 |
| B | 0 | 14 | 0 |
| C | 0 | 14 | 0 |
| D | 0 | 15 | 0 |
| Mode SS | |||
|---|---|---|---|
| Quadrant | BADHDUFLAG | Total packets | Discarded packets |
| A | 0 | 138 | 0 |
| B | 0 | 138 | 0 |
| C | 0 | 138 | 0 |
| D | 0 | 138 | 0 |
| Quadrant | Total seconds | Saturated seconds | Saturation percentage |
|---|---|---|---|
| A | 6823 | 305 | 4.470174% |
| B | 6822 | 123 | 1.802990% |
| C | 6822 | 185 | 2.711815% |
| D | 6822 | 128 | 1.876283% |
Noise dominated data is calculated using 1-second bins in cleaned event files. If a bin has >2000 counts, and if more than 50% of those come from <1% of pixels, then it is considered to be noise-dominated and hence unusable.
| Quadrant | # 1 sec bins | Bins with >0 counts | Bins with >2000 counts | High rate bins dominated by noise | Noise dominated (total time) | Noise dominated (detector-on time) | Marked lightcurve |
|---|---|---|---|---|---|---|---|
| A | 7834 | 6825 | 203 | 203 | 2.59% | 2.97% | 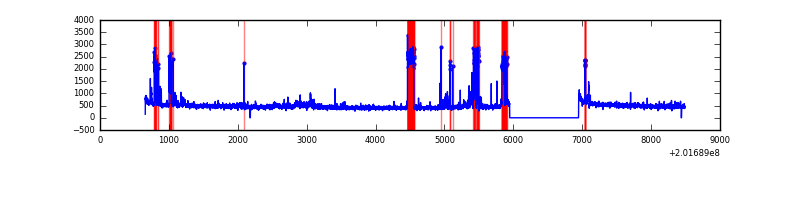 |
| B | 7834 | 6824 | 14 | 14 | 0.18% | 0.21% | 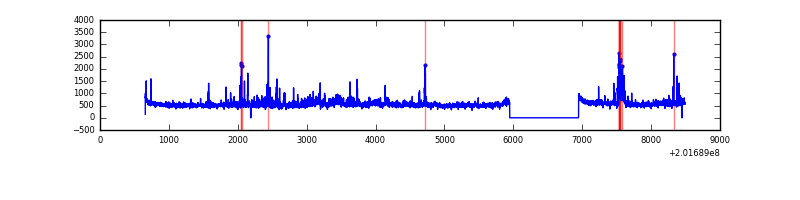 |
| C | 7834 | 6824 | 105 | 105 | 1.34% | 1.54% | 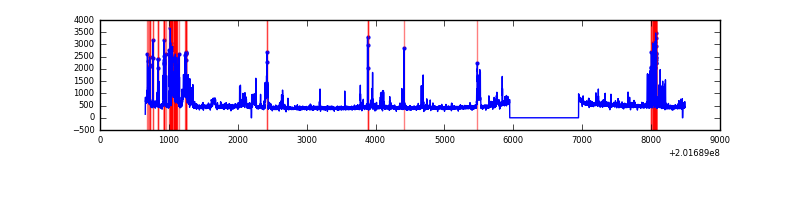 |
| D | 7834 | 6824 | 67 | 67 | 0.86% | 0.98% | 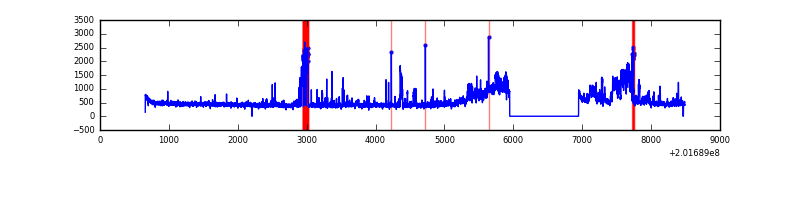 |
Top three noisy pixels from each quadrant. If the there are fewer than three noisy pixels in the level2.evt file, extra rows are filled as -1
| Pixel properties | Quadrant properties | ||||||
|---|---|---|---|---|---|---|---|
| Quadrant | DetID | PixID | Counts | Sigma | Mean | Median | Sigma |
| A | 0 | 149 | 344388 | 2155.07 | 779 | 761 | 159.5 |
| A | 0 | 50 | 310245 | 1940.94 | 779 | 761 | 159.5 |
| A | 8 | 15 | 81848 | 508.54 | 779 | 761 | 159.5 |
| B | 3 | 0 | 286211 | 1850.9 | 795 | 776 | 154.2 |
| B | 15 | 204 | 261171 | 1688.53 | 795 | 776 | 154.2 |
| B | 15 | 85 | 132197 | 852.2 | 795 | 776 | 154.2 |
| C | 4 | 248 | 777564 | 4385.18 | 760 | 763 | 177.1 |
| C | 1 | 16 | 15906 | 85.48 | 760 | 763 | 177.1 |
| C | 12 | 4 | 13725 | 73.17 | 760 | 763 | 177.1 |
| D | 1 | 20 | 740701 | 4022.2 | 761 | 738 | 184.0 |
| D | 13 | 25 | 219158 | 1187.26 | 761 | 738 | 184.0 |
| D | 5 | 233 | 37995 | 202.52 | 761 | 738 | 184.0 |
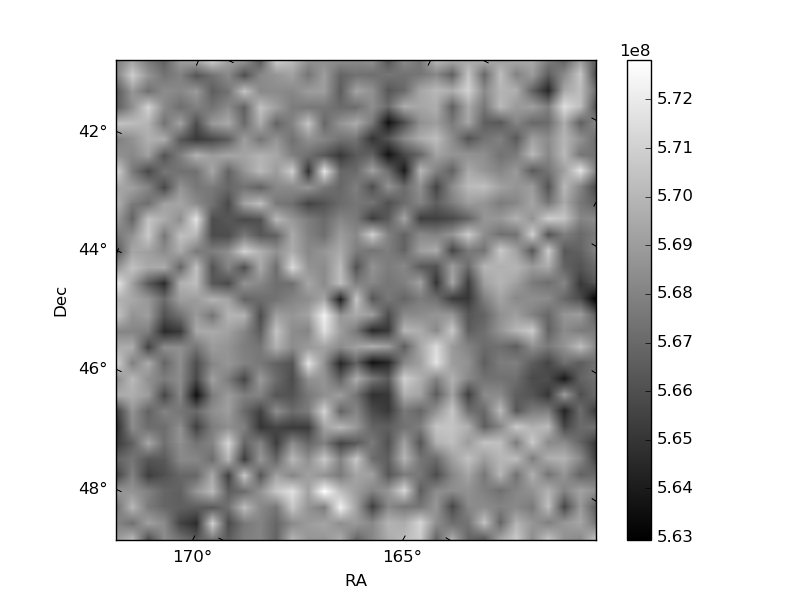
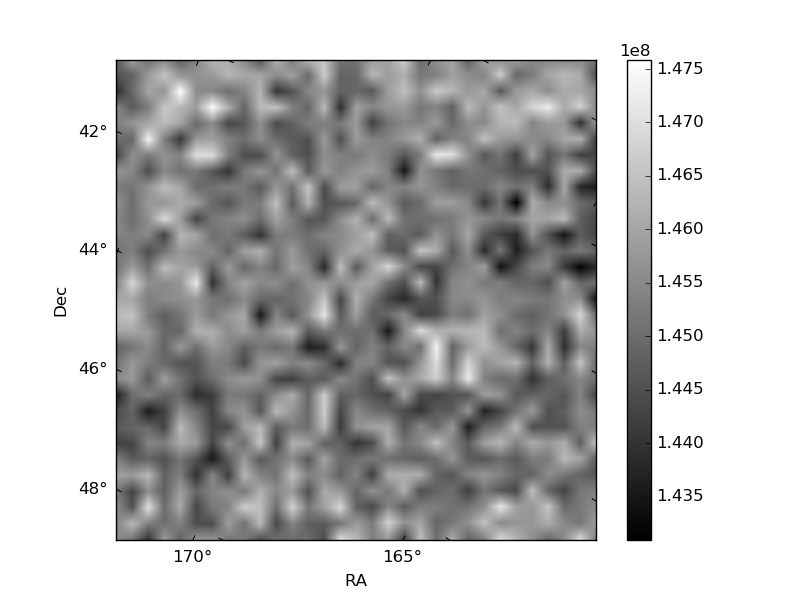
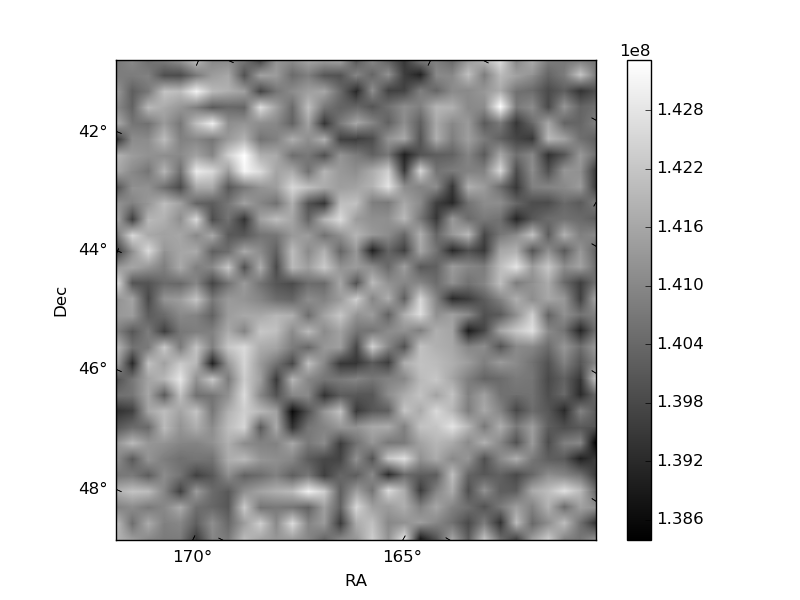
Histogram calculated using DETX and DETY for each event in the final _common_clean file
| Quadrant A | 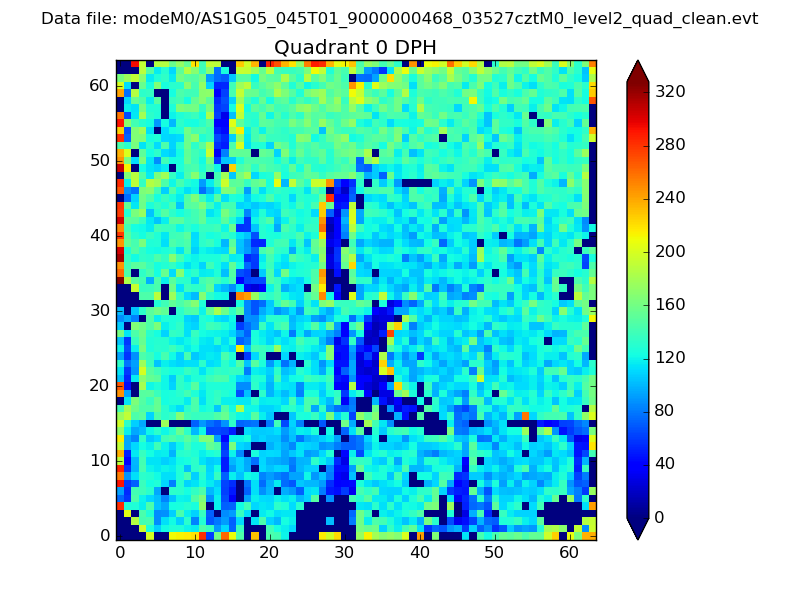 |
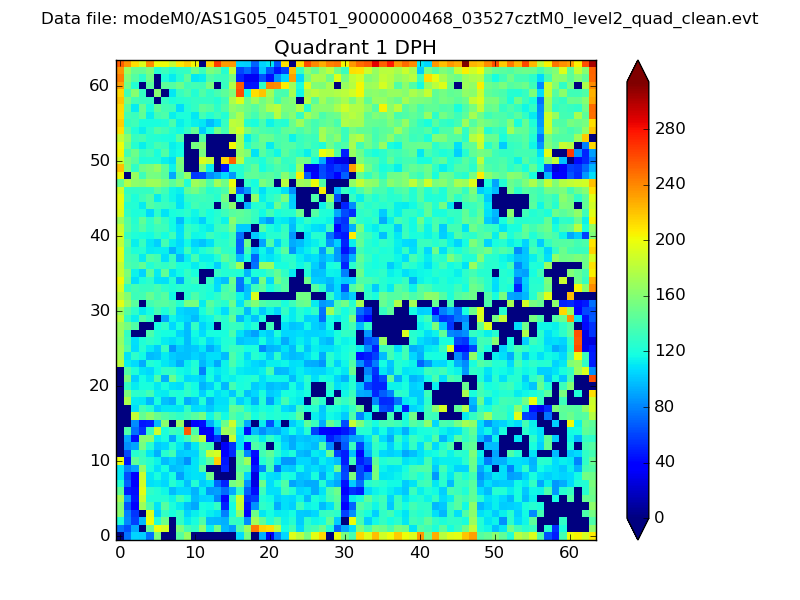 |
Quadrant B |
|---|---|---|---|
| Quadrant D | 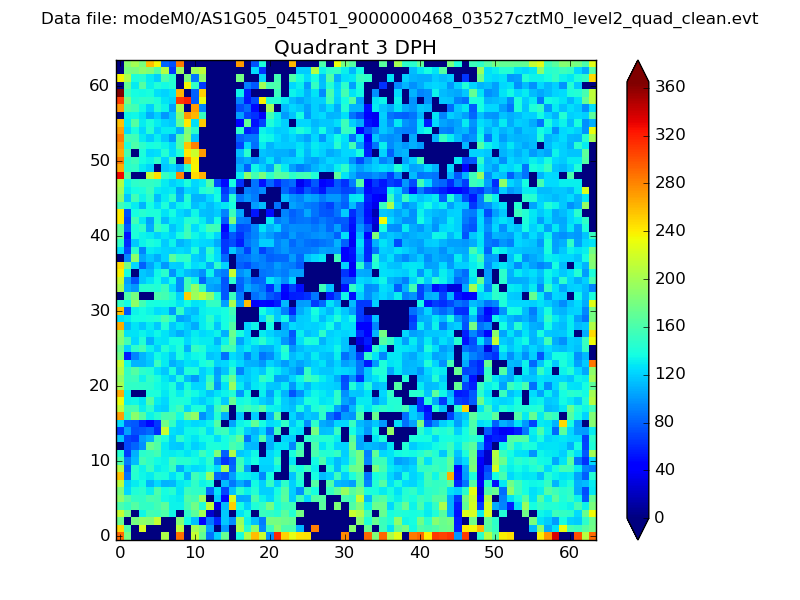 |
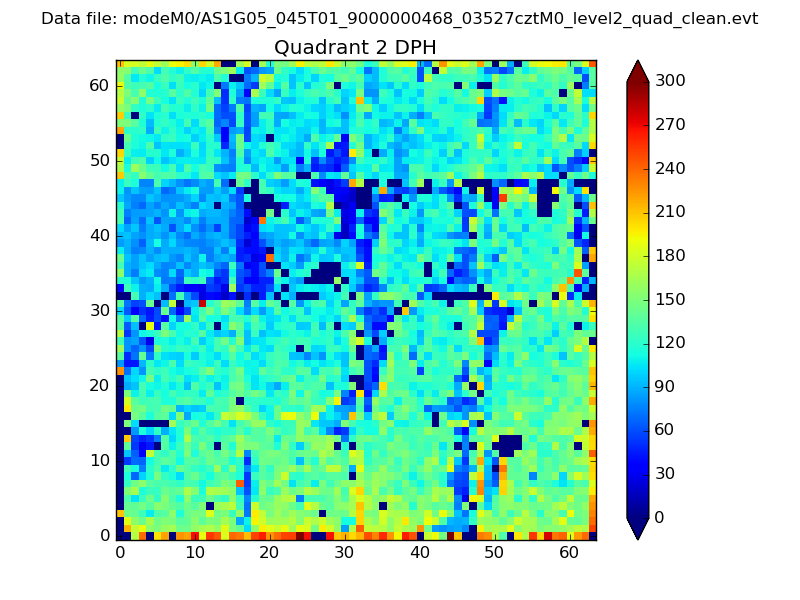 |
Quadrant C |
| Plot type | Count rate plots | Images |
|---|---|---|
| Comparison with Poisson distribution Blue bars denote a histogram of data divided into 1 sec bins. Red curve is a Poisson curve with rate = median count rate of data. |
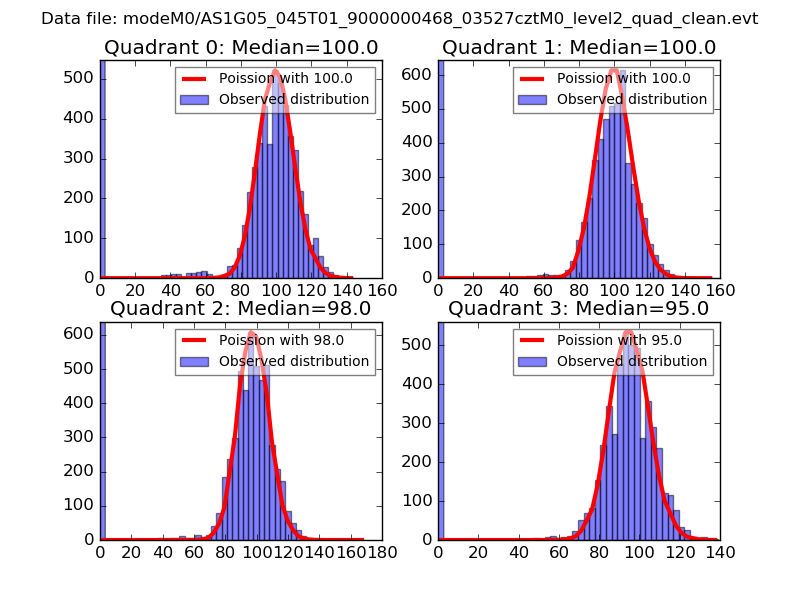 |
 |
| Quadrant-wise count rates Data is divided into 100 sec bins |
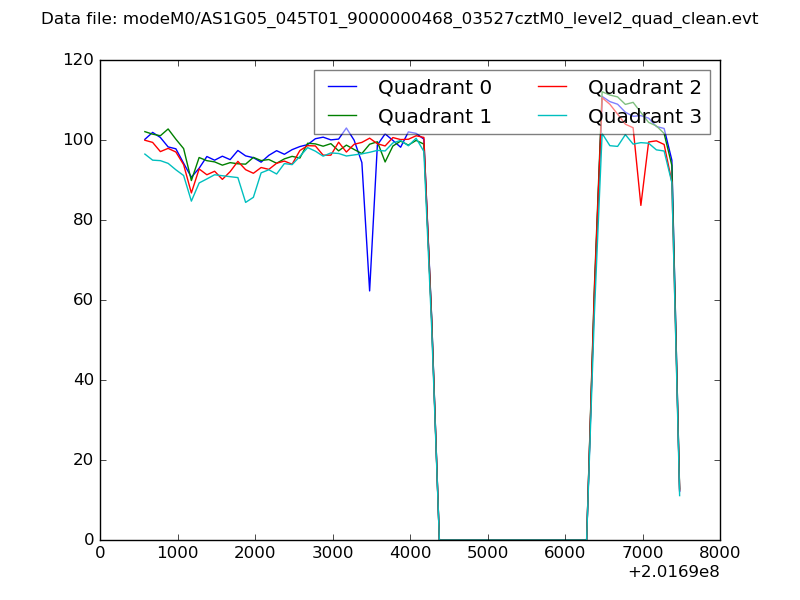 |
|
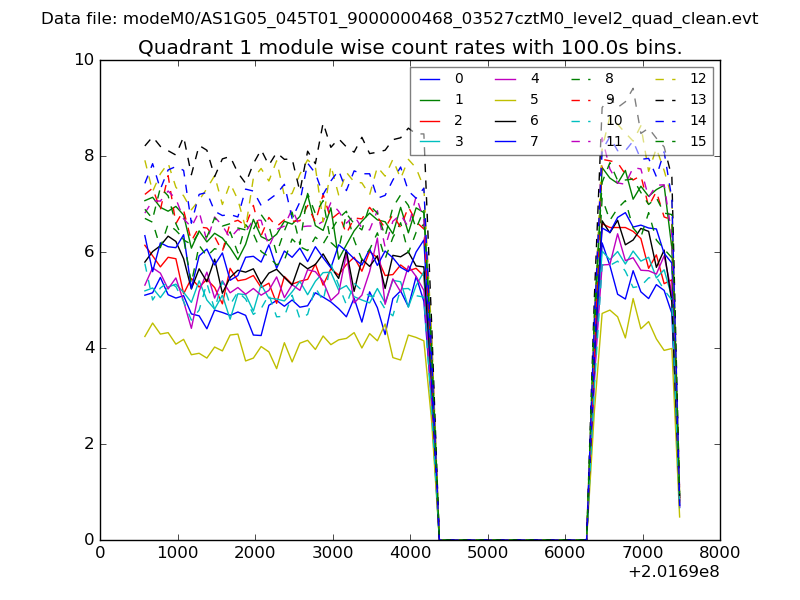
| Module-wise count rates for Quadrant A Data is divided into 100 sec bins |
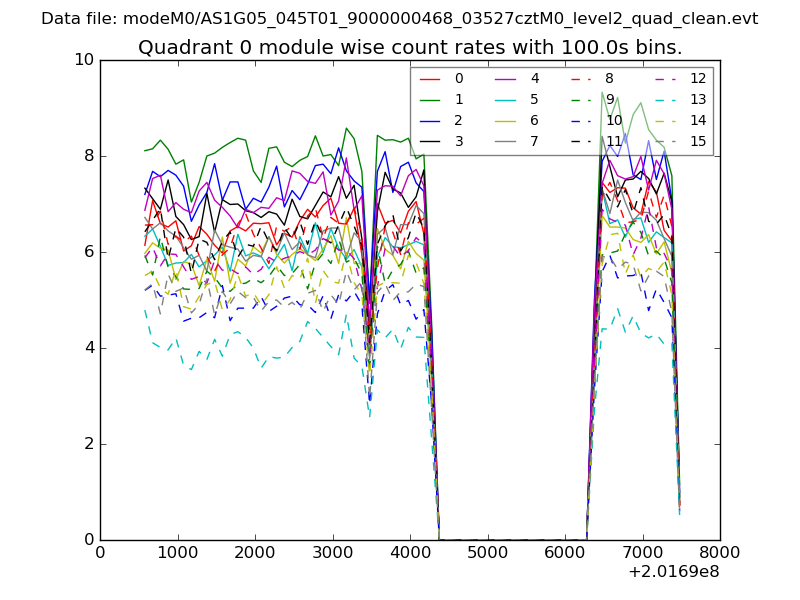 |
 |
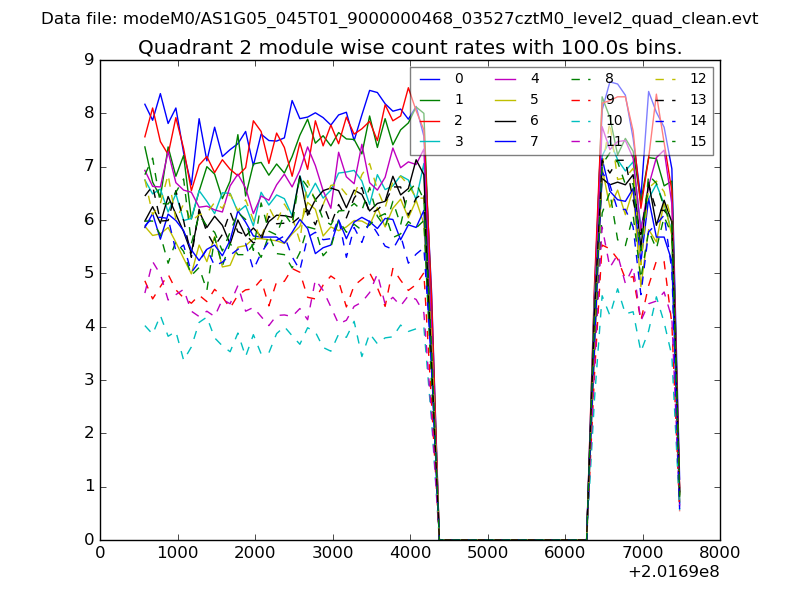
| Module-wise count rates for Quadrant B Data is divided into 100 sec bins |
 |
 |
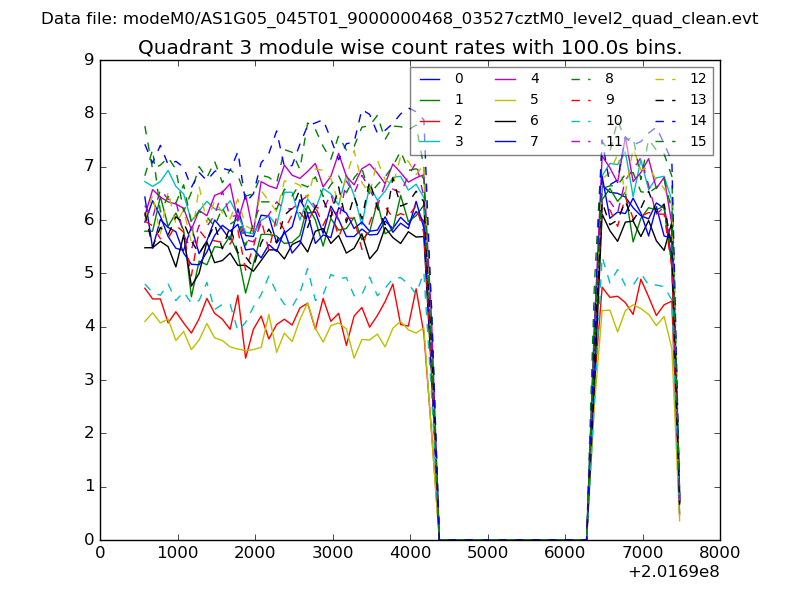
| Module-wise count rates for Quadrant C Data is divided into 100 sec bins |
 |
 |
| Module-wise count rates for Quadrant D Data is divided into 100 sec bins |
 |
 |
| Parameter | Plot |
|---|---|
| CZT HV Monitor | 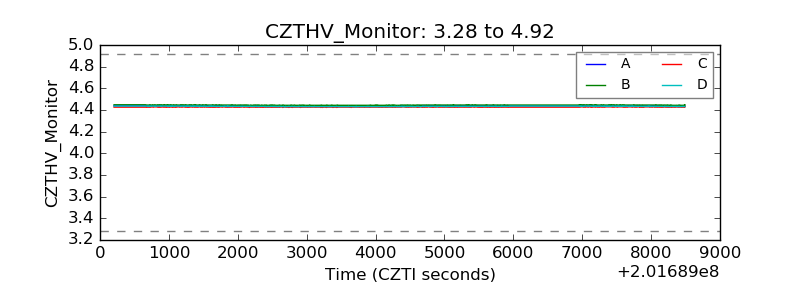 |
| D_VDD | 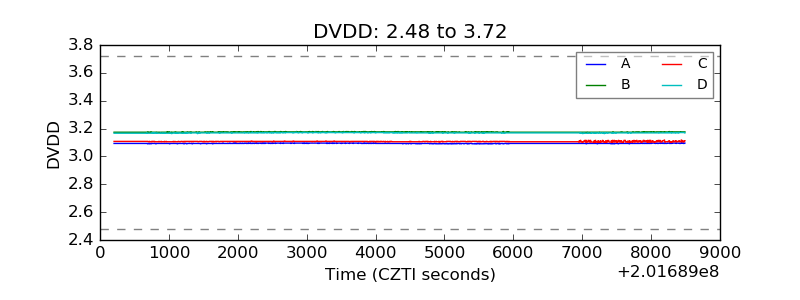 |
| Temperature 1 | 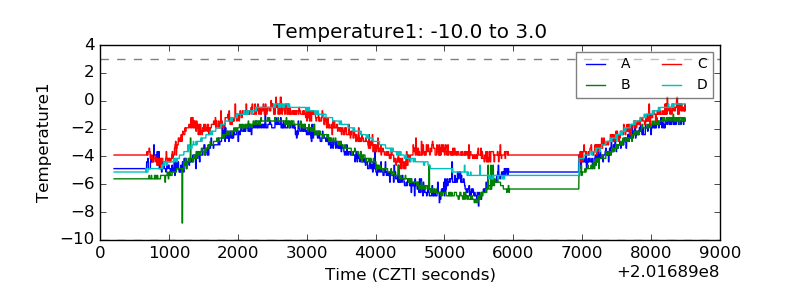 |
| Veto HV Monitor | 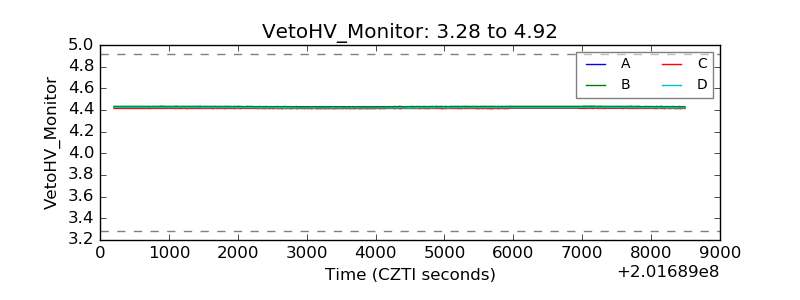 |
| Veto LLD | 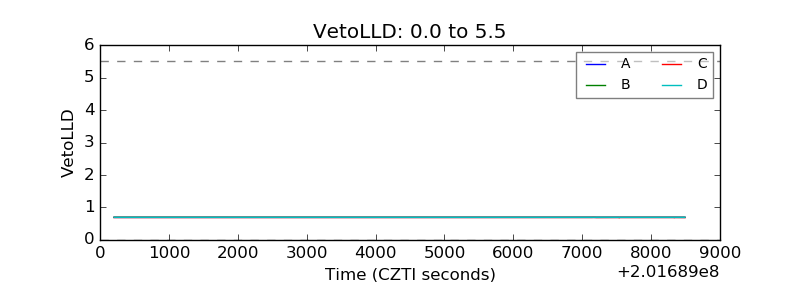 |
| Alpha Counter | 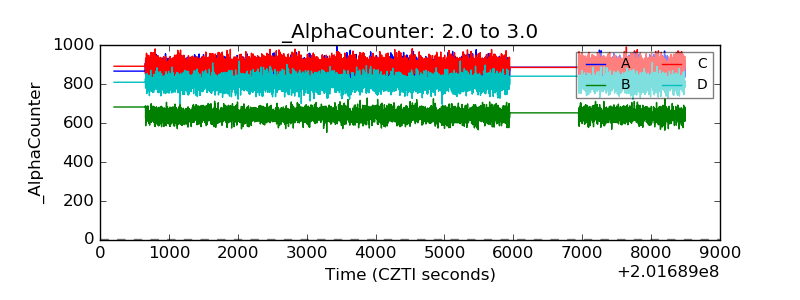 |
| _CPM_Rate | 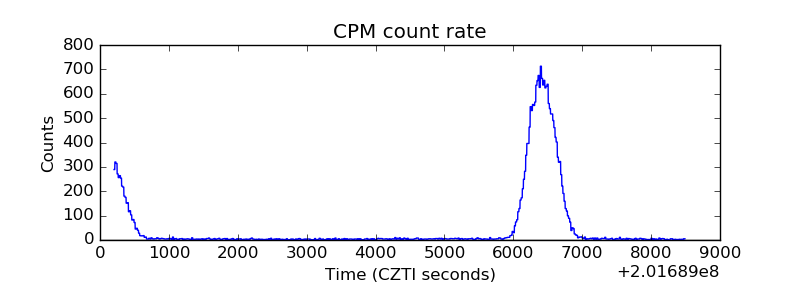 |
| CZT Counter | 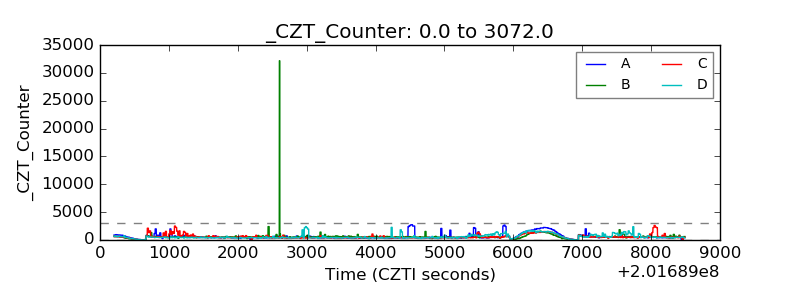 |
| +2.5 Volts monitor |  |
| +5 Volts monitor |  |
| _ROLL_ROT | 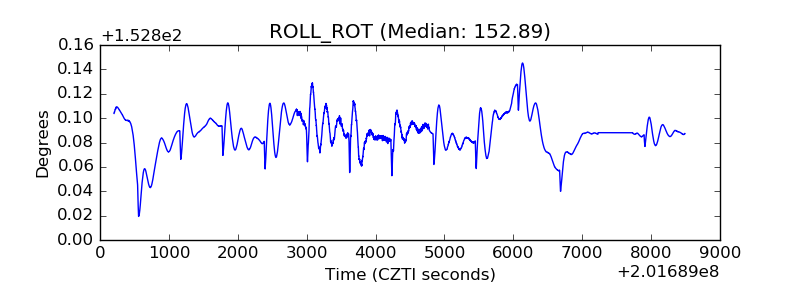 |
| _Roll_DEC | 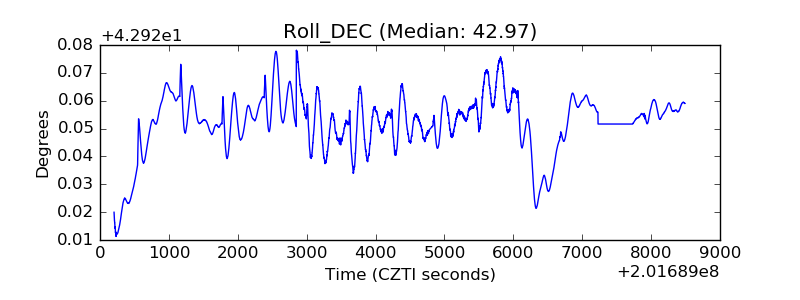 |
| _Roll_RA | 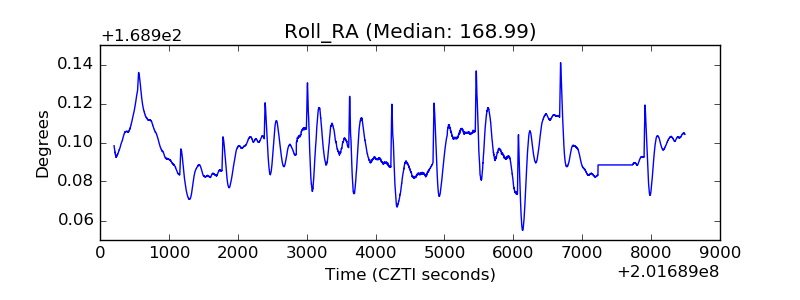 |
| Veto Counter | 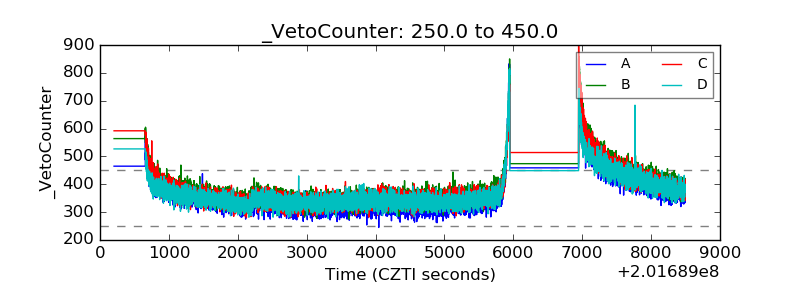 |