| Param | Original file | Final file |
|---|---|---|
| Filename | modeM0/AS1G05_045T01_9000000468_03529cztM0_level2.evt | modeM0/AS1G05_045T01_9000000468_03529cztM0_level2_quad_clean.evt |
| Size (bytes) | 441,852,480 | 81,996,480 |
| Size | 421.4 MB | 78.2 MB |
| Events in quadrant A | 3,070,531 | 530,202 |
| Events in quadrant B | 3,602,532 | 522,417 |
| Events in quadrant C | 2,978,757 | 516,223 |
| Events in quadrant D | 3,328,310 | 501,401 |
| Mode M0 | |||
|---|---|---|---|
| Quadrant | BADHDUFLAG | Total packets | Discarded packets |
| A | 0 | 13340 | 2 |
| B | 0 | 14678 | 1 |
| C | 0 | 13031 | 1 |
| D | 0 | 14189 | 4 |
| Mode M9 | |||
|---|---|---|---|
| Quadrant | BADHDUFLAG | Total packets | Discarded packets |
| A | 0 | 12 | 0 |
| B | 0 | 12 | 0 |
| C | 0 | 12 | 0 |
| D | 0 | 12 | 0 |
| Mode SS | |||
|---|---|---|---|
| Quadrant | BADHDUFLAG | Total packets | Discarded packets |
| A | 0 | 118 | 0 |
| B | 0 | 118 | 0 |
| C | 0 | 118 | 0 |
| D | 0 | 118 | 0 |
| Quadrant | Total seconds | Saturated seconds | Saturation percentage |
|---|---|---|---|
| A | 5915 | 172 | 2.907861% |
| B | 5913 | 92 | 1.555894% |
| C | 5914 | 103 | 1.741630% |
| D | 5913 | 119 | 2.012515% |
Noise dominated data is calculated using 1-second bins in cleaned event files. If a bin has >2000 counts, and if more than 50% of those come from <1% of pixels, then it is considered to be noise-dominated and hence unusable.
| Quadrant | # 1 sec bins | Bins with >0 counts | Bins with >2000 counts | High rate bins dominated by noise | Noise dominated (total time) | Noise dominated (detector-on time) | Marked lightcurve |
|---|---|---|---|---|---|---|---|
| A | 7052 | 5918 | 84 | 84 | 1.19% | 1.42% | 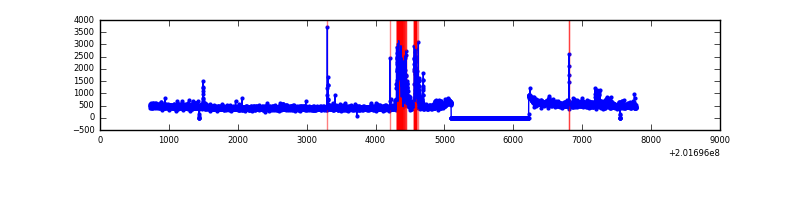 |
| B | 7052 | 5916 | 12 | 12 | 0.17% | 0.20% | 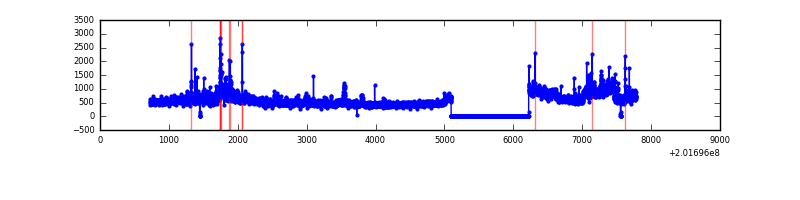 |
| C | 7052 | 5917 | 38 | 38 | 0.54% | 0.64% | 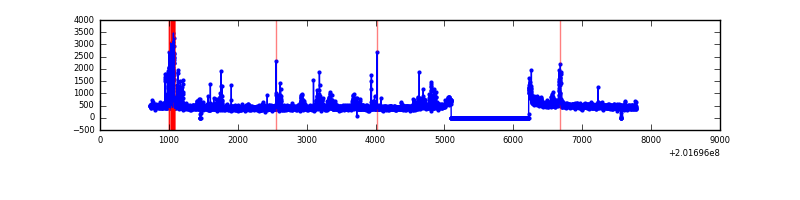 |
| D | 7051 | 5916 | 62 | 62 | 0.88% | 1.05% | 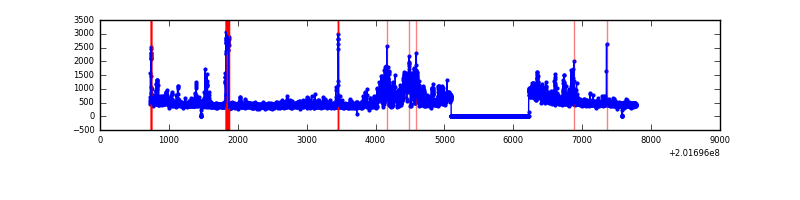 |
Top three noisy pixels from each quadrant. If the there are fewer than three noisy pixels in the level2.evt file, extra rows are filled as -1
| Pixel properties | Quadrant properties | ||||||
|---|---|---|---|---|---|---|---|
| Quadrant | DetID | PixID | Counts | Sigma | Mean | Median | Sigma |
| A | 0 | 50 | 341491 | 2424.8 | 681 | 667 | 140.6 |
| A | 8 | 15 | 77146 | 544.11 | 681 | 667 | 140.6 |
| A | 0 | 31 | 13333 | 90.11 | 681 | 667 | 140.6 |
| B | 3 | 0 | 426381 | 3197.66 | 687 | 670 | 133.1 |
| B | 15 | 204 | 269621 | 2020.18 | 687 | 670 | 133.1 |
| B | 4 | 81 | 76665 | 570.82 | 687 | 670 | 133.1 |
| C | 4 | 248 | 309698 | 1989.86 | 663 | 665 | 155.3 |
| C | 1 | 16 | 48295 | 306.69 | 663 | 665 | 155.3 |
| C | 1 | 192 | 15850 | 97.78 | 663 | 665 | 155.3 |
| D | 1 | 20 | 555487 | 3477.07 | 662 | 643 | 159.6 |
| D | 2 | 31 | 141872 | 885.05 | 662 | 643 | 159.6 |
| D | 13 | 223 | 45669 | 282.17 | 662 | 643 | 159.6 |
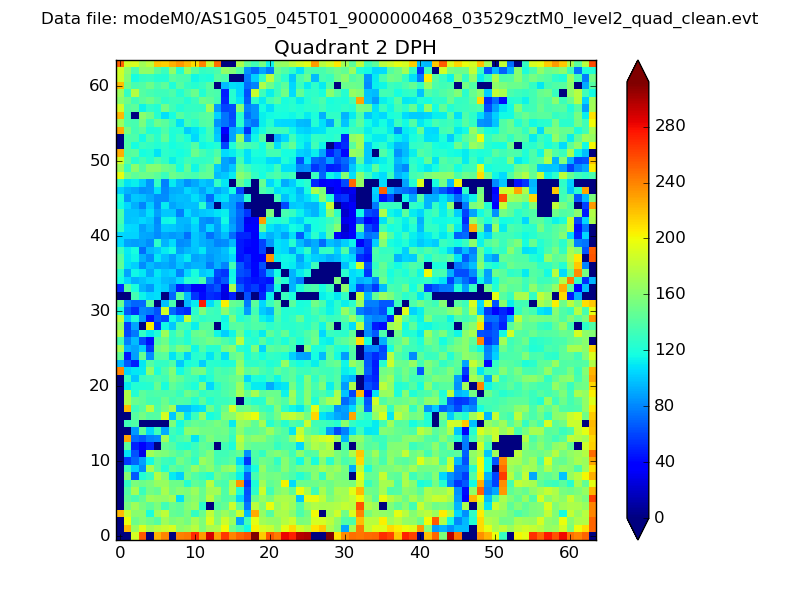
Histogram calculated using DETX and DETY for each event in the final _common_clean file
| Quadrant A | 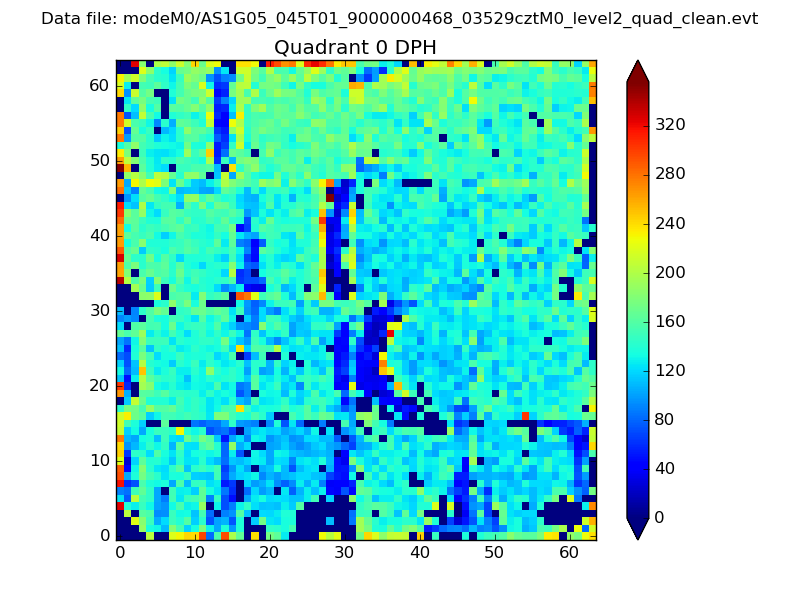 |
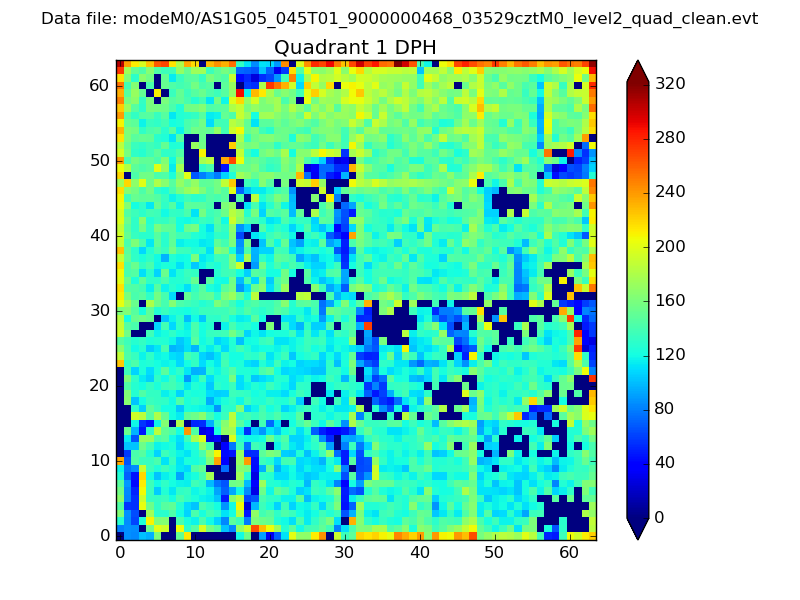 |
Quadrant B |
|---|---|---|---|
| Quadrant D | 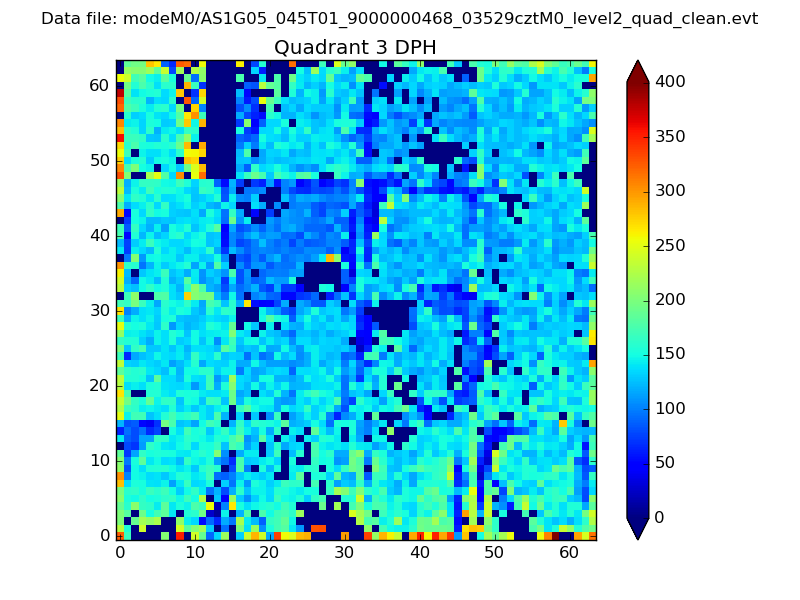 |
 |
Quadrant C |
| Plot type | Count rate plots | Images |
|---|---|---|
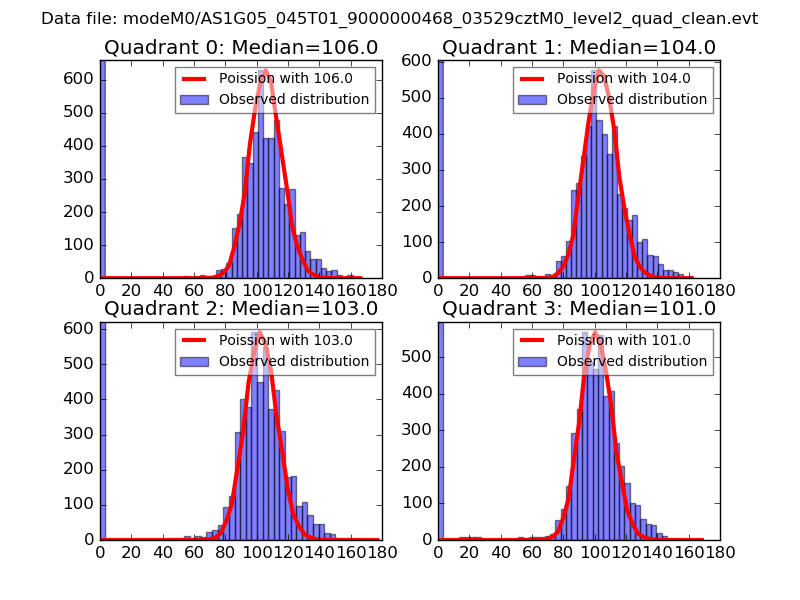
| Comparison with Poisson distribution Blue bars denote a histogram of data divided into 1 sec bins. Red curve is a Poisson curve with rate = median count rate of data. |
 |
 |
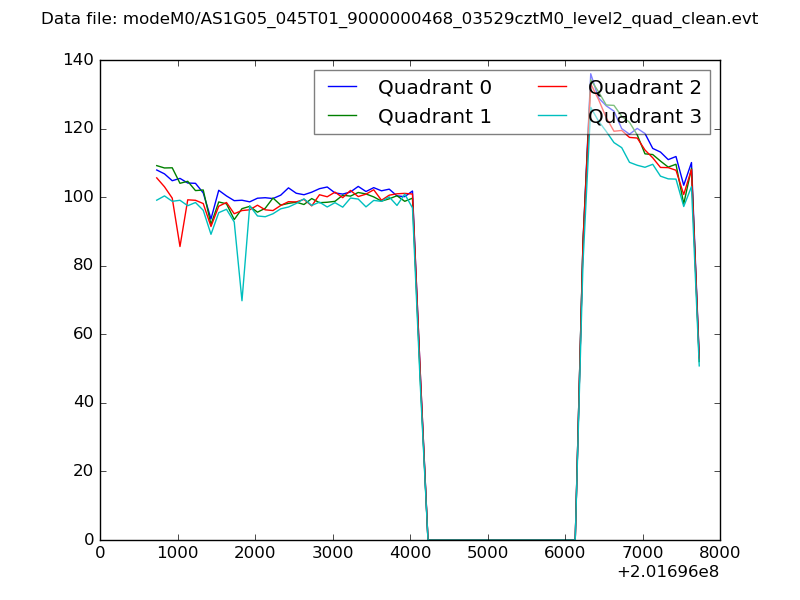
| Quadrant-wise count rates Data is divided into 100 sec bins |
 |
|
| Module-wise count rates for Quadrant A Data is divided into 100 sec bins |
 |
 |
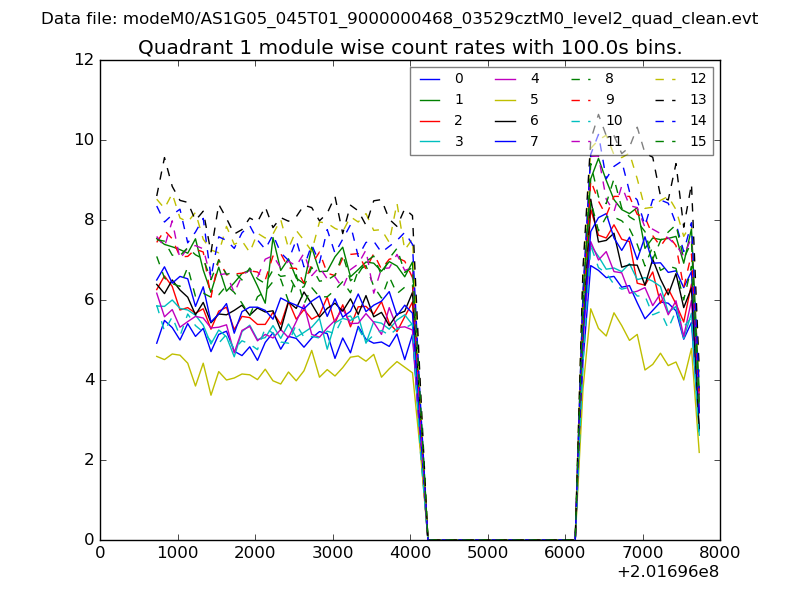
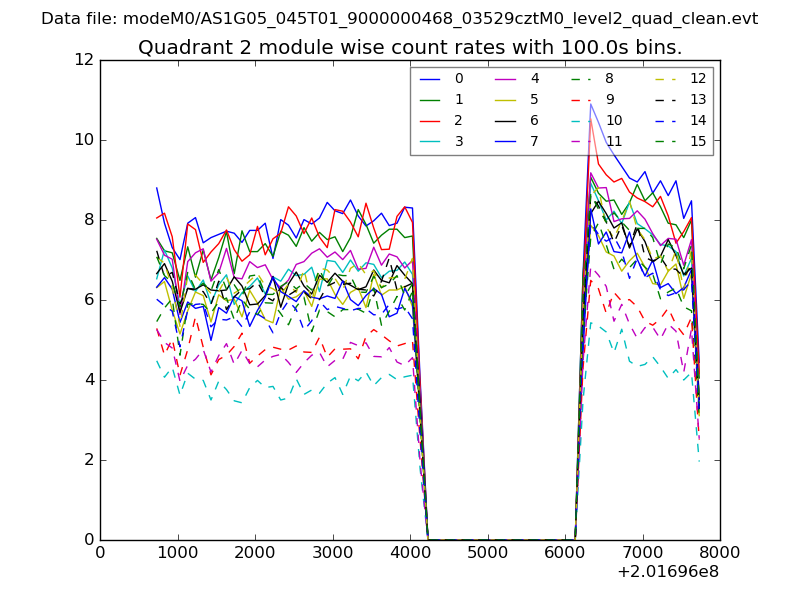
| Module-wise count rates for Quadrant B Data is divided into 100 sec bins |
 |
 |
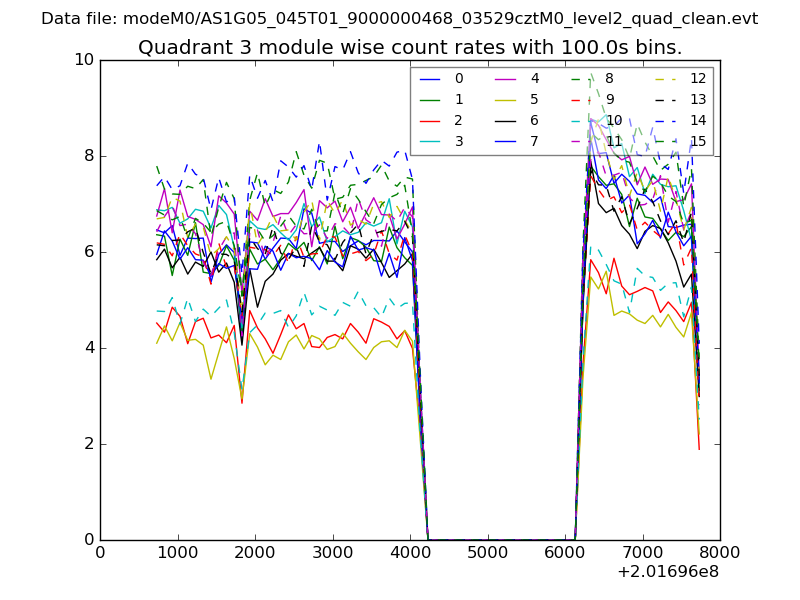
| Module-wise count rates for Quadrant C Data is divided into 100 sec bins |
 |
 |
| Module-wise count rates for Quadrant D Data is divided into 100 sec bins |
 |
 |
| Parameter | Plot |
|---|---|
| CZT HV Monitor | 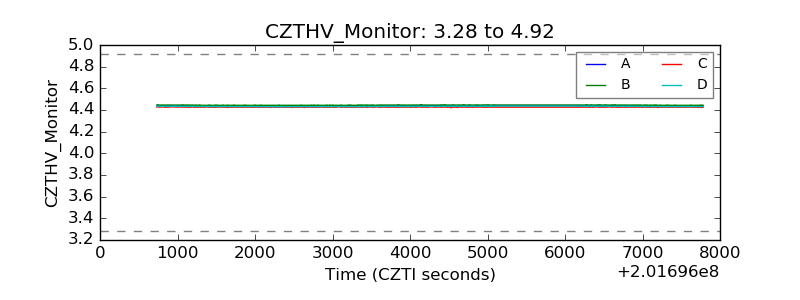 |
| D_VDD | 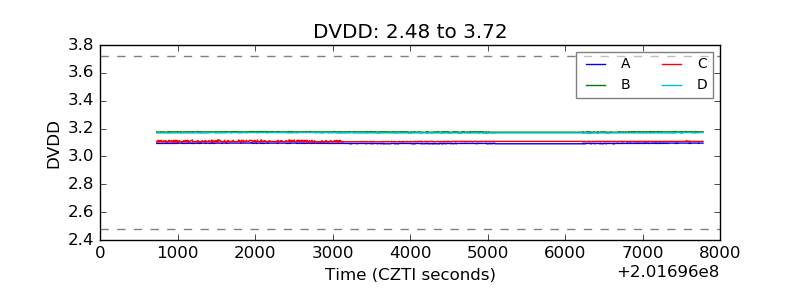 |
| Temperature 1 | 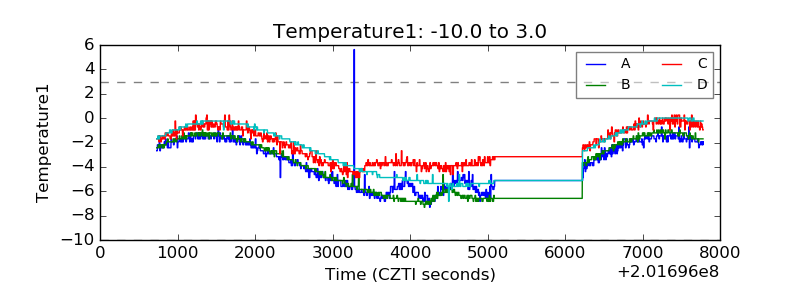 |
| Veto HV Monitor | 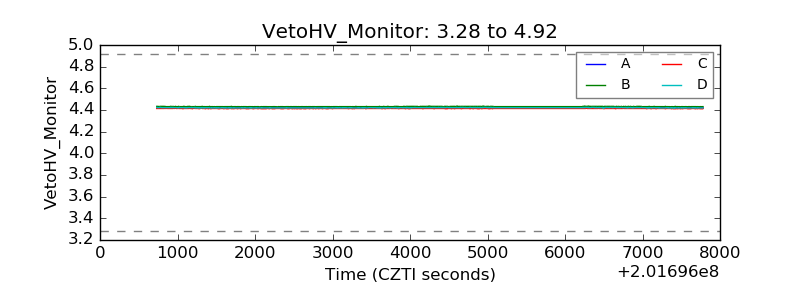 |
| Veto LLD | 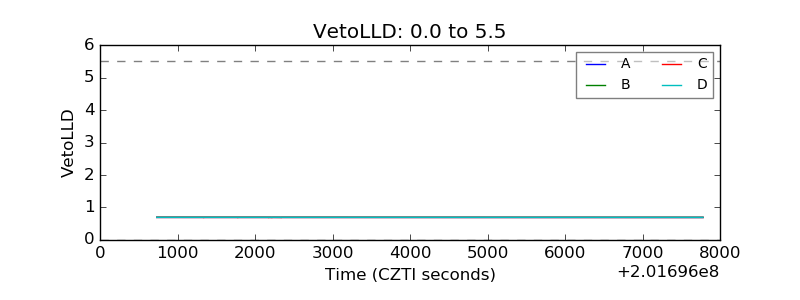 |
| Alpha Counter | 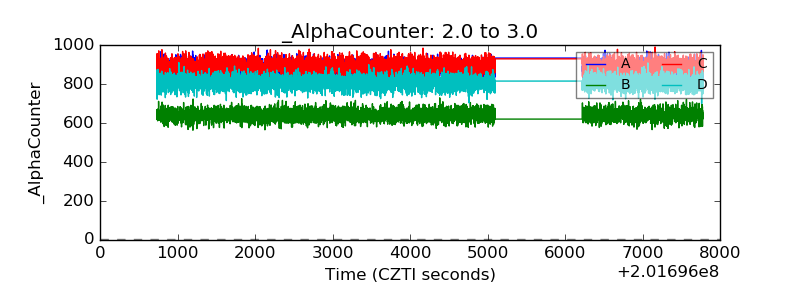 |
| _CPM_Rate | 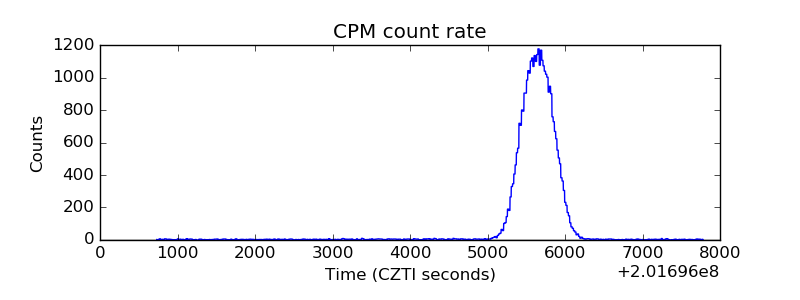 |
| CZT Counter | 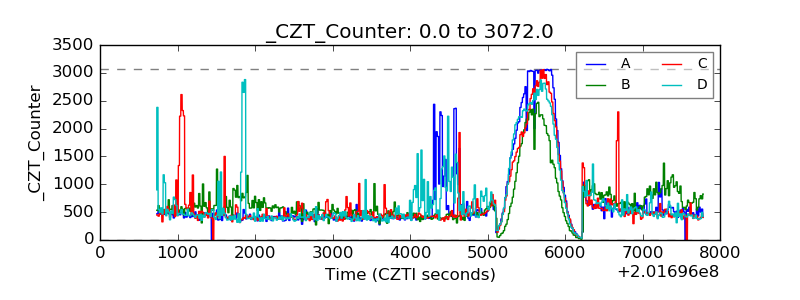 |
| +2.5 Volts monitor |  |
| +5 Volts monitor | 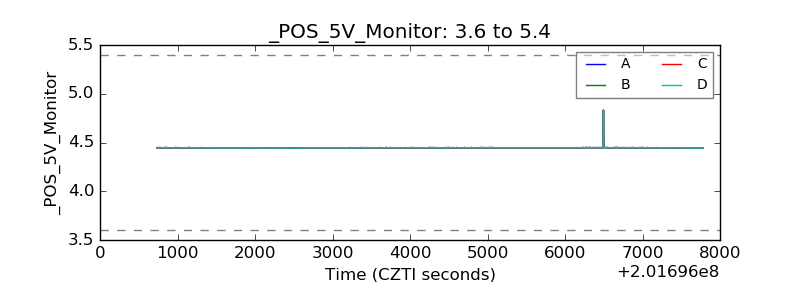 |
| Veto Counter | 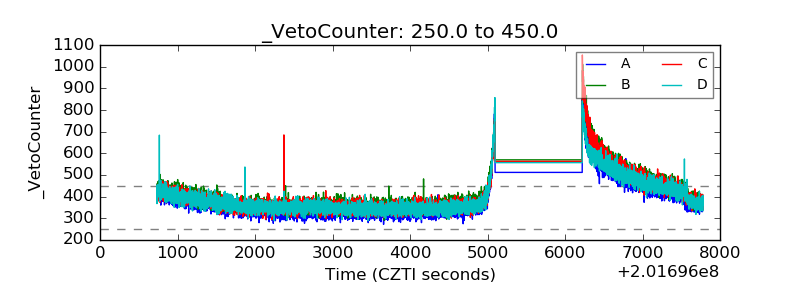 |