| Param | Original file | Final file |
|---|---|---|
| Filename | modeM0/AS1G05_045T01_9000000468_03532cztM0_level2.evt | modeM0/AS1G05_045T01_9000000468_03532cztM0_level2_quad_clean.evt |
| Size (bytes) | 503,104,320 | 70,856,640 |
| Size | 479.8 MB | 67.6 MB |
| Events in quadrant A | 4,086,847 | 437,357 |
| Events in quadrant B | 3,458,778 | 440,441 |
| Events in quadrant C | 4,192,277 | 432,580 |
| Events in quadrant D | 3,100,825 | 424,912 |
| Mode M0 | |||
|---|---|---|---|
| Quadrant | BADHDUFLAG | Total packets | Discarded packets |
| A | 0 | 16308 | 2 |
| B | 0 | 14436 | 1 |
| C | 0 | 16529 | 1 |
| D | 0 | 13472 | 1 |
| Mode M9 | |||
|---|---|---|---|
| Quadrant | BADHDUFLAG | Total packets | Discarded packets |
| A | 0 | 13 | 0 |
| B | 0 | 13 | 0 |
| C | 0 | 13 | 0 |
| D | 0 | 13 | 0 |
| Mode SS | |||
|---|---|---|---|
| Quadrant | BADHDUFLAG | Total packets | Discarded packets |
| A | 0 | 118 | 0 |
| B | 0 | 118 | 0 |
| C | 0 | 118 | 0 |
| D | 0 | 118 | 0 |
| Quadrant | Total seconds | Saturated seconds | Saturation percentage |
|---|---|---|---|
| A | 5874 | 200 | 3.404835% |
| B | 5874 | 77 | 1.310861% |
| C | 5874 | 213 | 3.626149% |
| D | 5874 | 131 | 2.230167% |
Noise dominated data is calculated using 1-second bins in cleaned event files. If a bin has >2000 counts, and if more than 50% of those come from <1% of pixels, then it is considered to be noise-dominated and hence unusable.
| Quadrant | # 1 sec bins | Bins with >0 counts | Bins with >2000 counts | High rate bins dominated by noise | Noise dominated (total time) | Noise dominated (detector-on time) | Marked lightcurve |
|---|---|---|---|---|---|---|---|
| A | 7164 | 5874 | 28 | 28 | 0.39% | 0.48% |  |
| B | 7164 | 5874 | 11 | 11 | 0.15% | 0.19% | 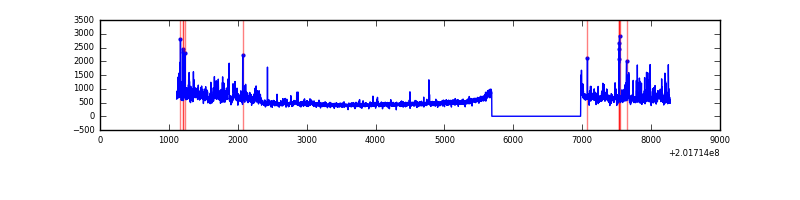 |
| C | 7164 | 5874 | 133 | 133 | 1.86% | 2.26% | 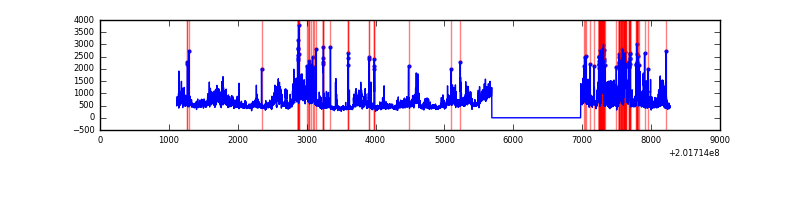 |
| D | 7164 | 5874 | 92 | 92 | 1.28% | 1.57% |  |
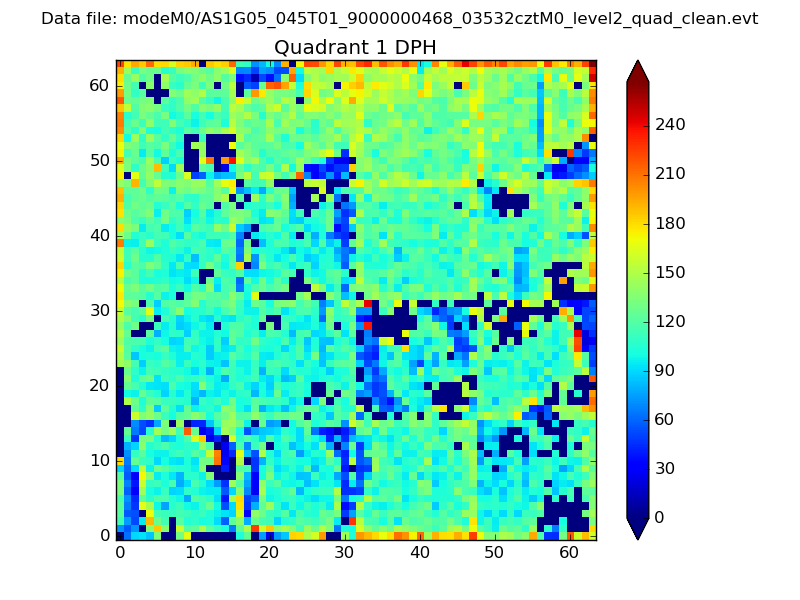
Top three noisy pixels from each quadrant. If the there are fewer than three noisy pixels in the level2.evt file, extra rows are filled as -1
| Pixel properties | Quadrant properties | ||||||
|---|---|---|---|---|---|---|---|
| Quadrant | DetID | PixID | Counts | Sigma | Mean | Median | Sigma |
| A | 8 | 15 | 1273920 | 9079.6 | 682 | 665 | 140.2 |
| A | 0 | 50 | 150155 | 1066.01 | 682 | 665 | 140.2 |
| A | 0 | 118 | 18909 | 130.1 | 682 | 665 | 140.2 |
| B | 15 | 204 | 334074 | 2519.88 | 699 | 683 | 132.3 |
| B | 8 | 3 | 167414 | 1260.21 | 699 | 683 | 132.3 |
| B | 14 | 167 | 147855 | 1112.38 | 699 | 683 | 132.3 |
| C | 4 | 248 | 1414201 | 9055.03 | 674 | 678 | 156.1 |
| C | 1 | 16 | 76693 | 486.95 | 674 | 678 | 156.1 |
| C | 9 | 54 | 39840 | 250.87 | 674 | 678 | 156.1 |
| D | 13 | 70 | 316951 | 1967.87 | 672 | 653 | 160.7 |
| D | 13 | 46 | 85668 | 528.93 | 672 | 653 | 160.7 |
| D | 2 | 31 | 55447 | 340.9 | 672 | 653 | 160.7 |
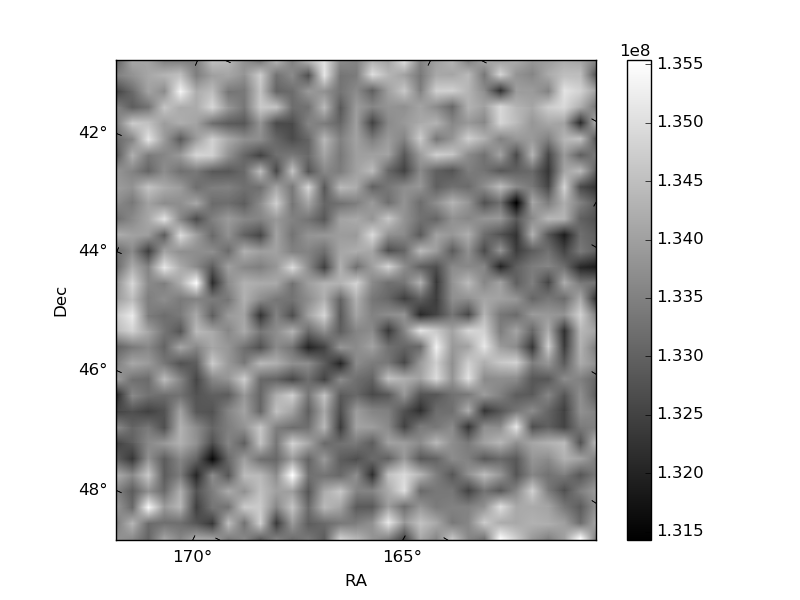
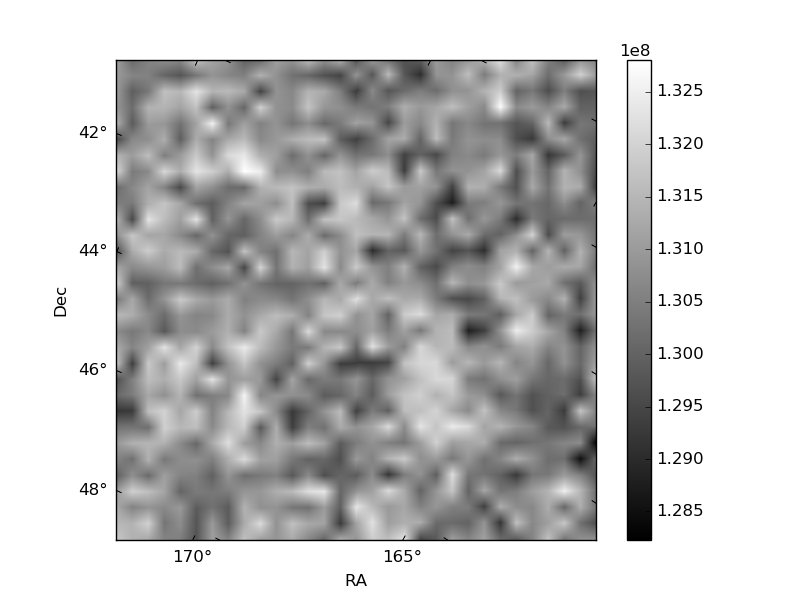
Histogram calculated using DETX and DETY for each event in the final _common_clean file
| Quadrant A | 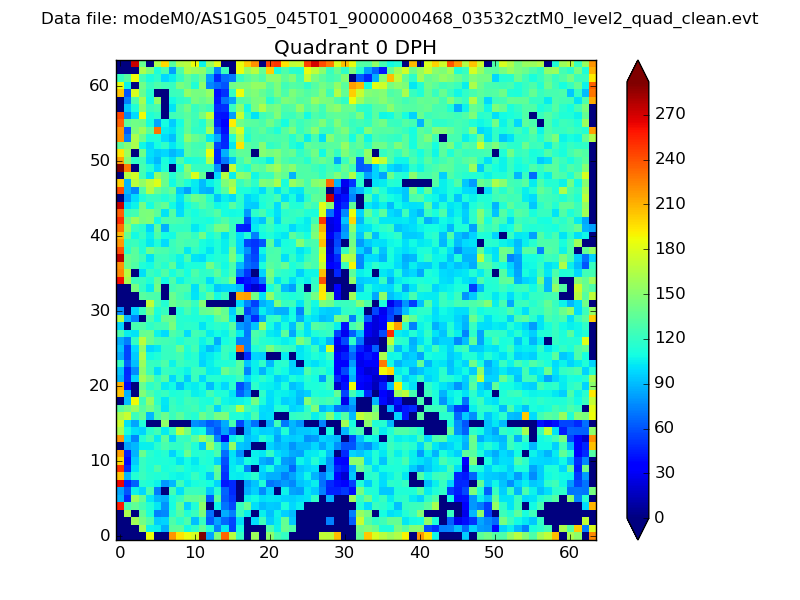 |
 |
Quadrant B |
|---|---|---|---|
| Quadrant D |  |
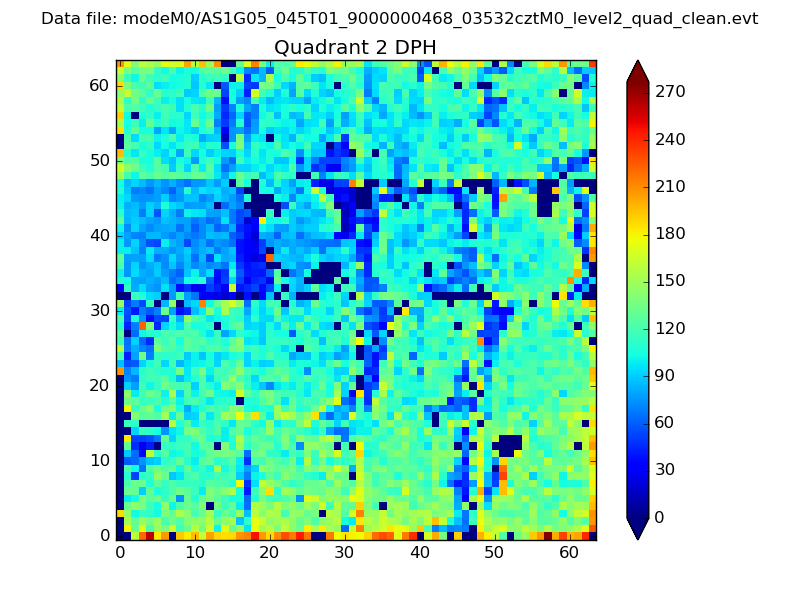 |
Quadrant C |
| Plot type | Count rate plots | Images |
|---|---|---|
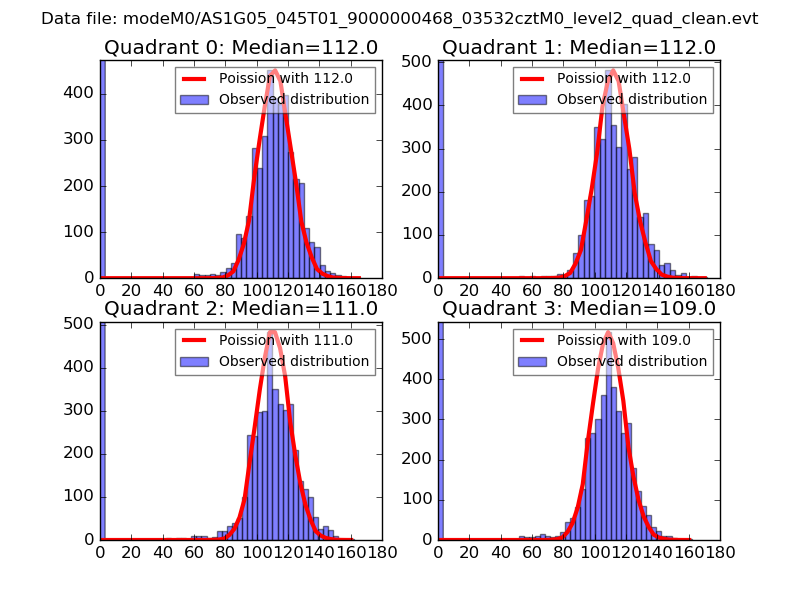
| Comparison with Poisson distribution Blue bars denote a histogram of data divided into 1 sec bins. Red curve is a Poisson curve with rate = median count rate of data. |
 |
 |
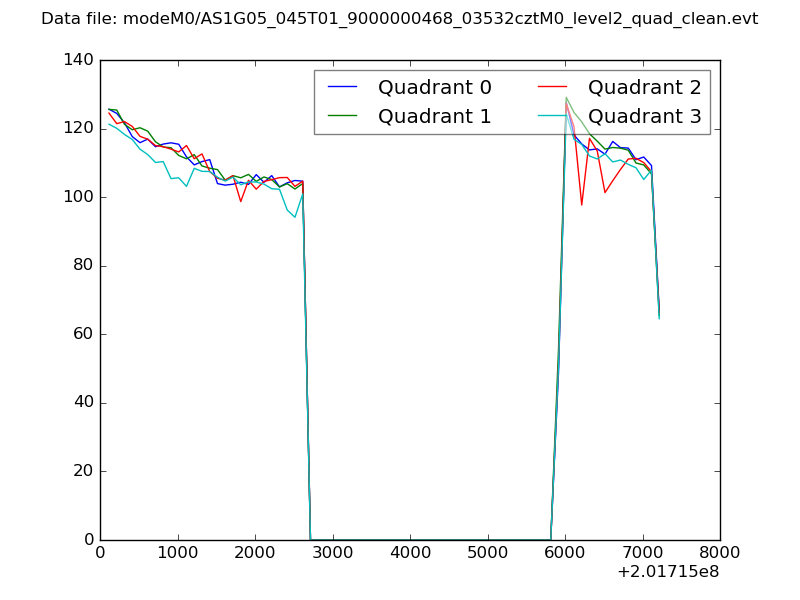
| Quadrant-wise count rates Data is divided into 100 sec bins |
 |
|
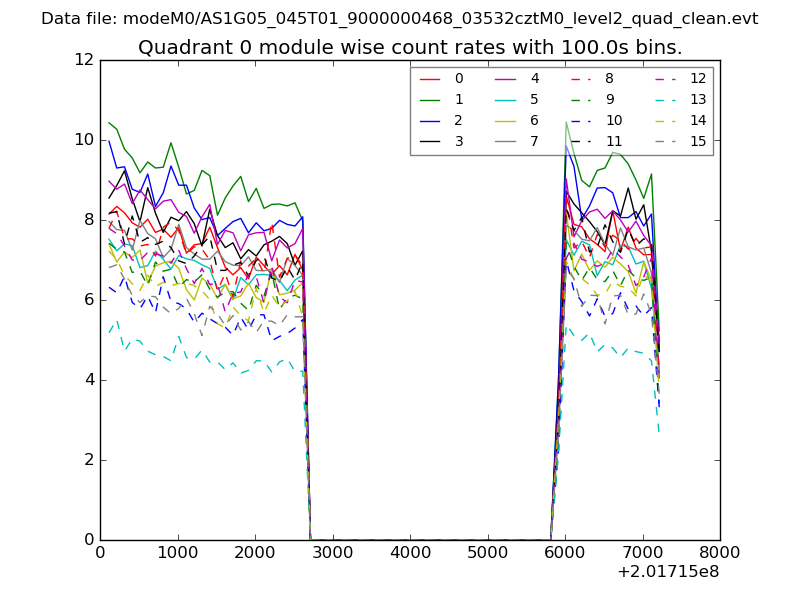
| Module-wise count rates for Quadrant A Data is divided into 100 sec bins |
 |
 |
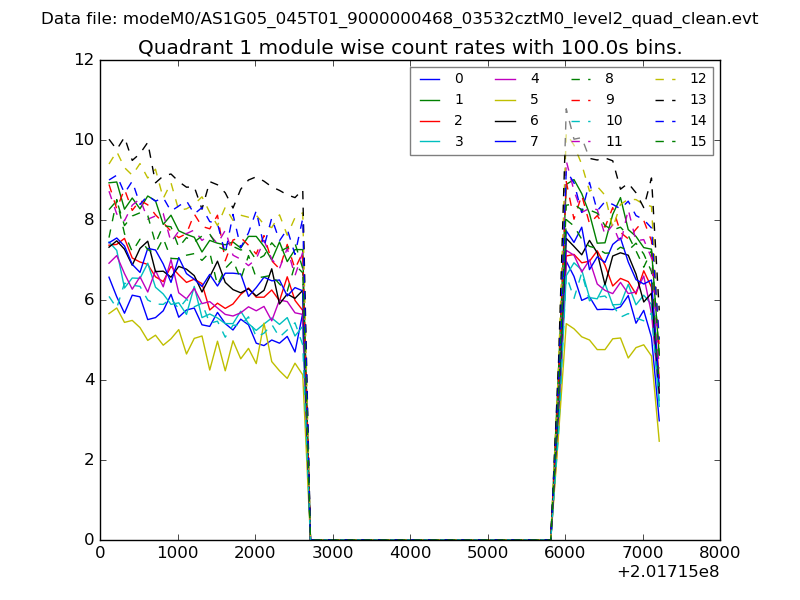
| Module-wise count rates for Quadrant B Data is divided into 100 sec bins |
 |
 |
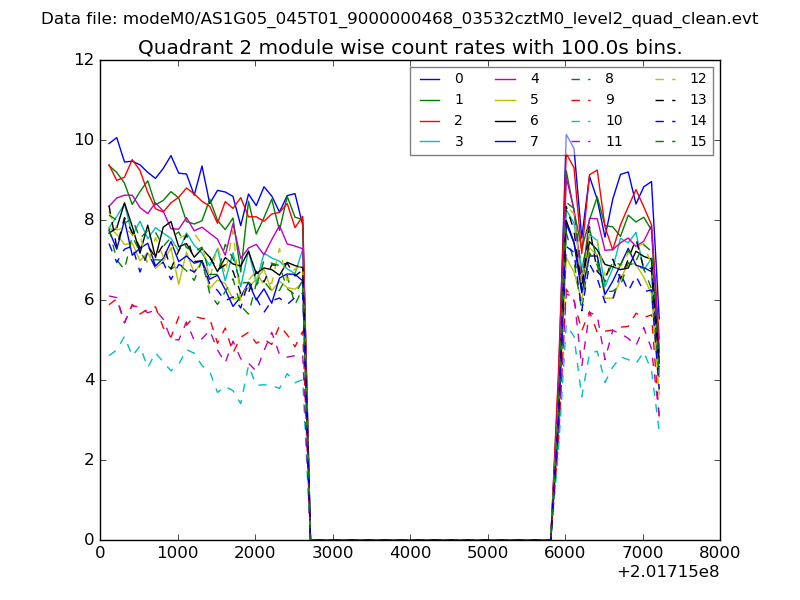
| Module-wise count rates for Quadrant C Data is divided into 100 sec bins |
 |
 |
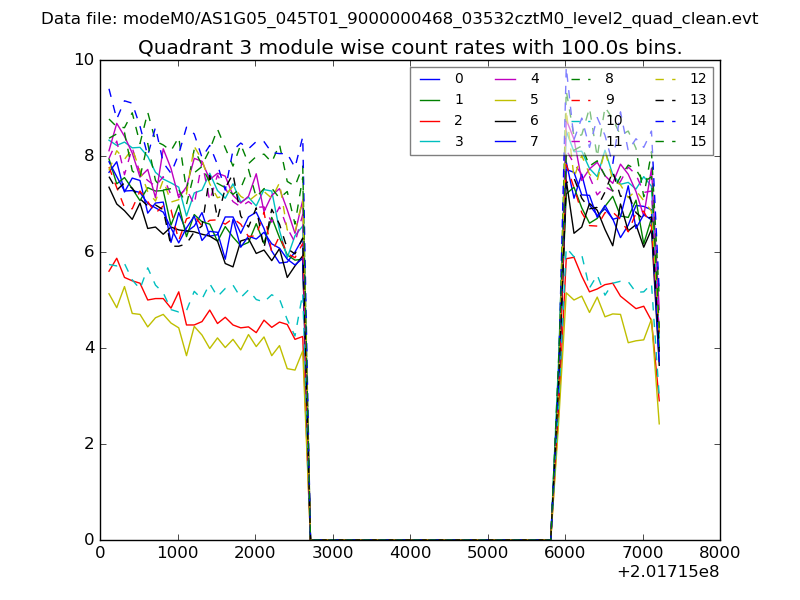
| Module-wise count rates for Quadrant D Data is divided into 100 sec bins |
 |
 |
| Parameter | Plot |
|---|---|
| CZT HV Monitor | 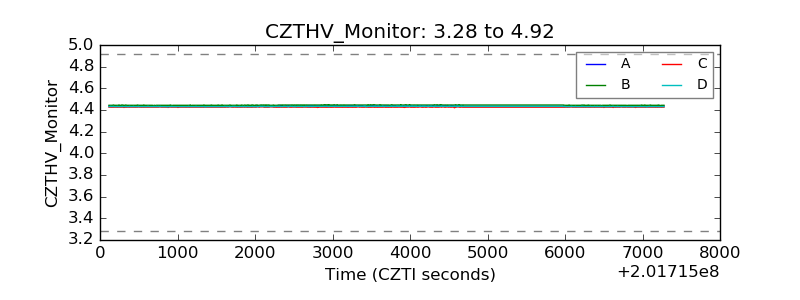 |
| D_VDD | 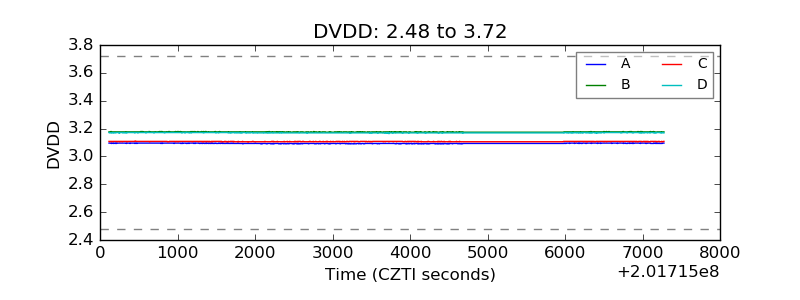 |
| Temperature 1 | 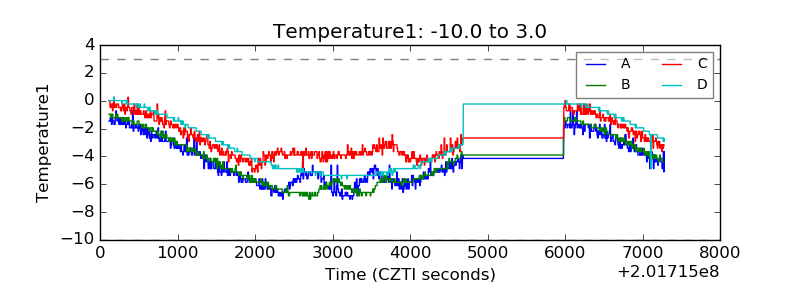 |
| Veto HV Monitor | 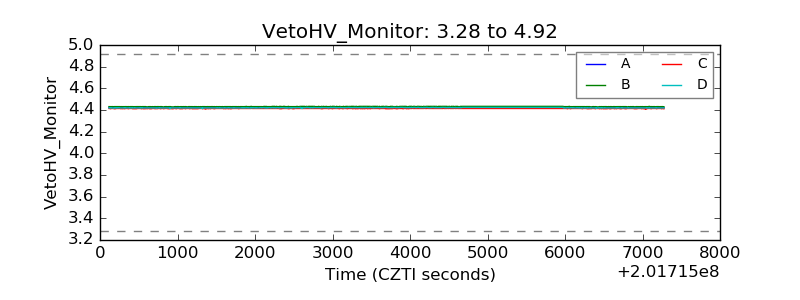 |
| Veto LLD | 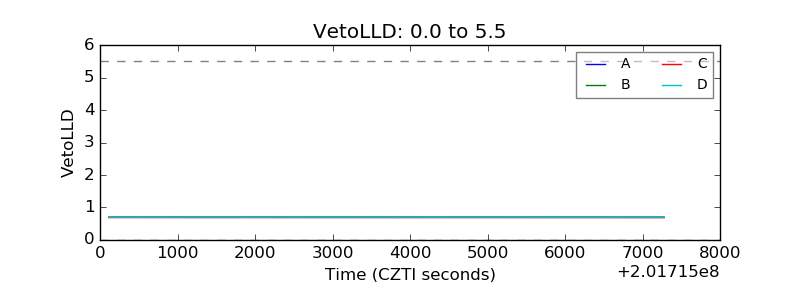 |
| Alpha Counter | 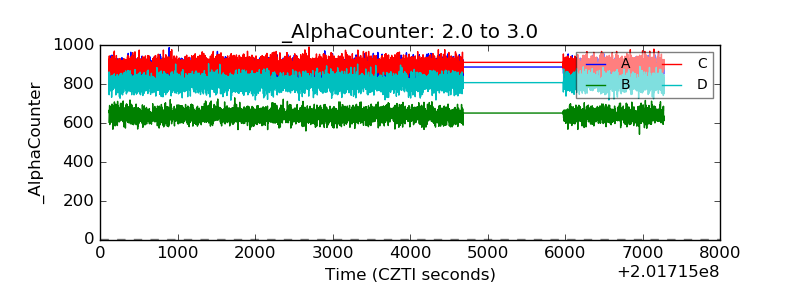 |
| _CPM_Rate | 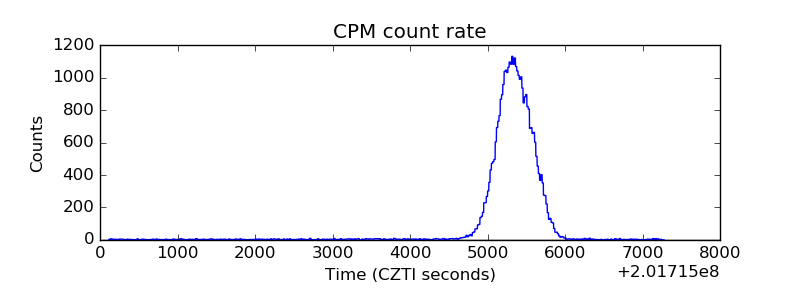 |
| CZT Counter | 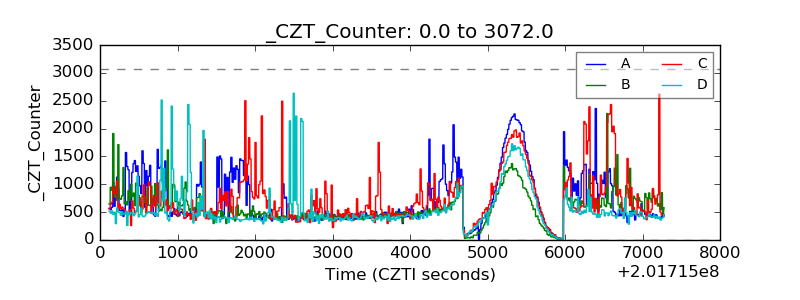 |
| +2.5 Volts monitor | 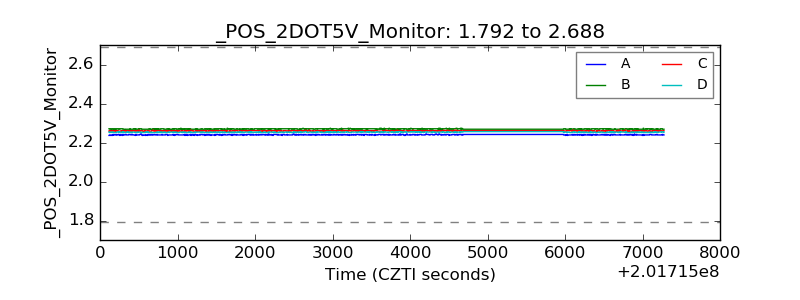 |
| +5 Volts monitor |  |
| _ROLL_ROT | 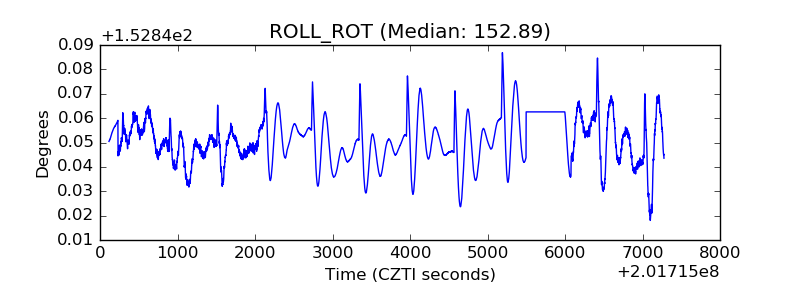 |
| _Roll_DEC | 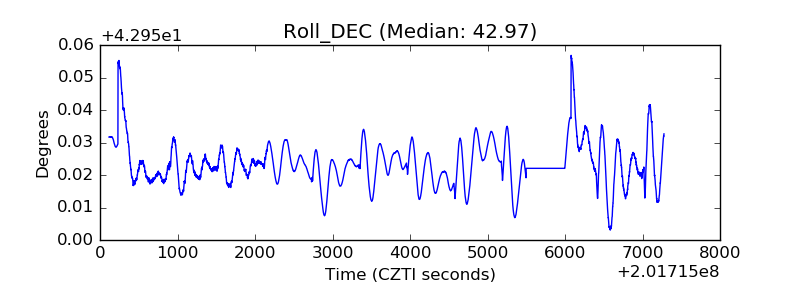 |
| _Roll_RA | 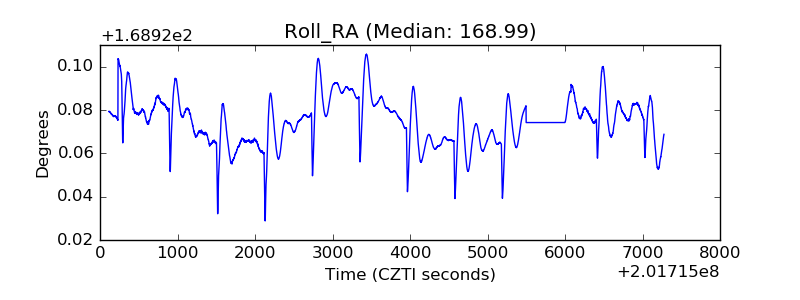 |
| Veto Counter | 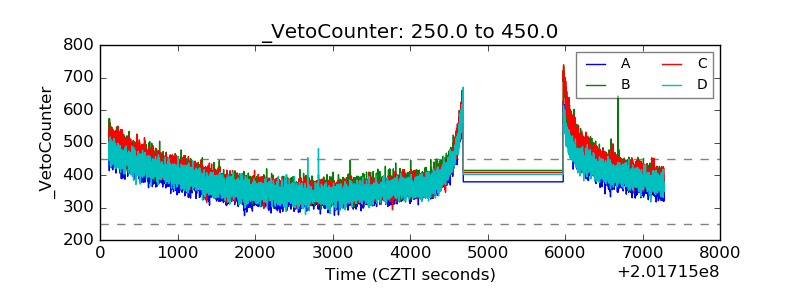 |