| Param | Original file | Final file |
|---|---|---|
| Filename | modeM0/AS1G05_045T01_9000000468_03533cztM0_level2.evt | modeM0/AS1G05_045T01_9000000468_03533cztM0_level2_quad_clean.evt |
| Size (bytes) | 472,011,840 | 76,829,760 |
| Size | 450.1 MB | 73.3 MB |
| Events in quadrant A | 3,605,148 | 471,983 |
| Events in quadrant B | 3,675,863 | 475,734 |
| Events in quadrant C | 3,576,467 | 469,177 |
| Events in quadrant D | 3,000,665 | 460,748 |
| Mode M0 | |||
|---|---|---|---|
| Quadrant | BADHDUFLAG | Total packets | Discarded packets |
| A | 0 | 15318 | 3 |
| B | 0 | 15448 | 2 |
| C | 0 | 15284 | 2 |
| D | 0 | 13816 | 2 |
| Mode M9 | |||
|---|---|---|---|
| Quadrant | BADHDUFLAG | Total packets | Discarded packets |
| A | 0 | 12 | 0 |
| B | 0 | 12 | 0 |
| C | 0 | 12 | 0 |
| D | 0 | 12 | 0 |
| Mode SS | |||
|---|---|---|---|
| Quadrant | BADHDUFLAG | Total packets | Discarded packets |
| A | 0 | 132 | 0 |
| B | 0 | 132 | 0 |
| C | 0 | 132 | 0 |
| D | 0 | 132 | 0 |
| Quadrant | Total seconds | Saturated seconds | Saturation percentage |
|---|---|---|---|
| A | 6428 | 81 | 1.260112% |
| B | 6428 | 38 | 0.591164% |
| C | 6428 | 132 | 2.053516% |
| D | 6428 | 39 | 0.606721% |
Noise dominated data is calculated using 1-second bins in cleaned event files. If a bin has >2000 counts, and if more than 50% of those come from <1% of pixels, then it is considered to be noise-dominated and hence unusable.
| Quadrant | # 1 sec bins | Bins with >0 counts | Bins with >2000 counts | High rate bins dominated by noise | Noise dominated (total time) | Noise dominated (detector-on time) | Marked lightcurve |
|---|---|---|---|---|---|---|---|
| A | 7618 | 6429 | 30 | 30 | 0.39% | 0.47% | 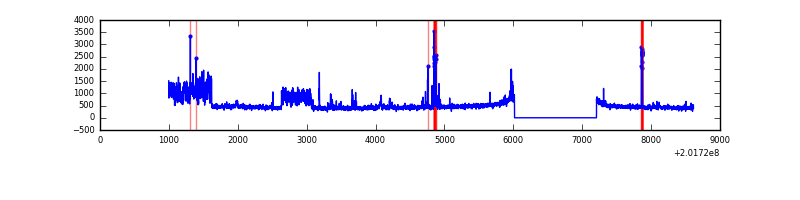 |
| B | 7618 | 6429 | 6 | 6 | 0.08% | 0.09% | 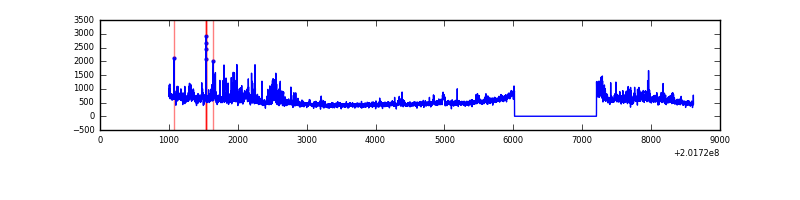 |
| C | 7618 | 6429 | 105 | 105 | 1.38% | 1.63% | 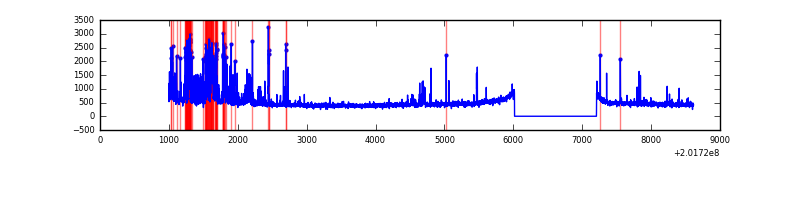 |
| D | 7618 | 6429 | 32 | 32 | 0.42% | 0.50% |  |
Top three noisy pixels from each quadrant. If the there are fewer than three noisy pixels in the level2.evt file, extra rows are filled as -1
| Pixel properties | Quadrant properties | ||||||
|---|---|---|---|---|---|---|---|
| Quadrant | DetID | PixID | Counts | Sigma | Mean | Median | Sigma |
| A | 8 | 15 | 567743 | 3781.57 | 734 | 718 | 149.9 |
| A | 0 | 50 | 132011 | 875.61 | 734 | 718 | 149.9 |
| A | 15 | 174 | 43053 | 282.34 | 734 | 718 | 149.9 |
| B | 15 | 204 | 354635 | 2475.91 | 749 | 734 | 142.9 |
| B | 14 | 167 | 213533 | 1488.75 | 749 | 734 | 142.9 |
| B | 3 | 0 | 110958 | 771.13 | 749 | 734 | 142.9 |
| C | 4 | 248 | 612077 | 3608.66 | 726 | 731 | 169.4 |
| C | 9 | 54 | 42687 | 247.66 | 726 | 731 | 169.4 |
| C | 1 | 16 | 33470 | 193.25 | 726 | 731 | 169.4 |
| D | 13 | 70 | 196160 | 1114.89 | 724 | 704 | 175.3 |
| D | 12 | 110 | 18022 | 98.78 | 724 | 704 | 175.3 |
| D | 2 | 31 | 17766 | 97.32 | 724 | 704 | 175.3 |
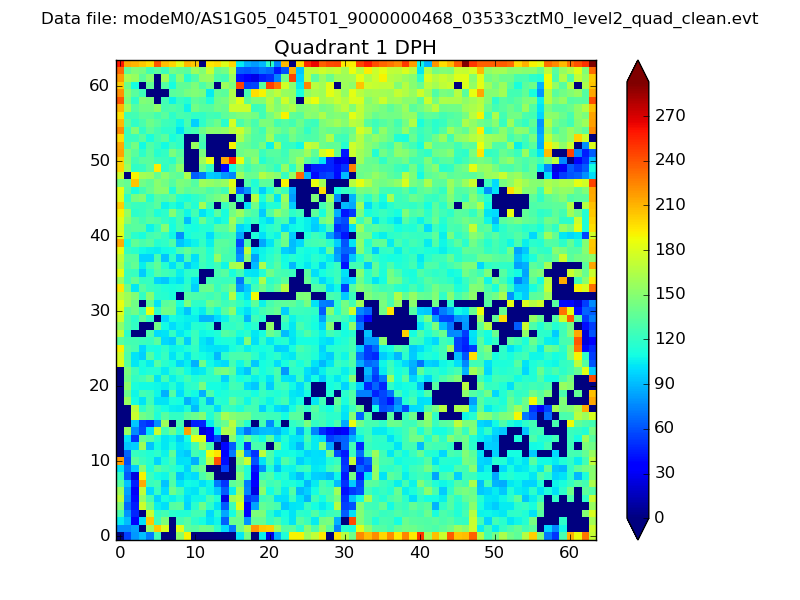
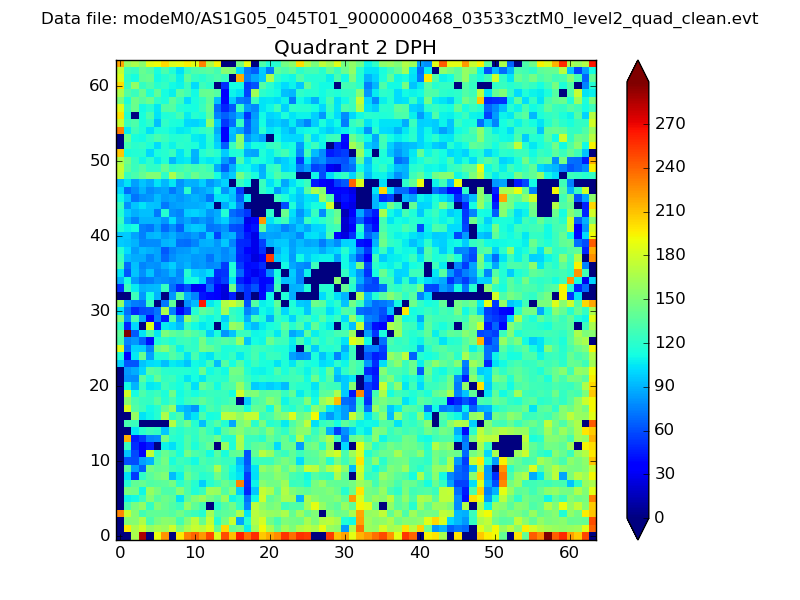
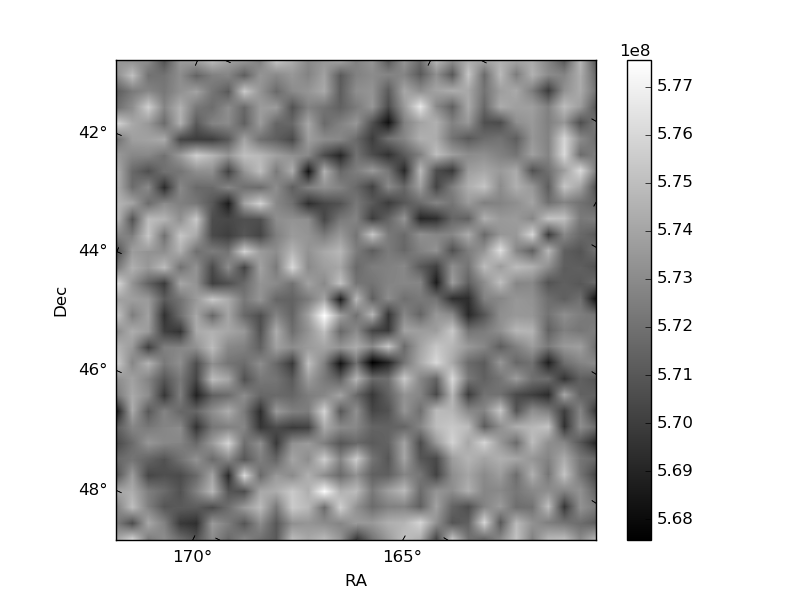
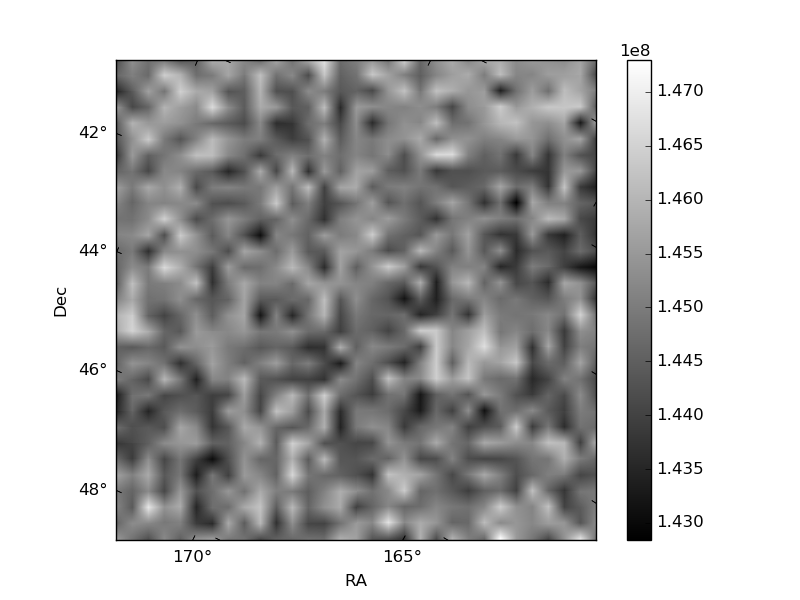
Histogram calculated using DETX and DETY for each event in the final _common_clean file
| Quadrant A | 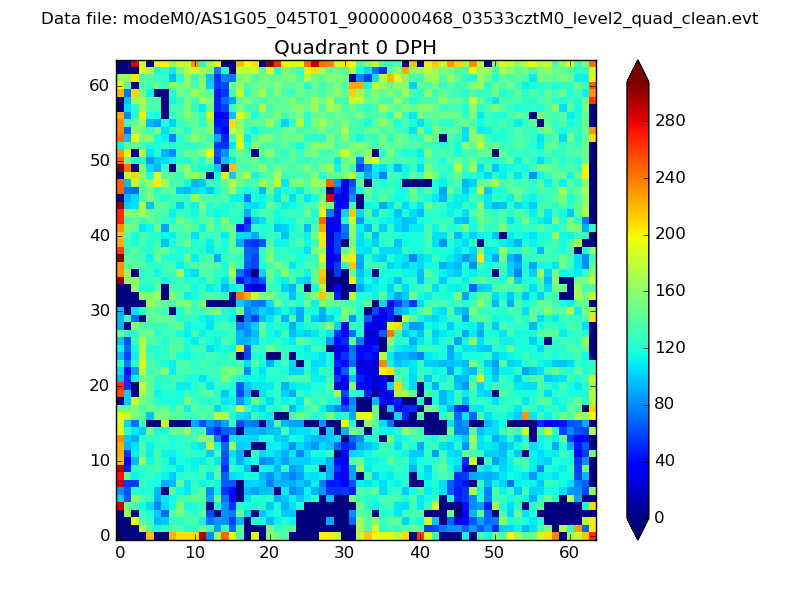 |
 |
Quadrant B |
|---|---|---|---|
| Quadrant D | 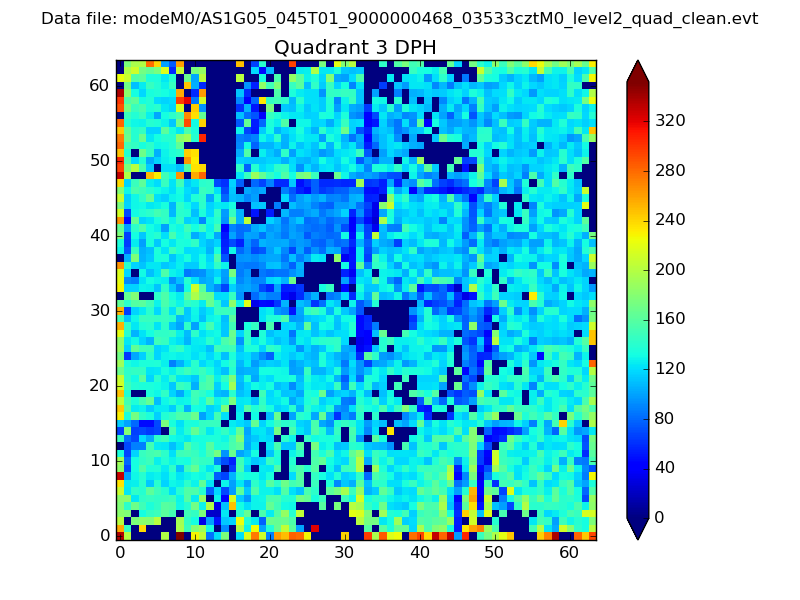 |
 |
Quadrant C |
| Plot type | Count rate plots | Images |
|---|---|---|
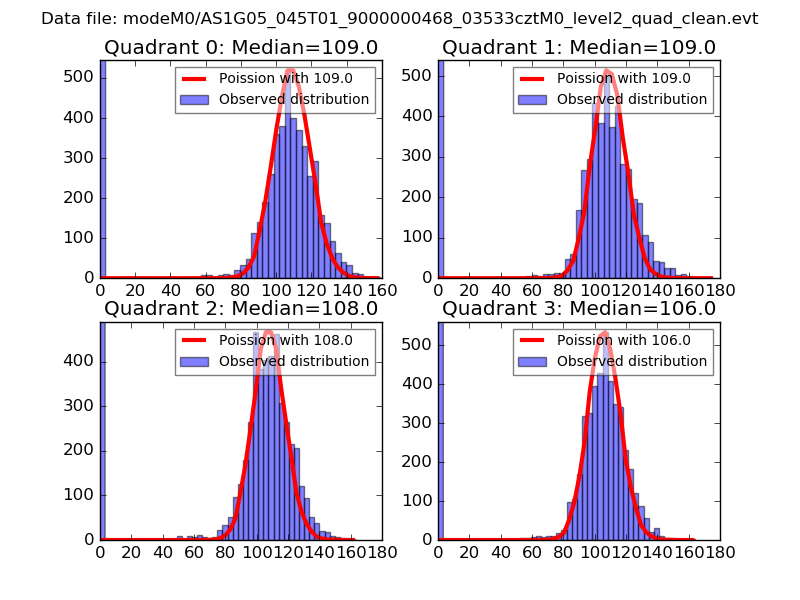
| Comparison with Poisson distribution Blue bars denote a histogram of data divided into 1 sec bins. Red curve is a Poisson curve with rate = median count rate of data. |
 |
 |
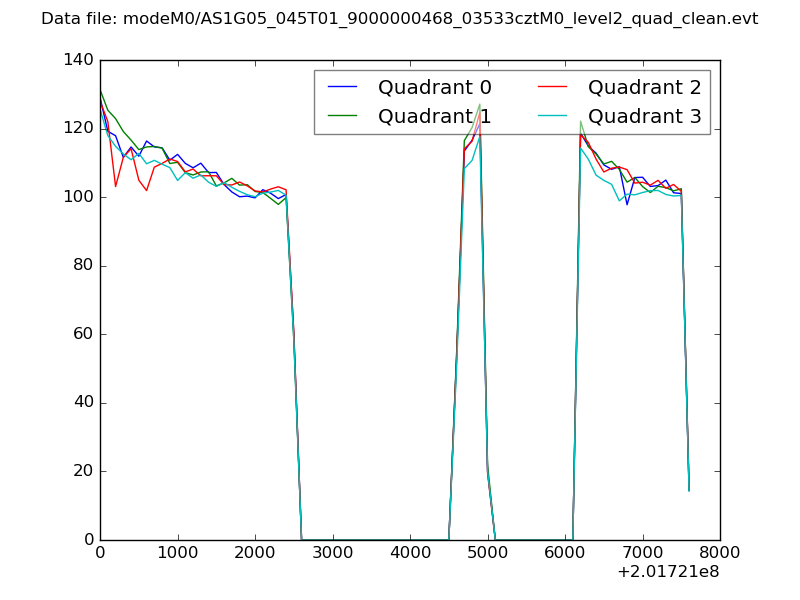
| Quadrant-wise count rates Data is divided into 100 sec bins |
 |
|
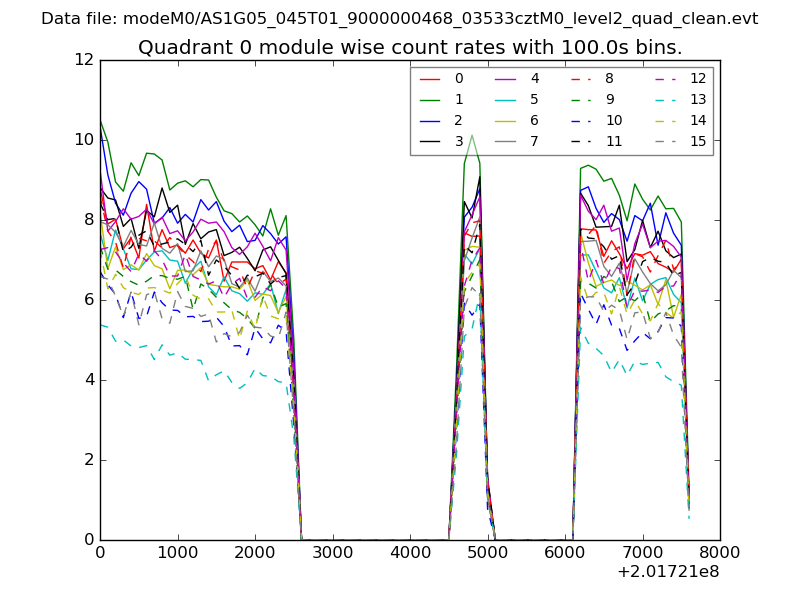
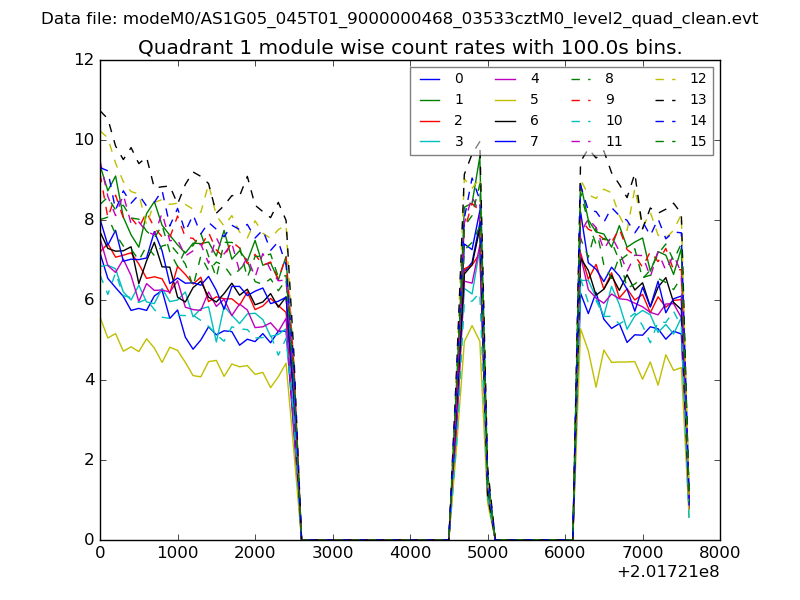
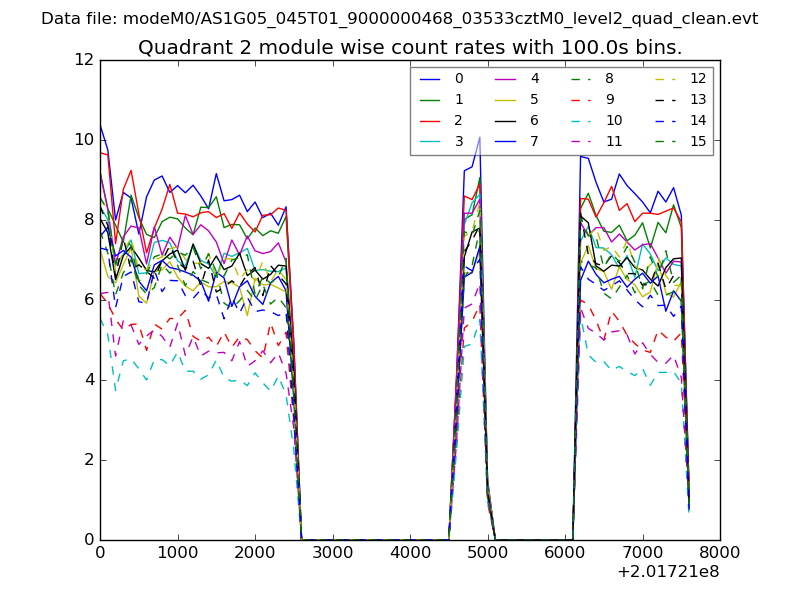
| Module-wise count rates for Quadrant A Data is divided into 100 sec bins |
 |
 |
| Module-wise count rates for Quadrant B Data is divided into 100 sec bins |
 |
 |
| Module-wise count rates for Quadrant C Data is divided into 100 sec bins |
 |
 |
| Module-wise count rates for Quadrant D Data is divided into 100 sec bins |
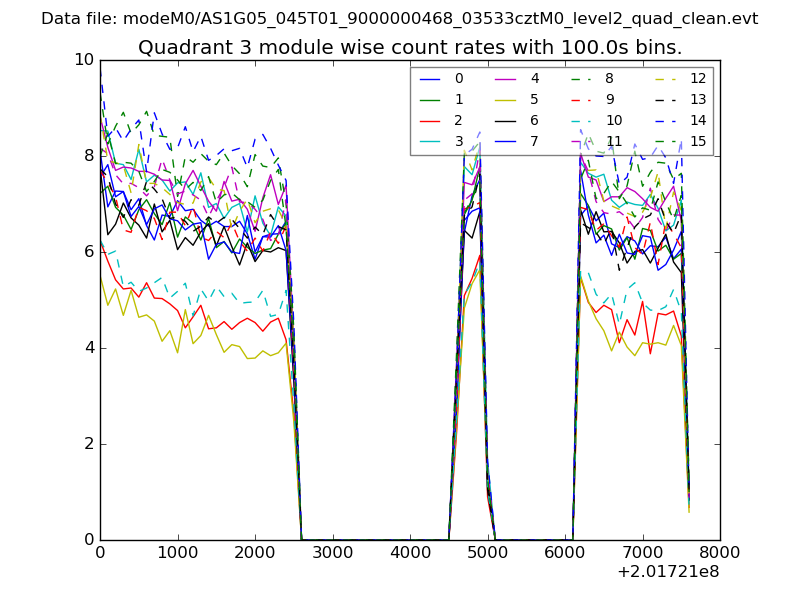 |
 |
| Parameter | Plot |
|---|---|
| CZT HV Monitor | 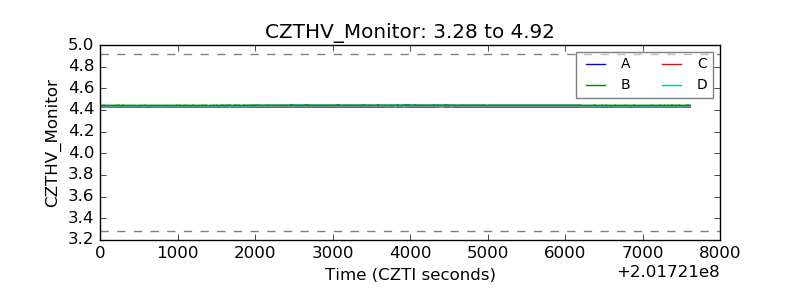 |
| D_VDD | 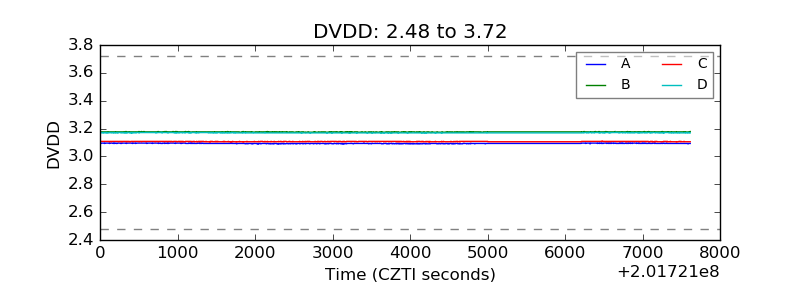 |
| Temperature 1 |  |
| Veto HV Monitor | 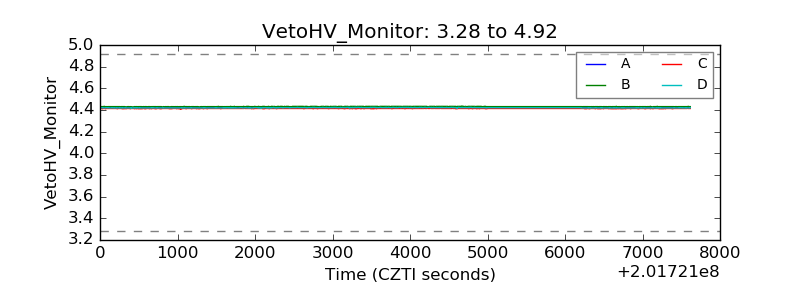 |
| Veto LLD | 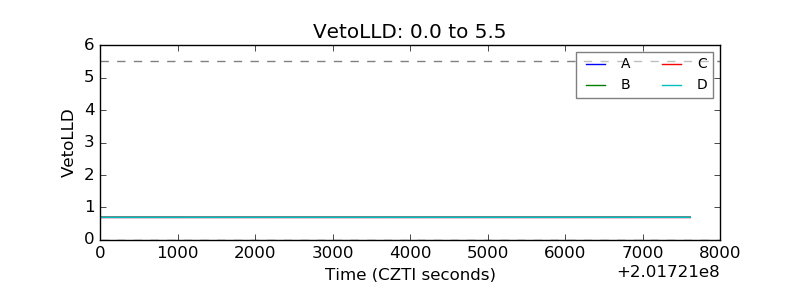 |
| Alpha Counter | 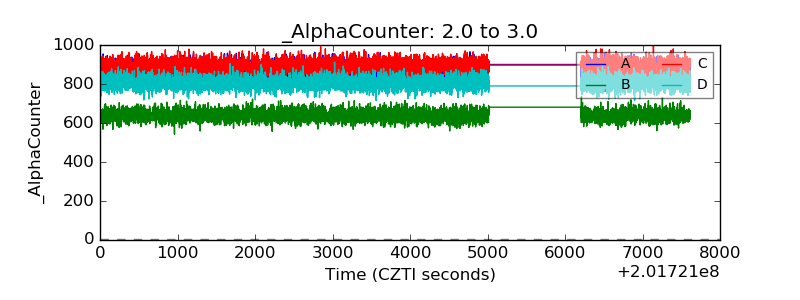 |
| _CPM_Rate | 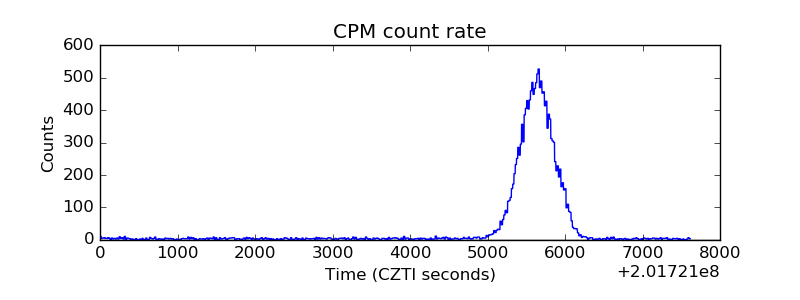 |
| CZT Counter | 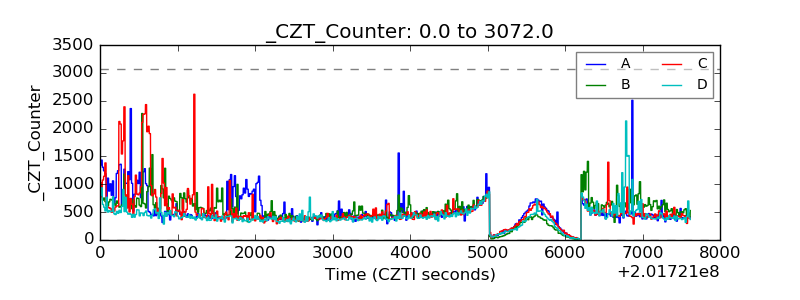 |
| +2.5 Volts monitor |  |
| +5 Volts monitor |  |
| _ROLL_ROT | 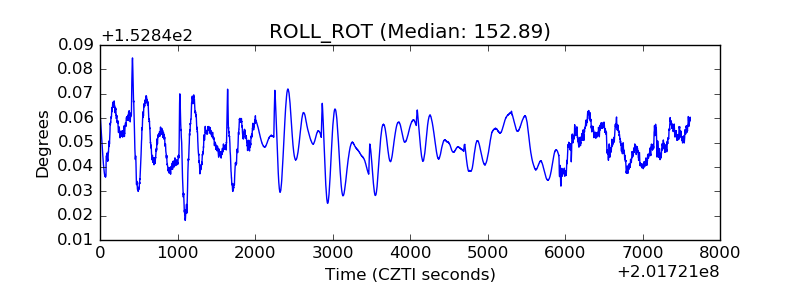 |
| _Roll_DEC | 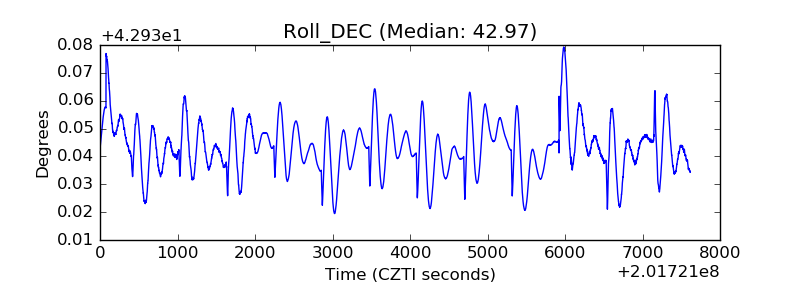 |
| _Roll_RA | 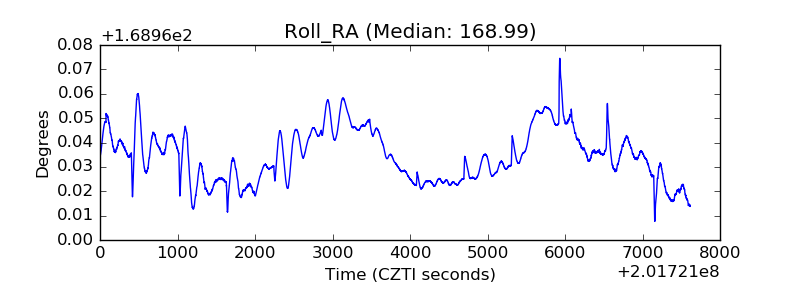 |
| Veto Counter | 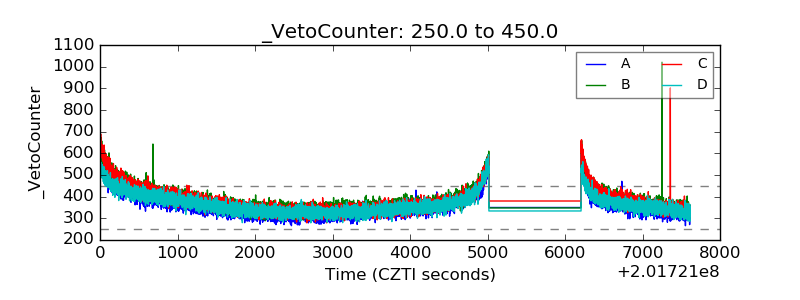 |