| Param | Original file | Final file |
|---|---|---|
| Filename | modeM0/AS1G05_045T01_9000000468_03536cztM0_level2.evt | modeM0/AS1G05_045T01_9000000468_03536cztM0_level2_quad_clean.evt |
| Size (bytes) | 657,725,760 | 110,580,480 |
| Size | 627.3 MB | 105.5 MB |
| Events in quadrant A | 4,025,173 | 697,203 |
| Events in quadrant B | 4,343,744 | 702,539 |
| Events in quadrant C | 5,830,314 | 686,307 |
| Events in quadrant D | 5,142,178 | 670,292 |
| Mode M0 | |||
|---|---|---|---|
| Quadrant | BADHDUFLAG | Total packets | Discarded packets |
| A | 0 | 18129 | 2 |
| B | 0 | 19081 | 1 |
| C | 0 | 23329 | 1 |
| D | 0 | 21311 | 1 |
| Mode M9 | |||
|---|---|---|---|
| Quadrant | BADHDUFLAG | Total packets | Discarded packets |
| A | 0 | 5 | 0 |
| B | 0 | 5 | 0 |
| C | 0 | 5 | 0 |
| D | 0 | 5 | 0 |
| Mode SS | |||
|---|---|---|---|
| Quadrant | BADHDUFLAG | Total packets | Discarded packets |
| A | 0 | 172 | 0 |
| B | 0 | 172 | 0 |
| C | 0 | 172 | 0 |
| D | 0 | 172 | 0 |
| Quadrant | Total seconds | Saturated seconds | Saturation percentage |
|---|---|---|---|
| A | 8536 | 67 | 0.784911% |
| B | 8536 | 105 | 1.230084% |
| C | 8536 | 420 | 4.920337% |
| D | 8536 | 56 | 0.656045% |
Noise dominated data is calculated using 1-second bins in cleaned event files. If a bin has >2000 counts, and if more than 50% of those come from <1% of pixels, then it is considered to be noise-dominated and hence unusable.
| Quadrant | # 1 sec bins | Bins with >0 counts | Bins with >2000 counts | High rate bins dominated by noise | Noise dominated (total time) | Noise dominated (detector-on time) | Marked lightcurve |
|---|---|---|---|---|---|---|---|
| A | 9021 | 8537 | 15 | 15 | 0.17% | 0.18% |  |
| B | 9021 | 8537 | 2 | 2 | 0.02% | 0.02% |  |
| C | 9021 | 8537 | 389 | 389 | 4.31% | 4.56% |  |
| D | 9021 | 8537 | 38 | 38 | 0.42% | 0.45% | 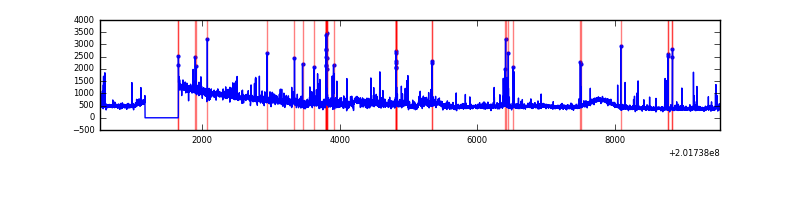 |
Top three noisy pixels from each quadrant. If the there are fewer than three noisy pixels in the level2.evt file, extra rows are filled as -1
| Pixel properties | Quadrant properties | ||||||
|---|---|---|---|---|---|---|---|
| Quadrant | DetID | PixID | Counts | Sigma | Mean | Median | Sigma |
| A | 0 | 50 | 203590 | 1008.0 | 978 | 951 | 201.0 |
| A | 0 | 118 | 27853 | 133.82 | 978 | 951 | 201.0 |
| A | 8 | 15 | 18052 | 85.06 | 978 | 951 | 201.0 |
| B | 15 | 204 | 314074 | 1618.32 | 998 | 973 | 193.5 |
| B | 0 | 229 | 36834 | 185.35 | 998 | 973 | 193.5 |
| B | 8 | 3 | 34985 | 175.8 | 998 | 973 | 193.5 |
| C | 4 | 248 | 2027190 | 9084.11 | 951 | 955 | 223.1 |
| C | 15 | 208 | 33575 | 146.24 | 951 | 955 | 223.1 |
| C | 1 | 192 | 22726 | 97.6 | 951 | 955 | 223.1 |
| D | 10 | 203 | 901642 | 3893.04 | 952 | 923 | 231.4 |
| D | 1 | 20 | 444251 | 1916.13 | 952 | 923 | 231.4 |
| D | 13 | 223 | 87006 | 372.06 | 952 | 923 | 231.4 |
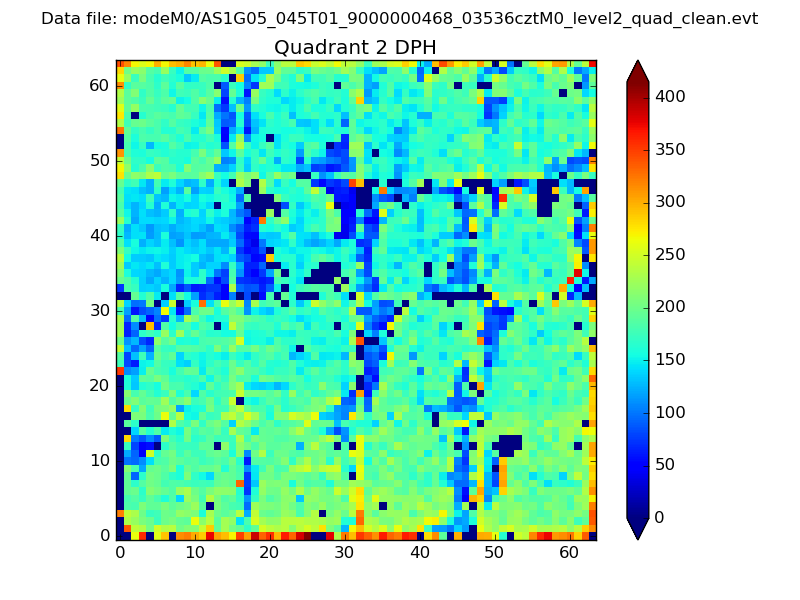
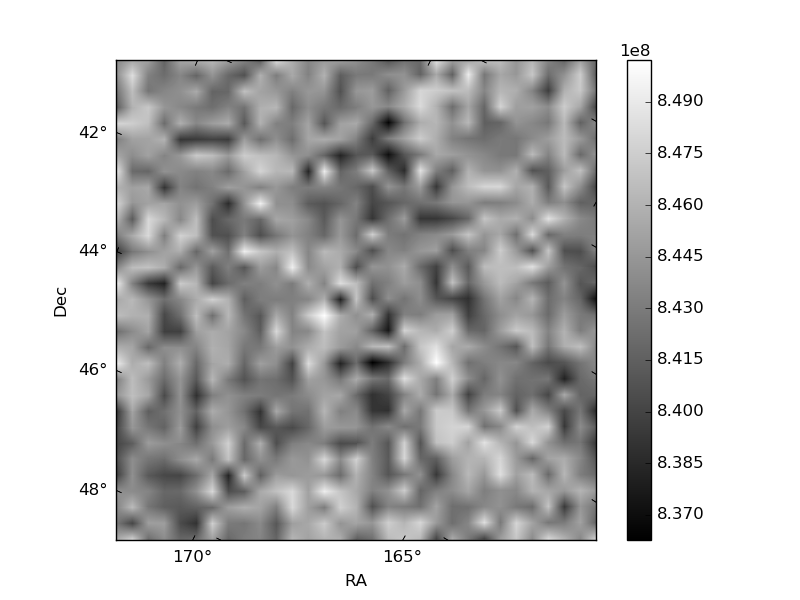
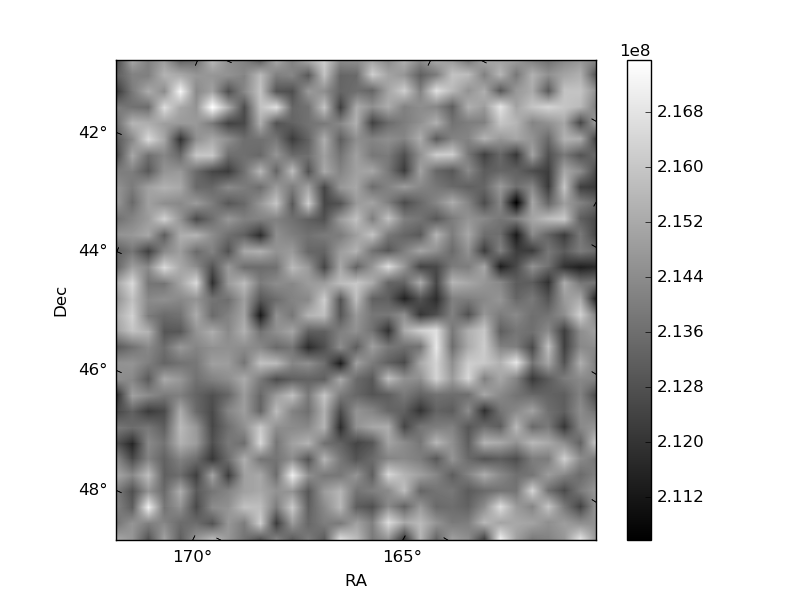
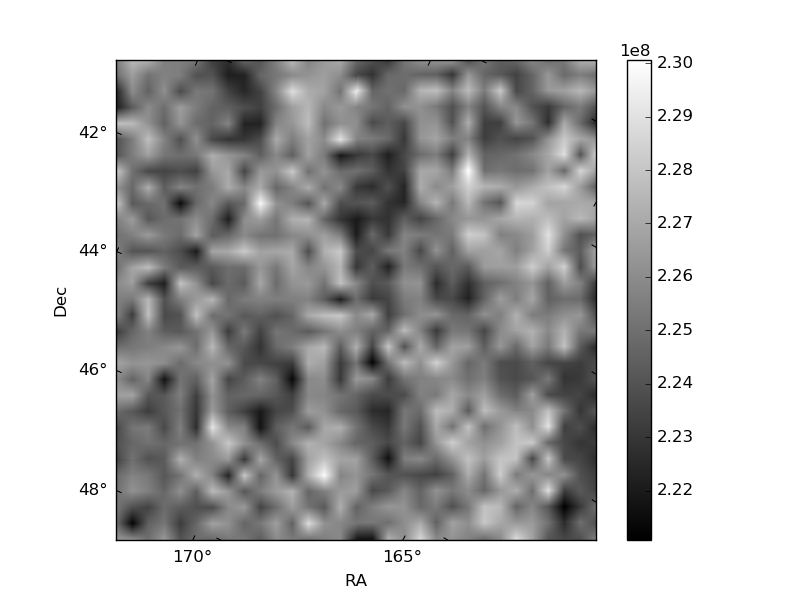
Histogram calculated using DETX and DETY for each event in the final _common_clean file
| Quadrant A |  |
 |
Quadrant B |
|---|---|---|---|
| Quadrant D | 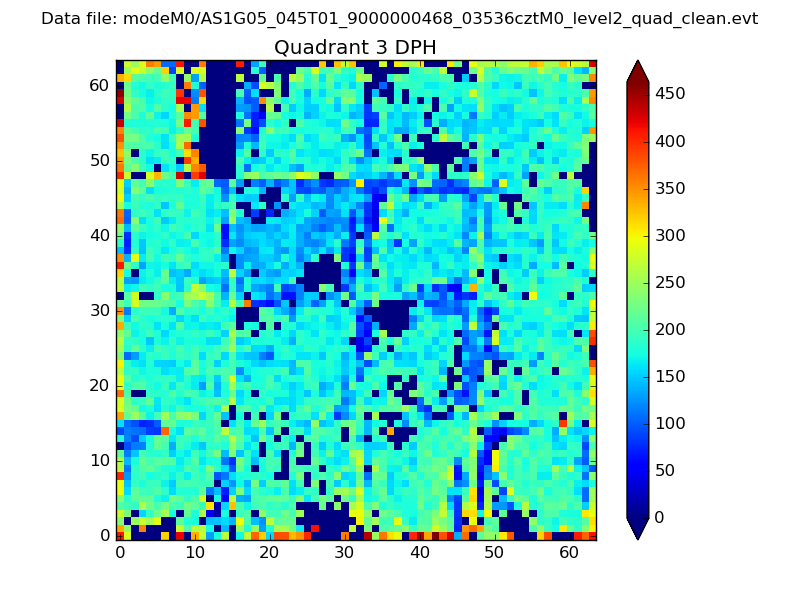 |
 |
Quadrant C |
| Plot type | Count rate plots | Images |
|---|---|---|
| Comparison with Poisson distribution Blue bars denote a histogram of data divided into 1 sec bins. Red curve is a Poisson curve with rate = median count rate of data. |
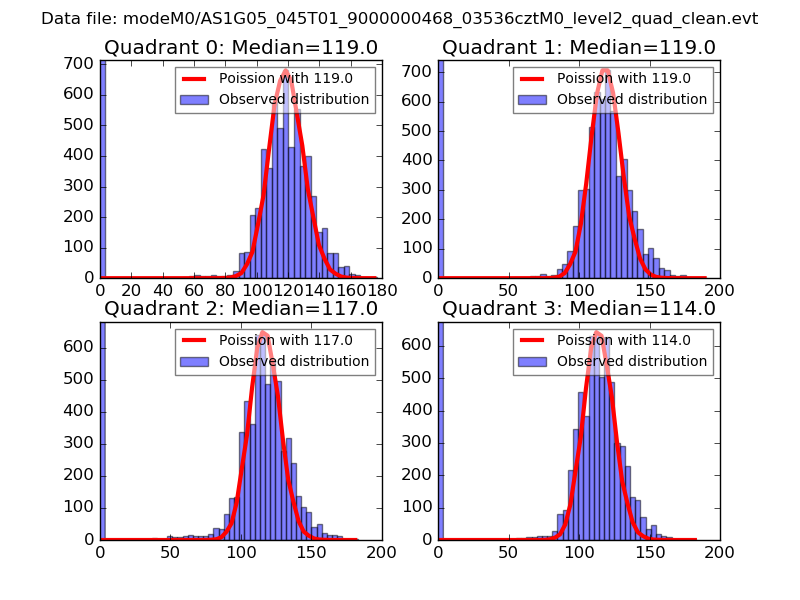 |
 |
| Quadrant-wise count rates Data is divided into 100 sec bins |
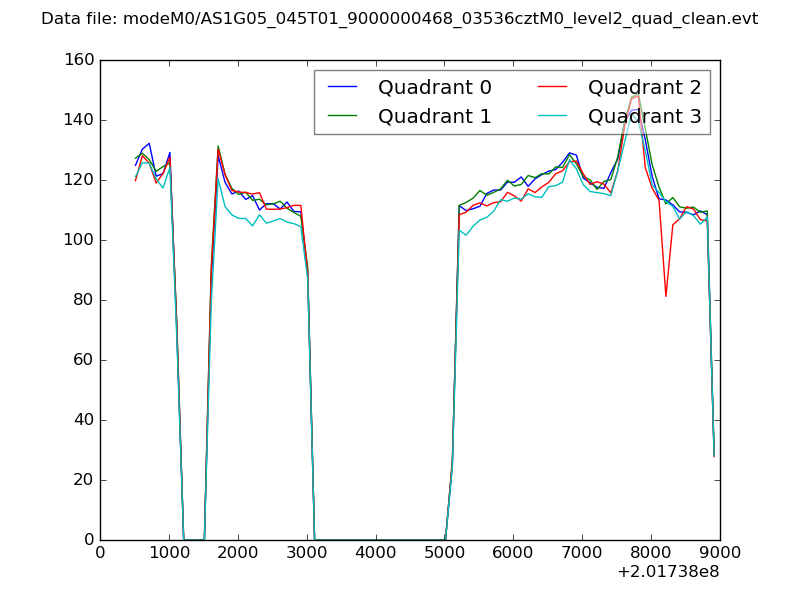 |
|
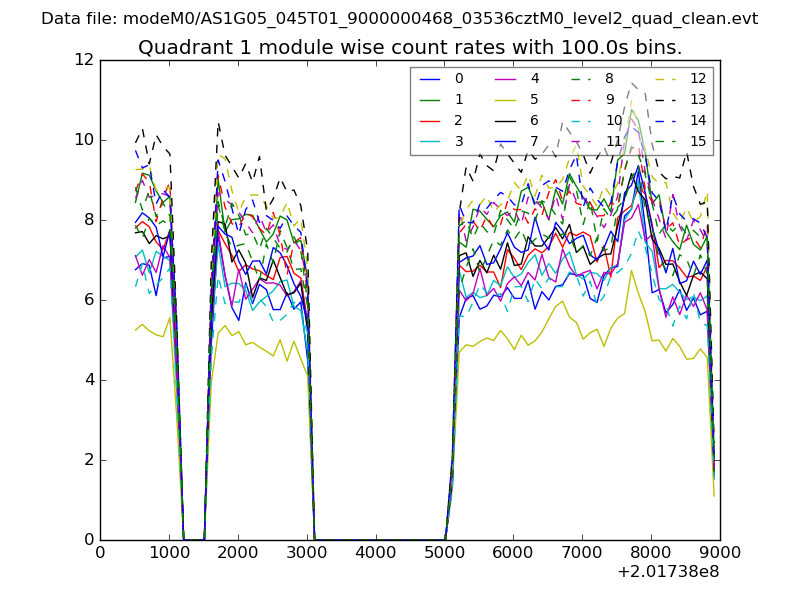
| Module-wise count rates for Quadrant A Data is divided into 100 sec bins |
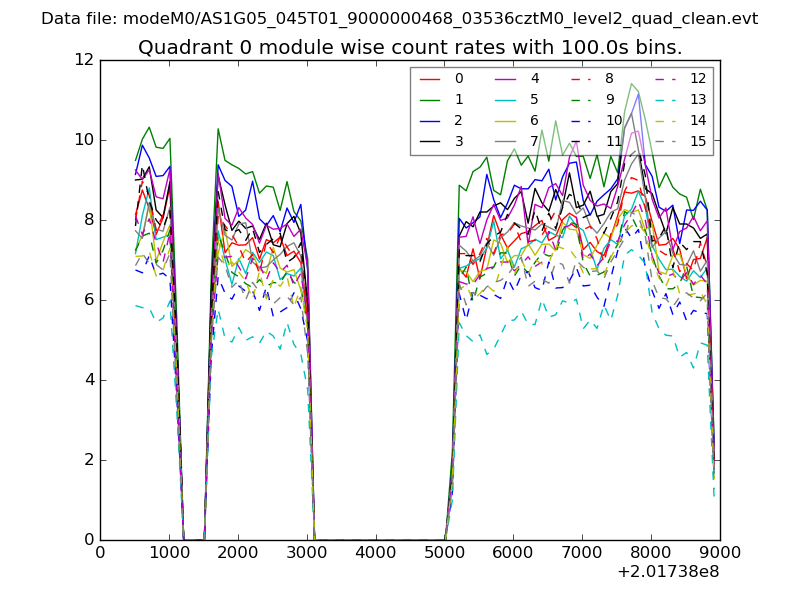 |
 |
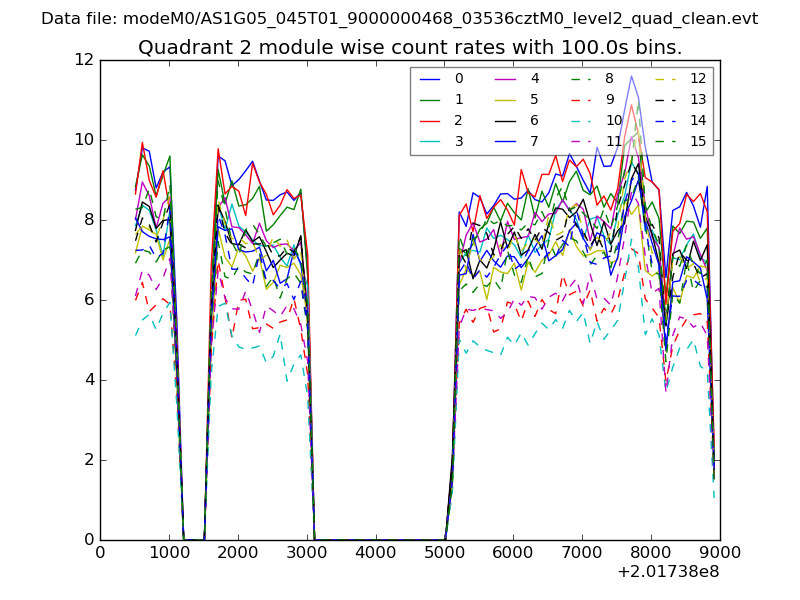
| Module-wise count rates for Quadrant B Data is divided into 100 sec bins |
 |
 |
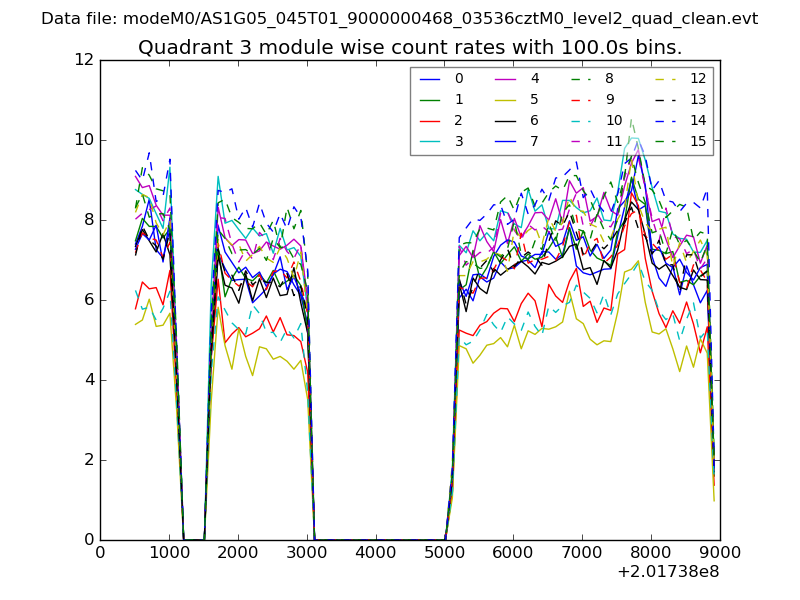
| Module-wise count rates for Quadrant C Data is divided into 100 sec bins |
 |
 |
| Module-wise count rates for Quadrant D Data is divided into 100 sec bins |
 |
 |
| Parameter | Plot |
|---|---|
| CZT HV Monitor | 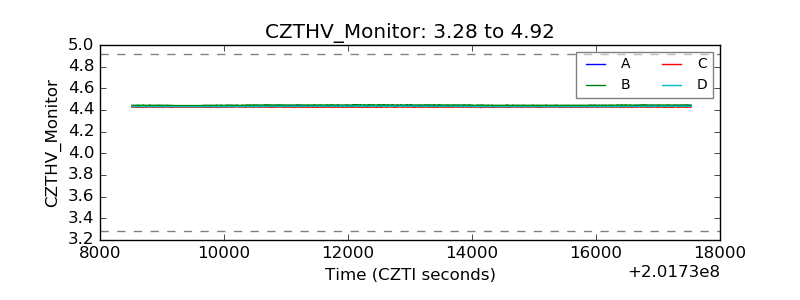 |
| D_VDD | 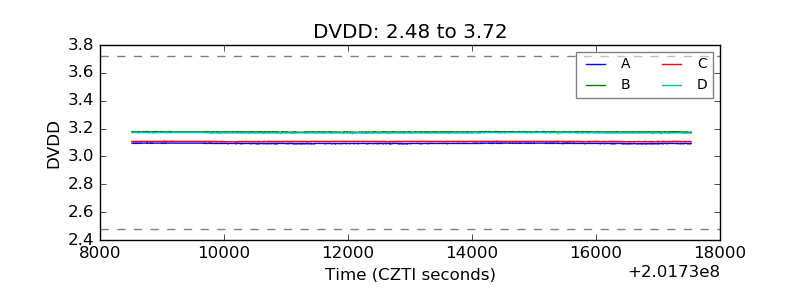 |
| Temperature 1 | 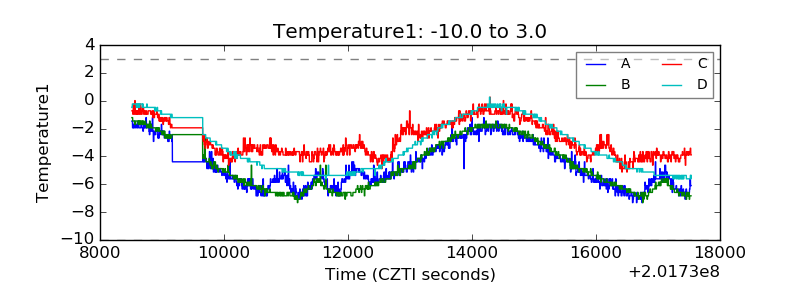 |
| Veto HV Monitor | 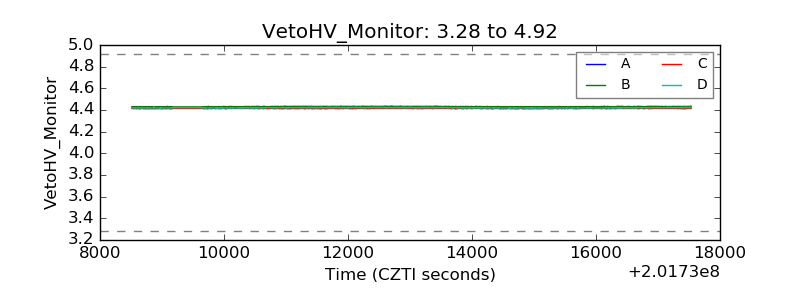 |
| Veto LLD | 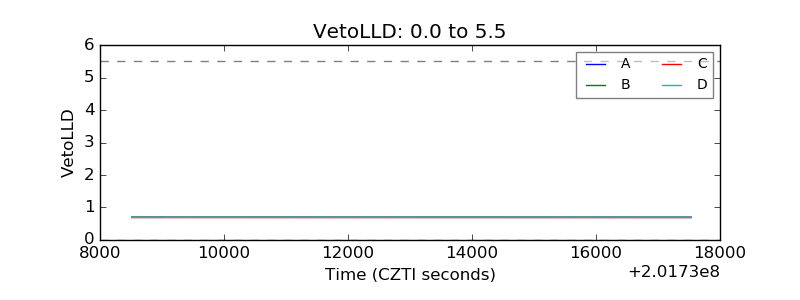 |
| Alpha Counter | 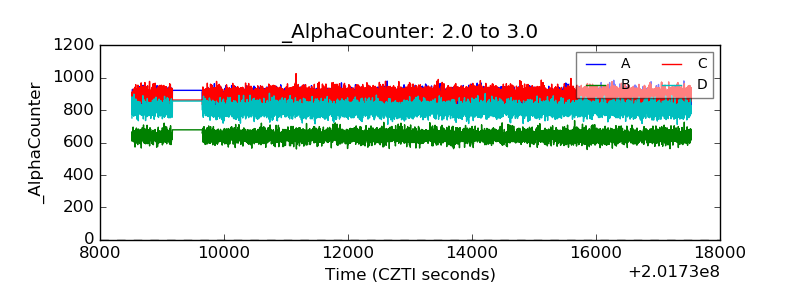 |
| _CPM_Rate | 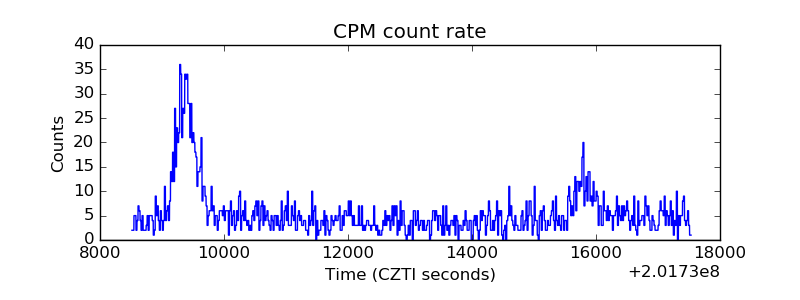 |
| CZT Counter | 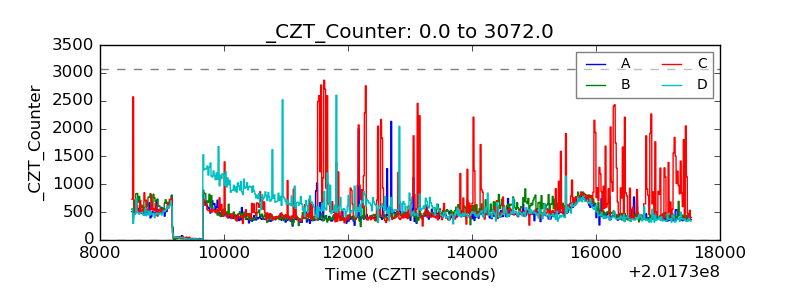 |
| +2.5 Volts monitor | 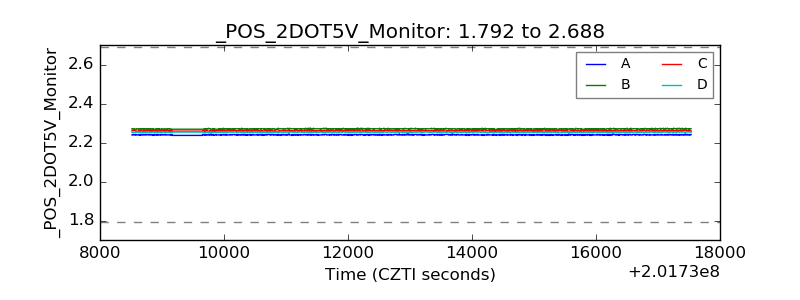 |
| +5 Volts monitor |  |
| _ROLL_ROT | 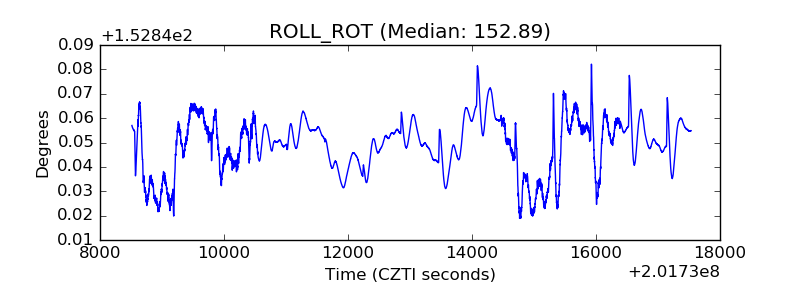 |
| _Roll_DEC | 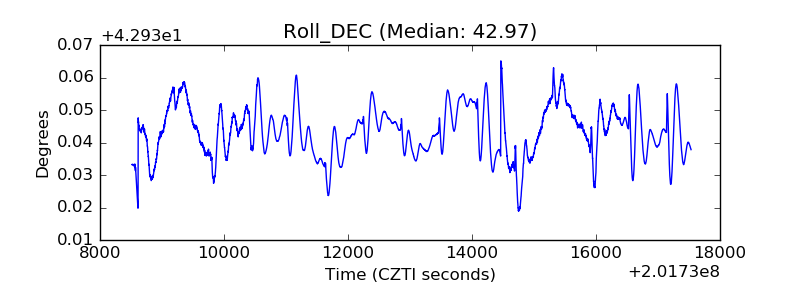 |
| _Roll_RA | 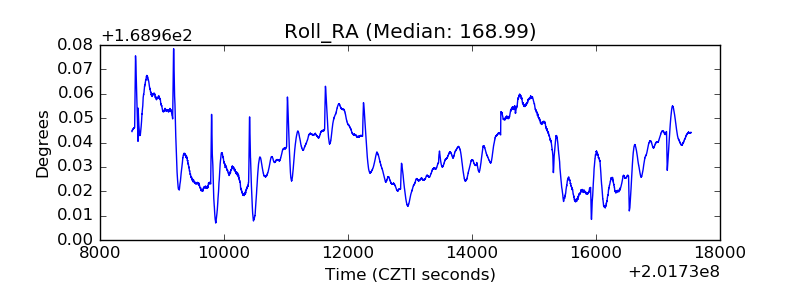 |
| Veto Counter | 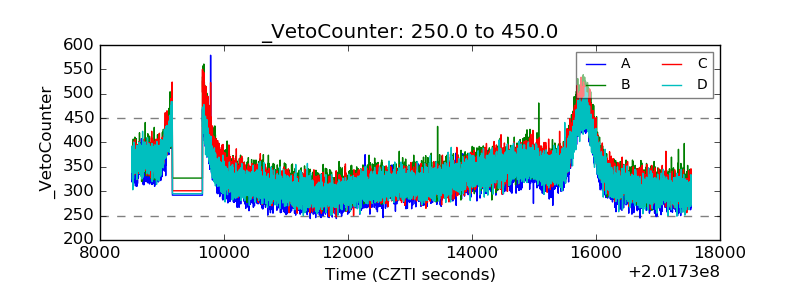 |