| Param | Original file | Final file |
|---|---|---|
| Filename | modeM0/AS1G05_045T01_9000000468_03537cztM0_level2.evt | modeM0/AS1G05_045T01_9000000468_03537cztM0_level2_quad_clean.evt |
| Size (bytes) | 606,908,160 | 101,404,800 |
| Size | 578.8 MB | 96.7 MB |
| Events in quadrant A | 4,125,336 | 628,023 |
| Events in quadrant B | 4,273,413 | 635,449 |
| Events in quadrant C | 5,578,288 | 618,251 |
| Events in quadrant D | 3,837,884 | 609,802 |
| Mode M0 | |||
|---|---|---|---|
| Quadrant | BADHDUFLAG | Total packets | Discarded packets |
| A | 0 | 18296 | 2 |
| B | 0 | 18647 | 1 |
| C | 0 | 22422 | 1 |
| D | 0 | 17904 | 1 |
| Mode M9 | |||
|---|---|---|---|
| Quadrant | BADHDUFLAG | Total packets | Discarded packets |
| A | 0 | 1 | 0 |
| B | 0 | 1 | 0 |
| C | 0 | 1 | 0 |
| D | 0 | 1 | 0 |
| Mode SS | |||
|---|---|---|---|
| Quadrant | BADHDUFLAG | Total packets | Discarded packets |
| A | 0 | 170 | 0 |
| B | 0 | 170 | 0 |
| C | 0 | 170 | 0 |
| D | 0 | 170 | 0 |
| Quadrant | Total seconds | Saturated seconds | Saturation percentage |
|---|---|---|---|
| A | 8329 | 273 | 3.277704% |
| B | 8329 | 217 | 2.605355% |
| C | 8329 | 382 | 4.586385% |
| D | 8329 | 127 | 1.524793% |
Noise dominated data is calculated using 1-second bins in cleaned event files. If a bin has >2000 counts, and if more than 50% of those come from <1% of pixels, then it is considered to be noise-dominated and hence unusable.
| Quadrant | # 1 sec bins | Bins with >0 counts | Bins with >2000 counts | High rate bins dominated by noise | Noise dominated (total time) | Noise dominated (detector-on time) | Marked lightcurve |
|---|---|---|---|---|---|---|---|
| A | 8479 | 8329 | 87 | 87 | 1.03% | 1.04% | 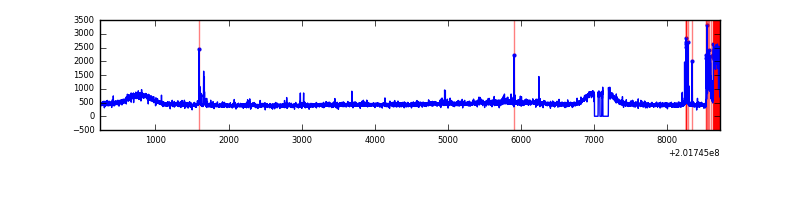 |
| B | 8479 | 8329 | 3 | 3 | 0.04% | 0.04% | 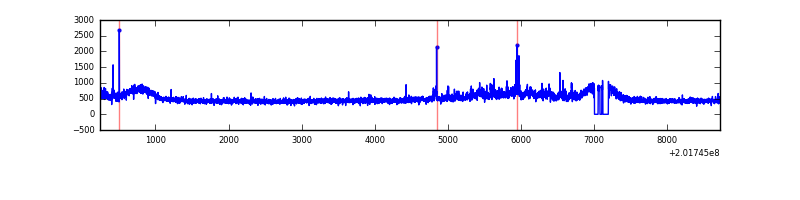 |
| C | 8479 | 8330 | 258 | 258 | 3.04% | 3.10% |  |
| D | 8479 | 8331 | 36 | 36 | 0.42% | 0.43% | 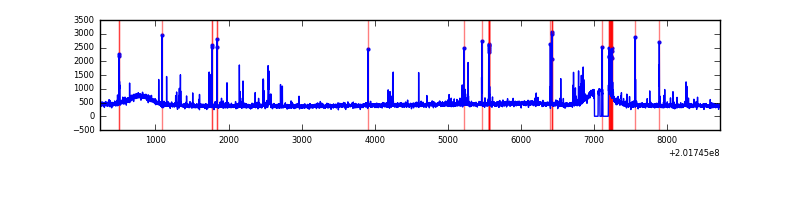 |
Top three noisy pixels from each quadrant. If the there are fewer than three noisy pixels in the level2.evt file, extra rows are filled as -1
| Pixel properties | Quadrant properties | ||||||
|---|---|---|---|---|---|---|---|
| Quadrant | DetID | PixID | Counts | Sigma | Mean | Median | Sigma |
| A | 0 | 50 | 324604 | 1624.06 | 963 | 936 | 199.3 |
| A | 8 | 15 | 42337 | 207.73 | 963 | 936 | 199.3 |
| A | 0 | 118 | 22629 | 108.85 | 963 | 936 | 199.3 |
| B | 15 | 204 | 332062 | 1722.23 | 985 | 961 | 192.3 |
| B | 14 | 167 | 45043 | 229.29 | 985 | 961 | 192.3 |
| B | 0 | 229 | 31925 | 161.06 | 985 | 961 | 192.3 |
| C | 4 | 248 | 1786686 | 8042.31 | 944 | 948 | 222.0 |
| C | 15 | 208 | 47794 | 210.98 | 944 | 948 | 222.0 |
| C | 9 | 54 | 45145 | 199.05 | 944 | 948 | 222.0 |
| D | 13 | 223 | 111532 | 486.93 | 939 | 910 | 227.2 |
| D | 12 | 110 | 51778 | 223.91 | 939 | 910 | 227.2 |
| D | 13 | 239 | 32337 | 138.33 | 939 | 910 | 227.2 |
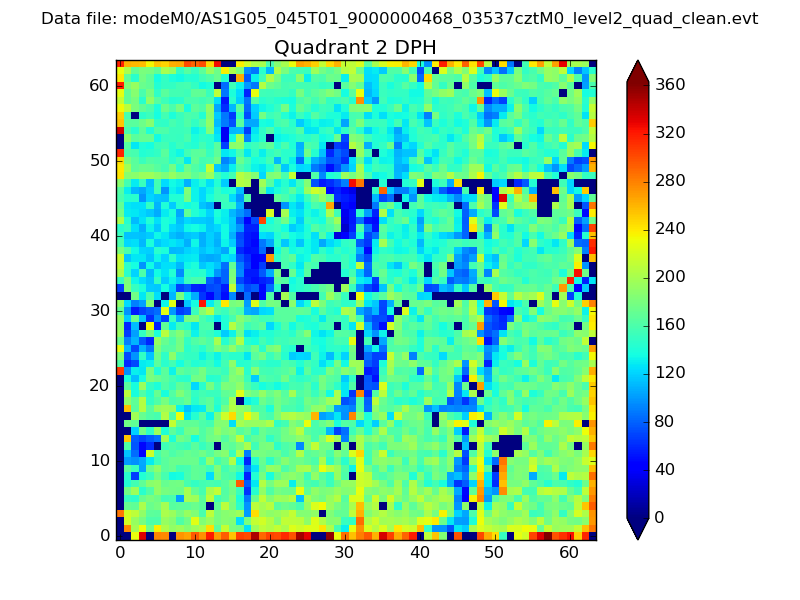
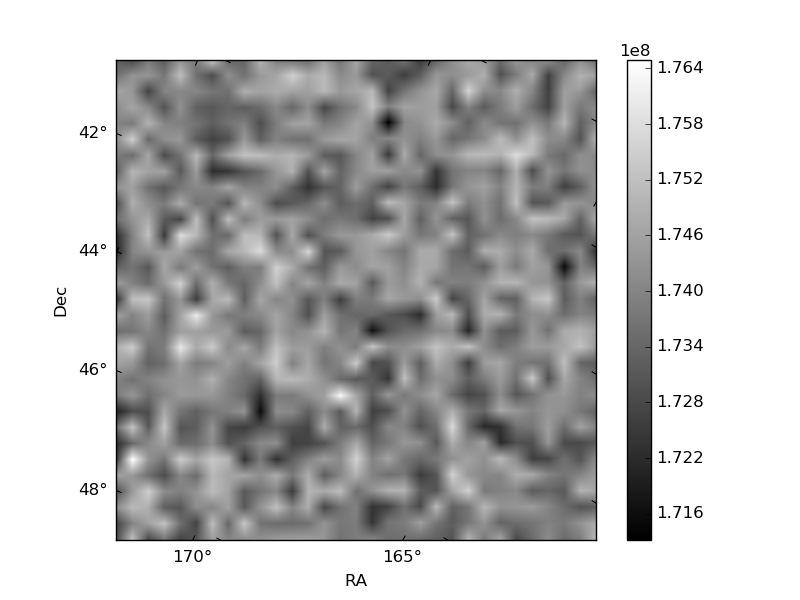
Histogram calculated using DETX and DETY for each event in the final _common_clean file
| Quadrant A |  |
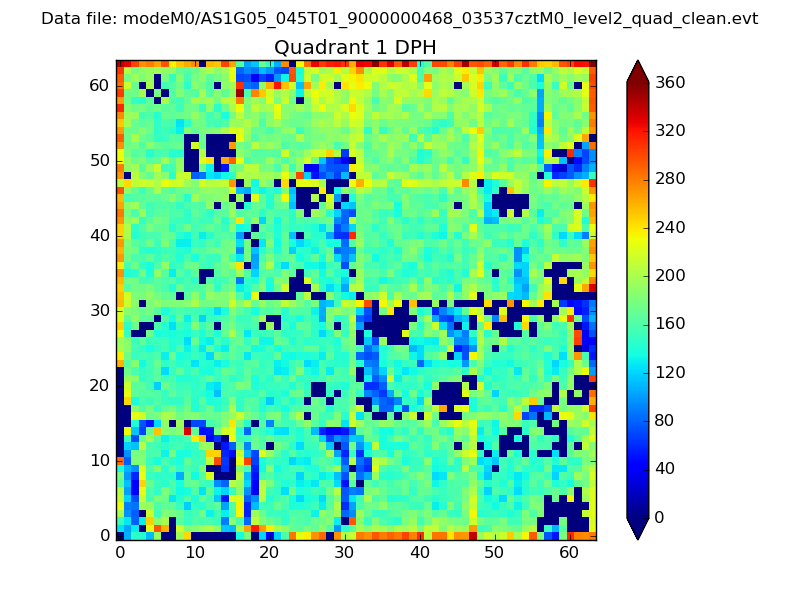 |
Quadrant B |
|---|---|---|---|
| Quadrant D | 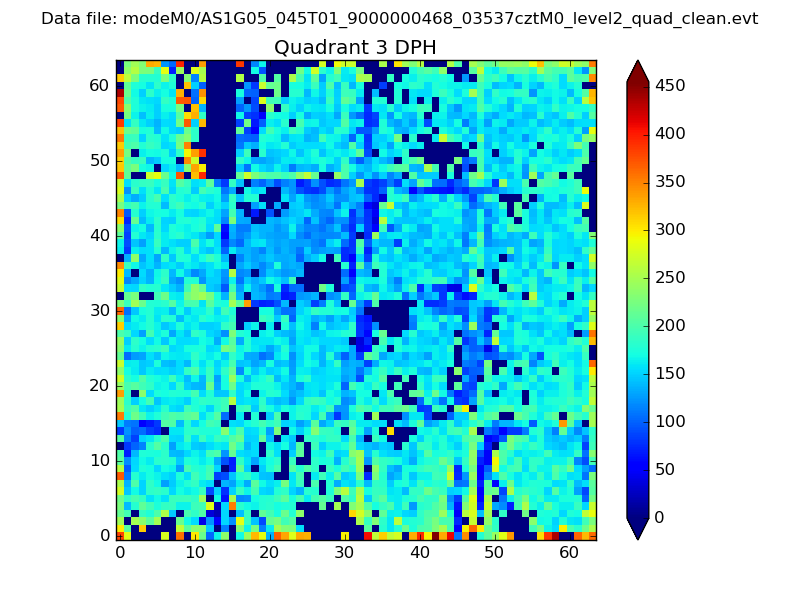 |
 |
Quadrant C |
| Plot type | Count rate plots | Images |
|---|---|---|
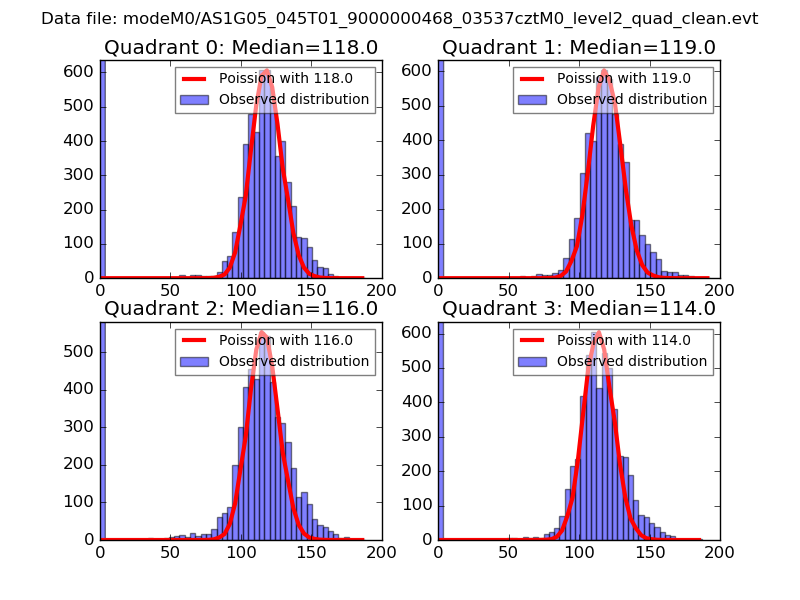
| Comparison with Poisson distribution Blue bars denote a histogram of data divided into 1 sec bins. Red curve is a Poisson curve with rate = median count rate of data. |
 |
 |
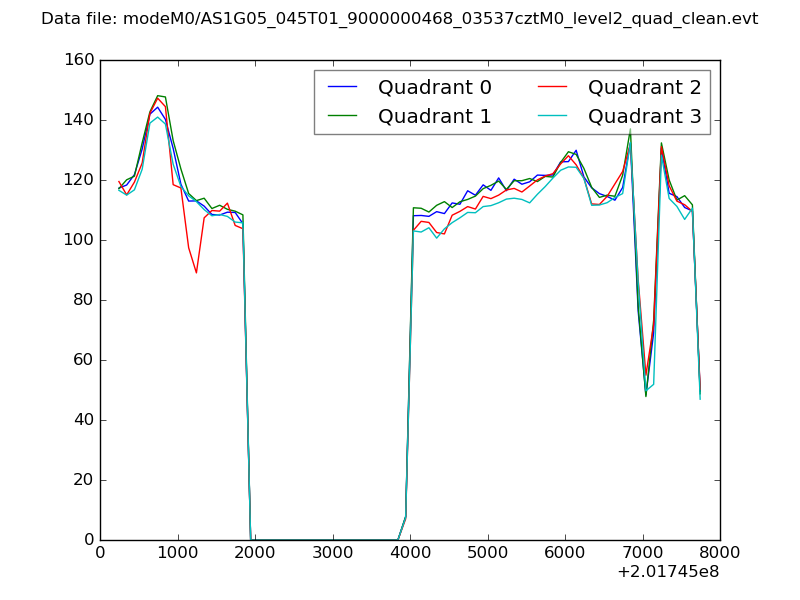
| Quadrant-wise count rates Data is divided into 100 sec bins |
 |
|
| Module-wise count rates for Quadrant A Data is divided into 100 sec bins |
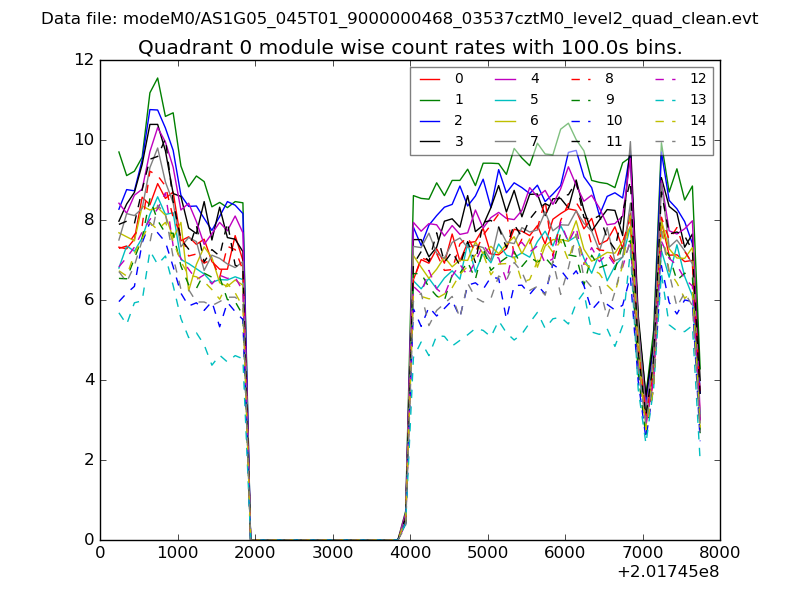 |
 |
| Module-wise count rates for Quadrant B Data is divided into 100 sec bins |
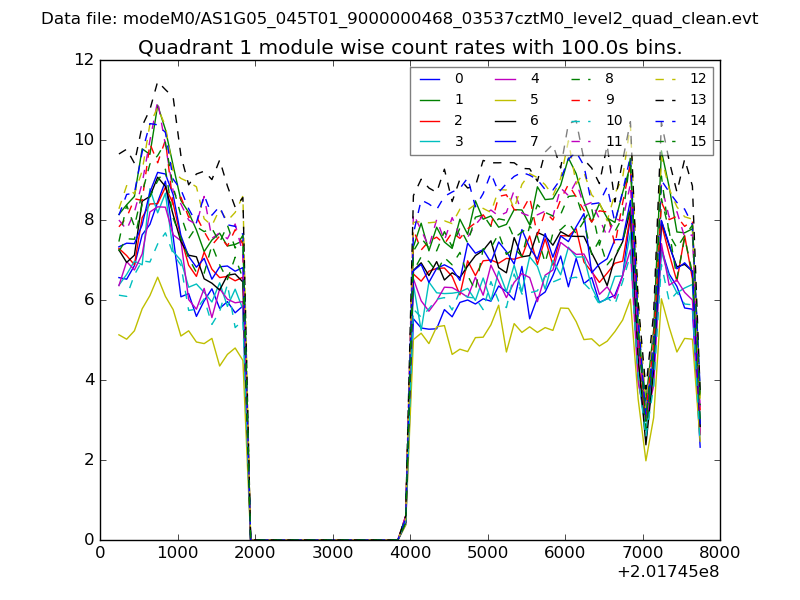 |
 |
| Module-wise count rates for Quadrant C Data is divided into 100 sec bins |
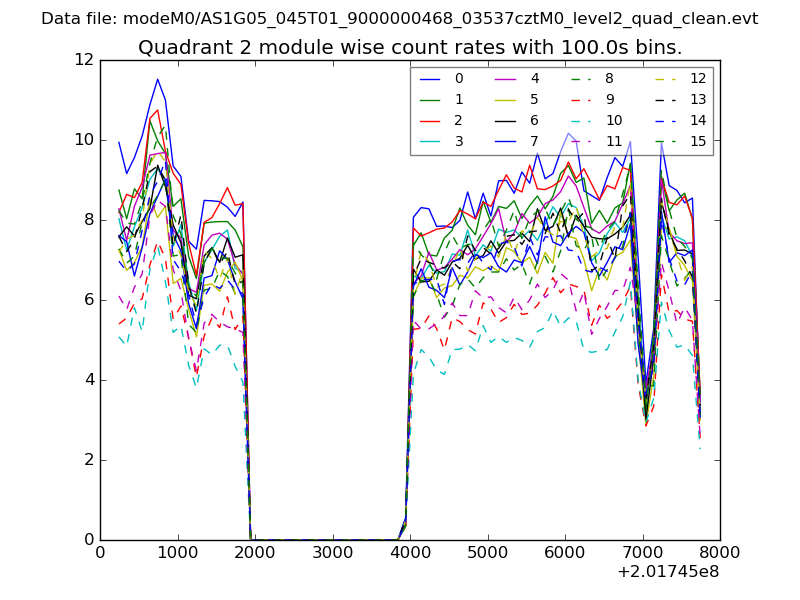 |
 |
| Module-wise count rates for Quadrant D Data is divided into 100 sec bins |
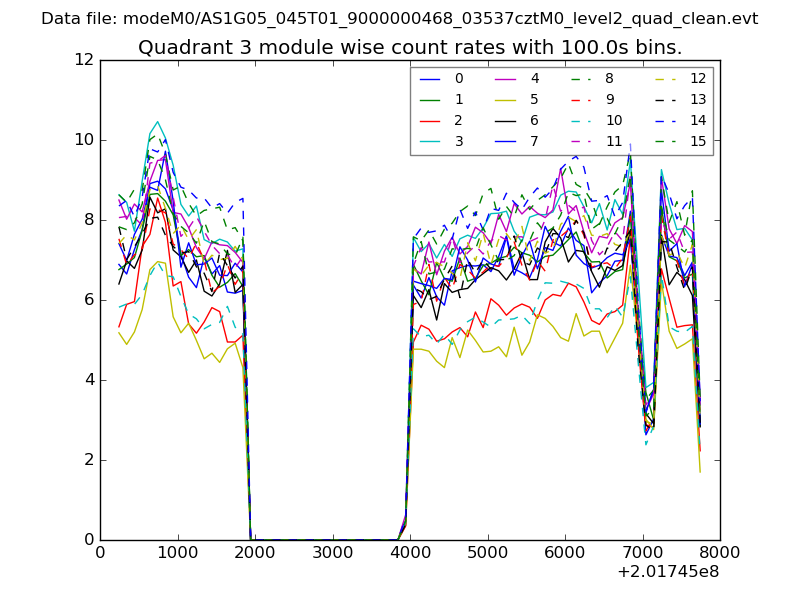 |
 |
| Parameter | Plot |
|---|---|
| CZT HV Monitor | 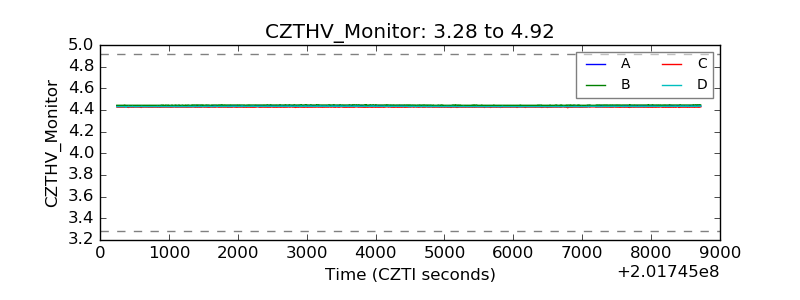 |
| D_VDD | 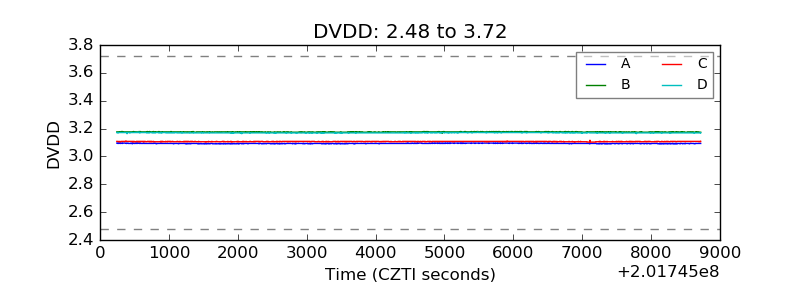 |
| Temperature 1 | 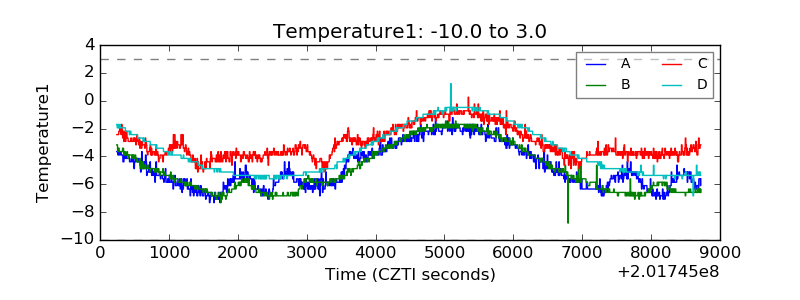 |
| Veto HV Monitor | 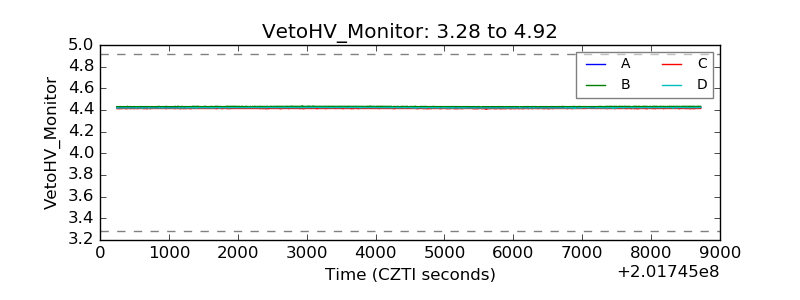 |
| Veto LLD | 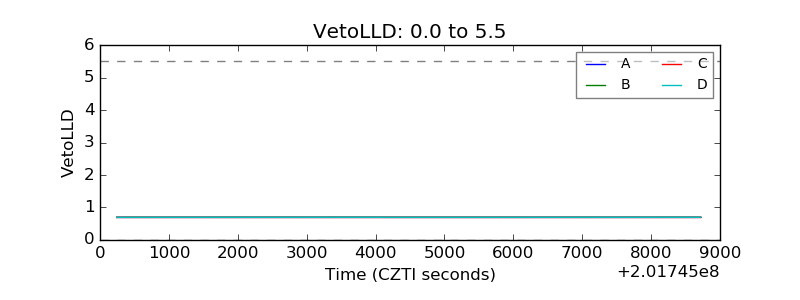 |
| Alpha Counter | 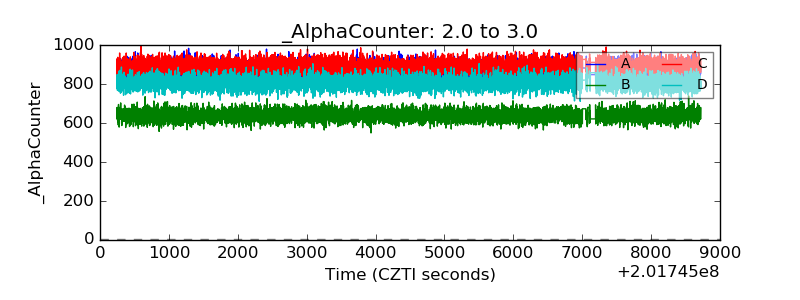 |
| _CPM_Rate | 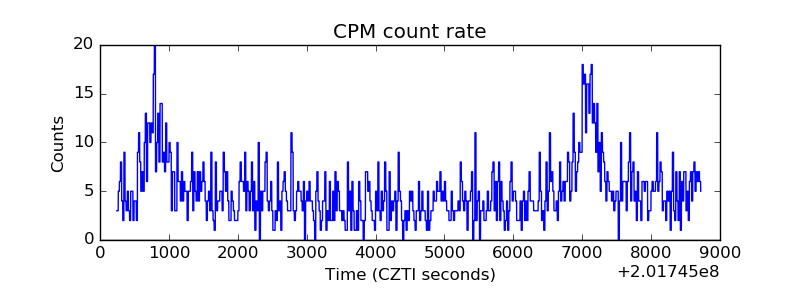 |
| CZT Counter | 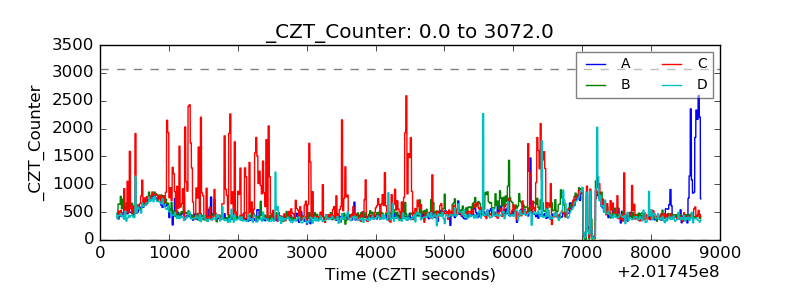 |
| +2.5 Volts monitor |  |
| +5 Volts monitor |  |
| _ROLL_ROT | 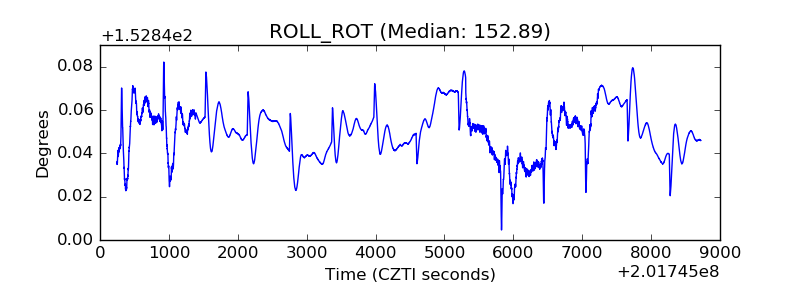 |
| _Roll_DEC | 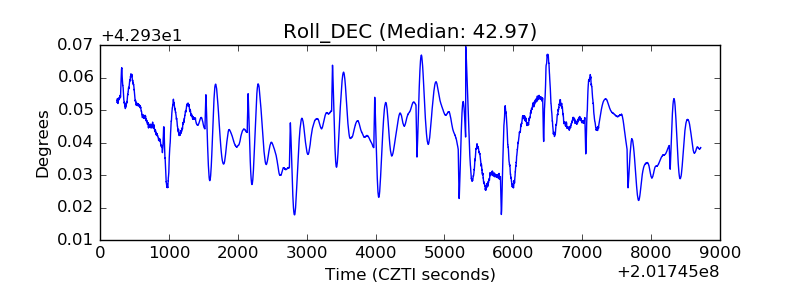 |
| _Roll_RA |  |
| Veto Counter | 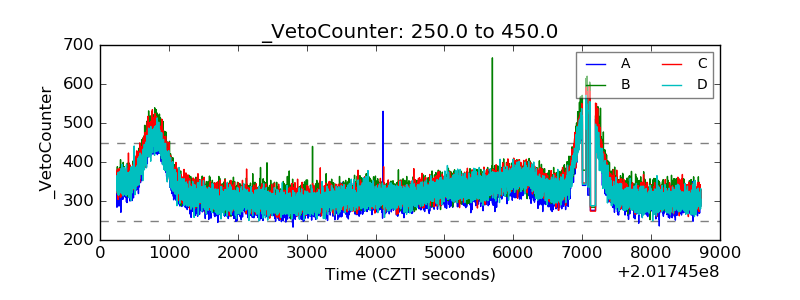 |