| Param | Original file | Final file |
|---|---|---|
| Filename | modeM0/AS1G05_045T01_9000000468_03540cztM0_level2.evt | modeM0/AS1G05_045T01_9000000468_03540cztM0_level2_quad_clean.evt |
| Size (bytes) | 1,005,618,240 | 134,976,960 |
| Size | 959.0 MB | 128.7 MB |
| Events in quadrant A | 6,822,743 | 797,511 |
| Events in quadrant B | 7,627,095 | 790,899 |
| Events in quadrant C | 9,104,432 | 764,739 |
| Events in quadrant D | 5,959,100 | 772,459 |
| Mode M0 | |||
|---|---|---|---|
| Quadrant | BADHDUFLAG | Total packets | Discarded packets |
| A | 0 | 30314 | 3 |
| B | 0 | 31832 | 2 |
| C | 0 | 36552 | 2 |
| D | 0 | 28656 | 2 |
| Mode M9 | |||
|---|---|---|---|
| Quadrant | BADHDUFLAG | Total packets | Discarded packets |
| A | 0 | 10 | 0 |
| B | 0 | 10 | 0 |
| C | 0 | 10 | 0 |
| D | 0 | 10 | 0 |
| Mode SS | |||
|---|---|---|---|
| Quadrant | BADHDUFLAG | Total packets | Discarded packets |
| A | 0 | 282 | 0 |
| B | 0 | 282 | 0 |
| C | 0 | 282 | 0 |
| D | 0 | 282 | 0 |
| Quadrant | Total seconds | Saturated seconds | Saturation percentage |
|---|---|---|---|
| A | 13920 | 361 | 2.593391% |
| B | 13920 | 327 | 2.349138% |
| C | 13920 | 734 | 5.272989% |
| D | 13920 | 158 | 1.135057% |
Noise dominated data is calculated using 1-second bins in cleaned event files. If a bin has >2000 counts, and if more than 50% of those come from <1% of pixels, then it is considered to be noise-dominated and hence unusable.
| Quadrant | # 1 sec bins | Bins with >0 counts | Bins with >2000 counts | High rate bins dominated by noise | Noise dominated (total time) | Noise dominated (detector-on time) | Marked lightcurve |
|---|---|---|---|---|---|---|---|
| A | 14900 | 13921 | 161 | 161 | 1.08% | 1.16% | 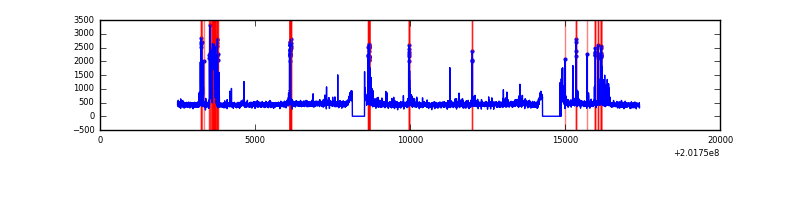 |
| B | 14900 | 13920 | 128 | 128 | 0.86% | 0.92% | 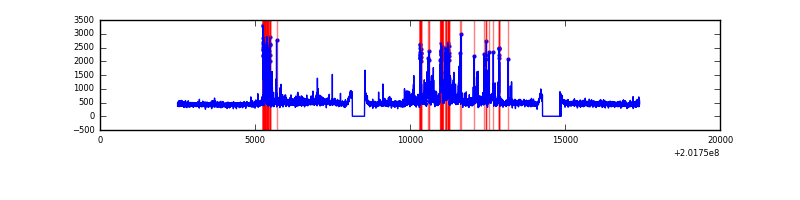 |
| C | 14900 | 13921 | 601 | 601 | 4.03% | 4.32% | 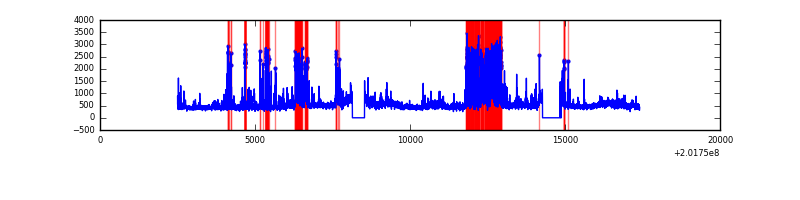 |
| D | 14900 | 13921 | 27 | 27 | 0.18% | 0.19% | 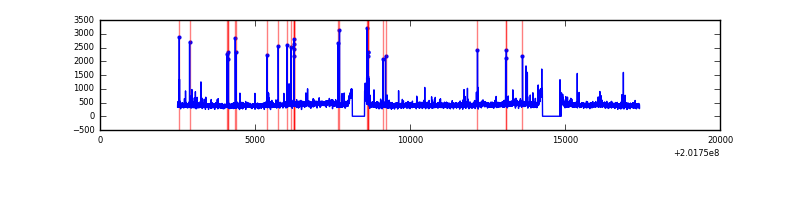 |
Top three noisy pixels from each quadrant. If the there are fewer than three noisy pixels in the level2.evt file, extra rows are filled as -1
| Pixel properties | Quadrant properties | ||||||
|---|---|---|---|---|---|---|---|
| Quadrant | DetID | PixID | Counts | Sigma | Mean | Median | Sigma |
| A | 0 | 50 | 737548 | 2312.63 | 1549 | 1510 | 318.3 |
| A | 3 | 1 | 61031 | 187.01 | 1549 | 1510 | 318.3 |
| A | 8 | 15 | 19138 | 55.39 | 1549 | 1510 | 318.3 |
| B | 14 | 167 | 1075604 | 3543.03 | 1571 | 1531 | 303.2 |
| B | 15 | 204 | 303078 | 994.71 | 1571 | 1531 | 303.2 |
| B | 0 | 228 | 38752 | 122.78 | 1571 | 1531 | 303.2 |
| C | 4 | 248 | 2561706 | 7379.76 | 1493 | 1498 | 346.9 |
| C | 1 | 192 | 477721 | 1372.7 | 1493 | 1498 | 346.9 |
| C | 15 | 208 | 168815 | 482.29 | 1493 | 1498 | 346.9 |
| D | 13 | 223 | 83341 | 225.13 | 1508 | 1459 | 363.7 |
| D | 5 | 233 | 36115 | 95.28 | 1508 | 1459 | 363.7 |
| D | 13 | 239 | 29120 | 76.05 | 1508 | 1459 | 363.7 |
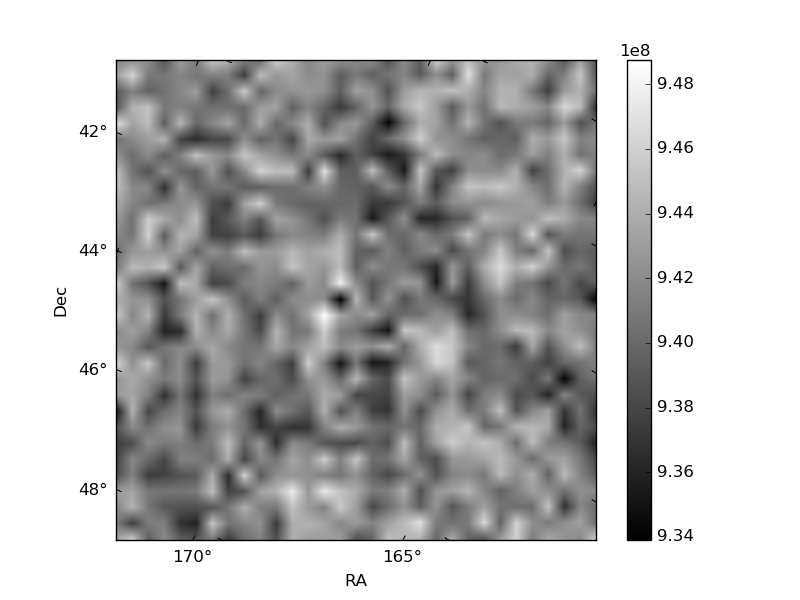
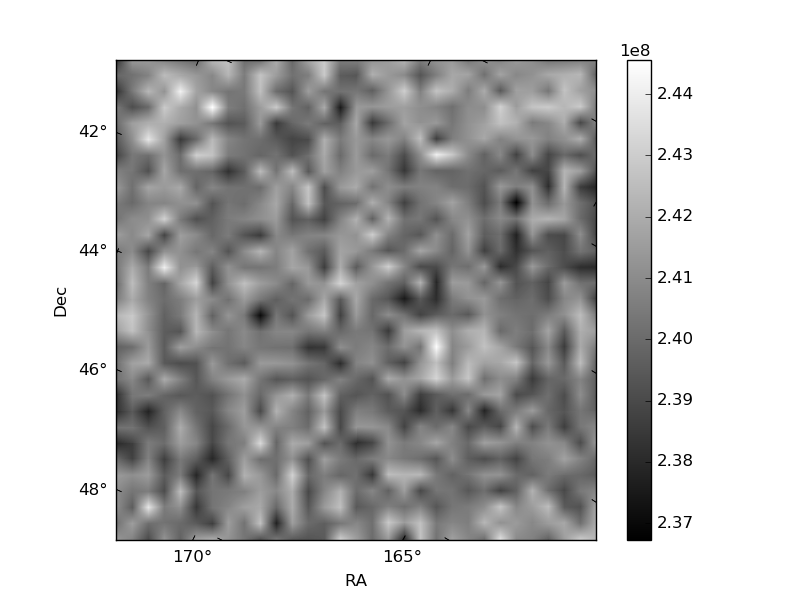
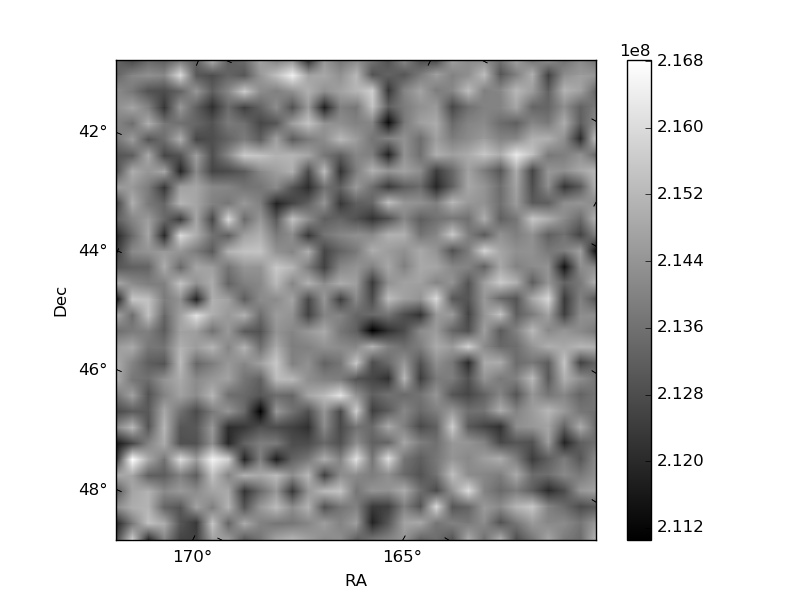
Histogram calculated using DETX and DETY for each event in the final _common_clean file
| Quadrant A | 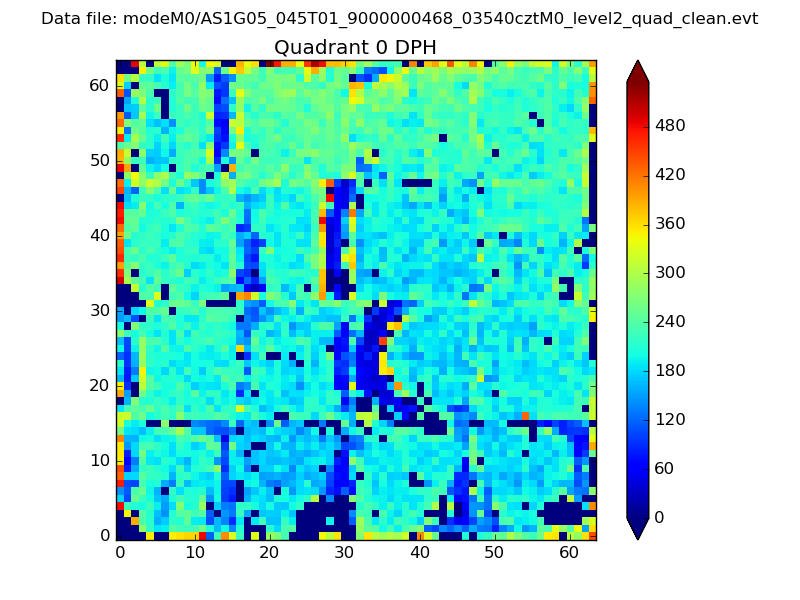 |
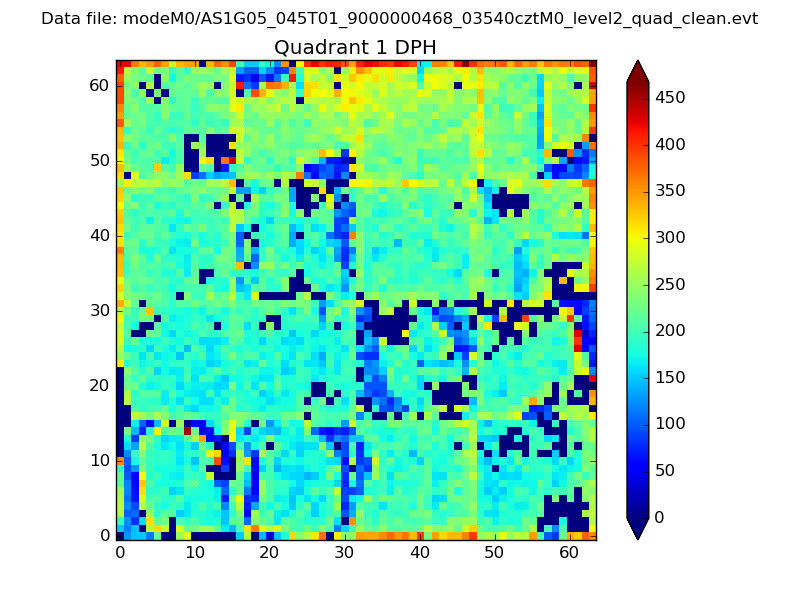 |
Quadrant B |
|---|---|---|---|
| Quadrant D |  |
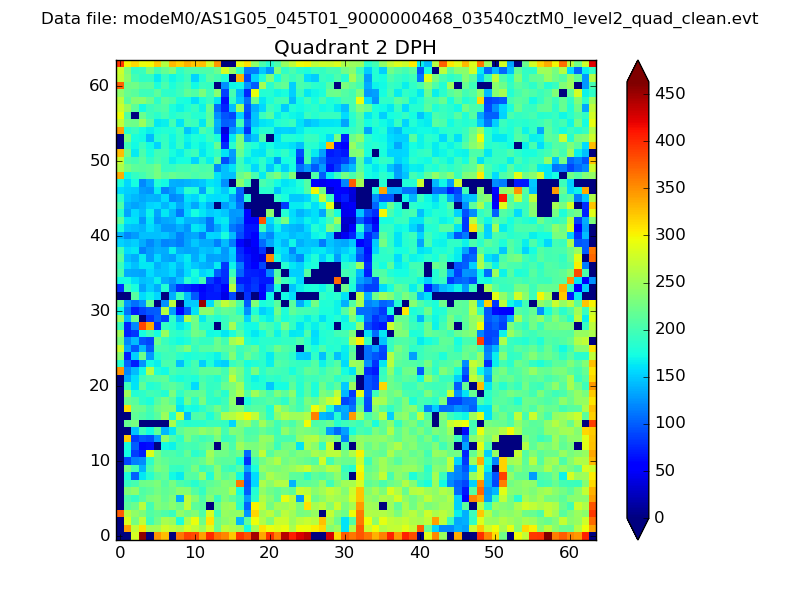 |
Quadrant C |
| Plot type | Count rate plots | Images |
|---|---|---|
| Comparison with Poisson distribution Blue bars denote a histogram of data divided into 1 sec bins. Red curve is a Poisson curve with rate = median count rate of data. |
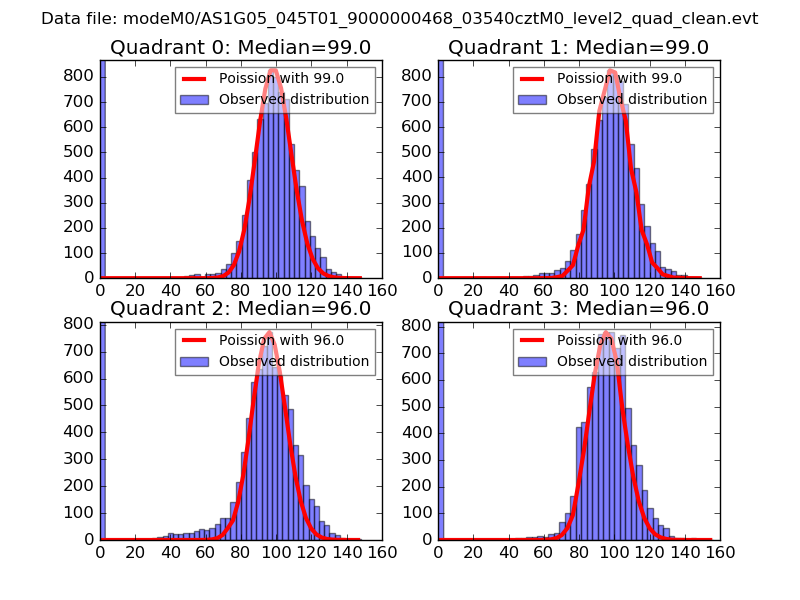 |
 |
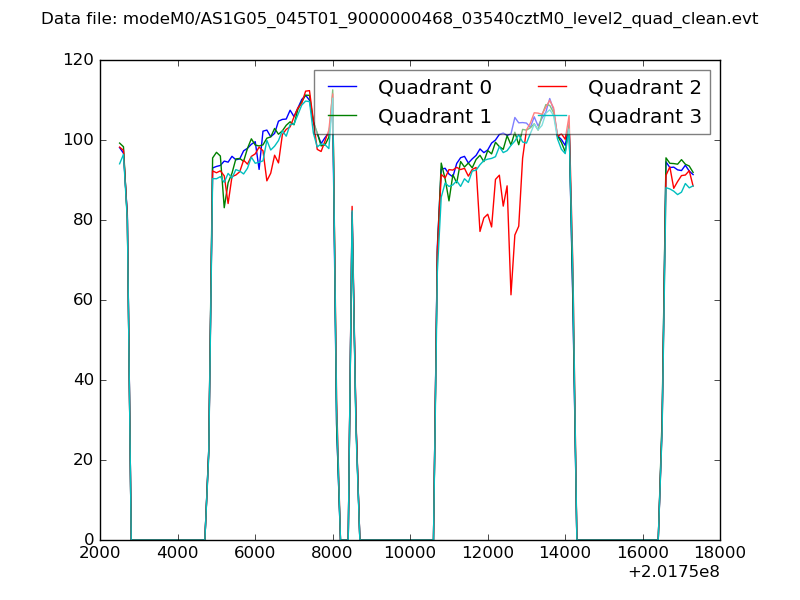
| Quadrant-wise count rates Data is divided into 100 sec bins |
 |
|
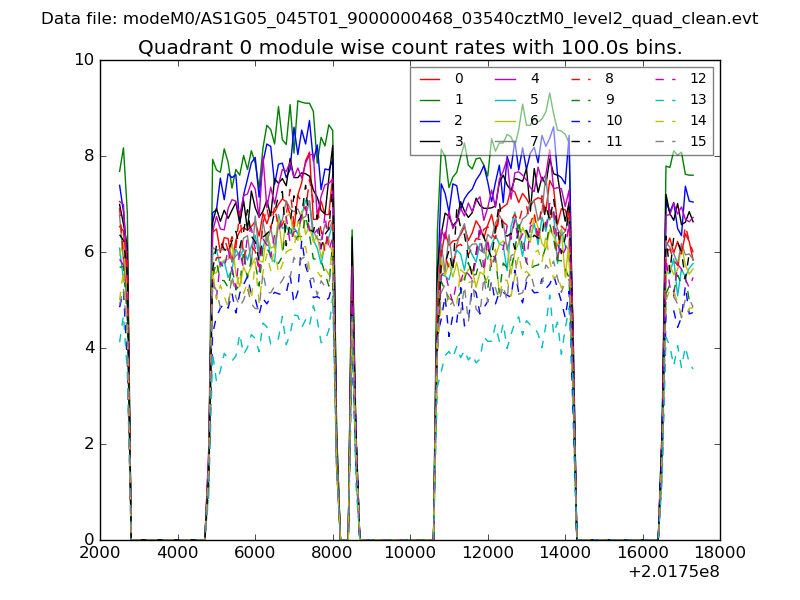
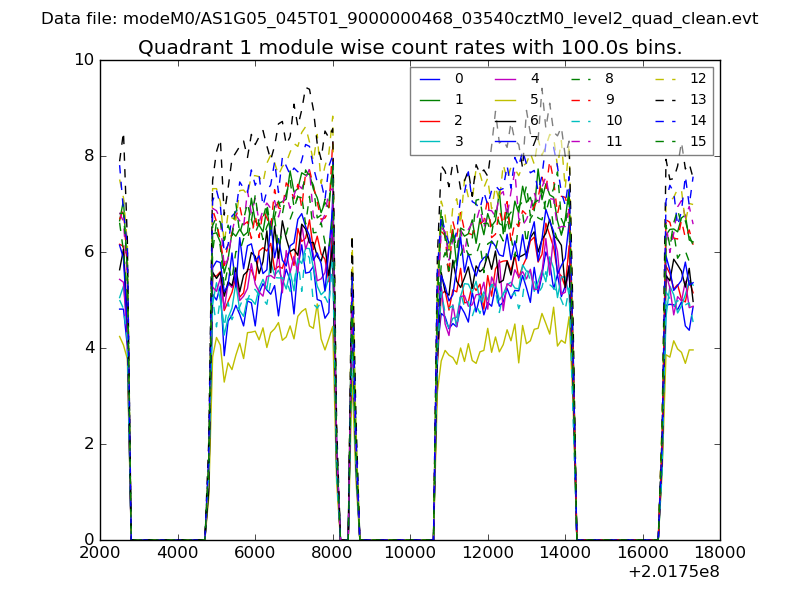
| Module-wise count rates for Quadrant A Data is divided into 100 sec bins |
 |
 |
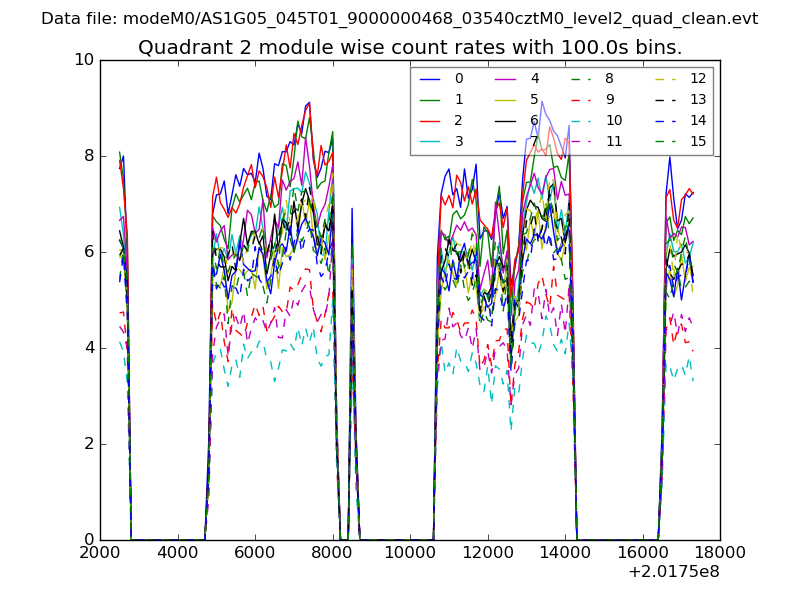
| Module-wise count rates for Quadrant B Data is divided into 100 sec bins |
 |
 |
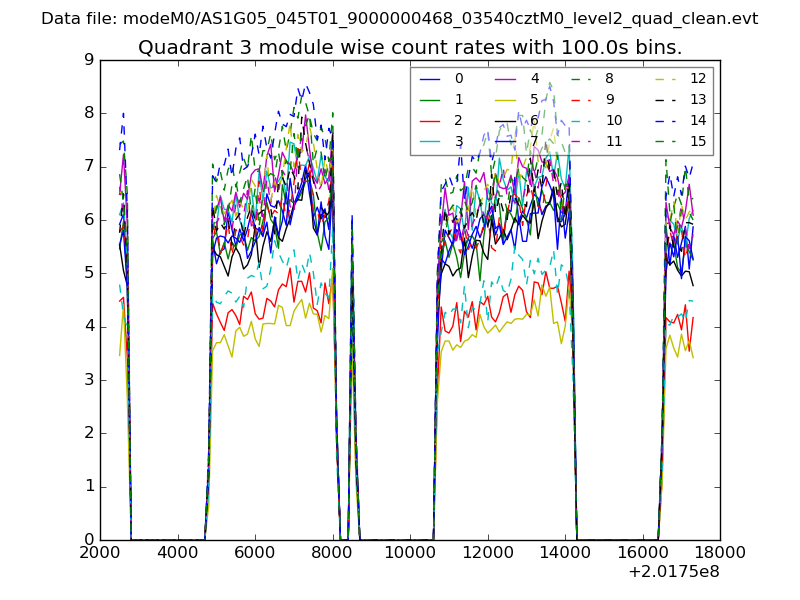
| Module-wise count rates for Quadrant C Data is divided into 100 sec bins |
 |
 |
| Module-wise count rates for Quadrant D Data is divided into 100 sec bins |
 |
 |
| Parameter | Plot |
|---|---|
| CZT HV Monitor | 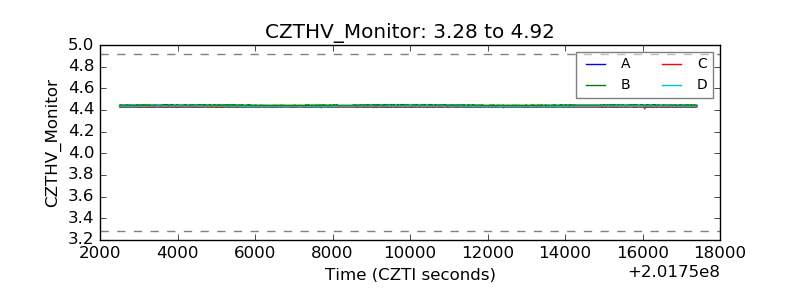 |
| D_VDD | 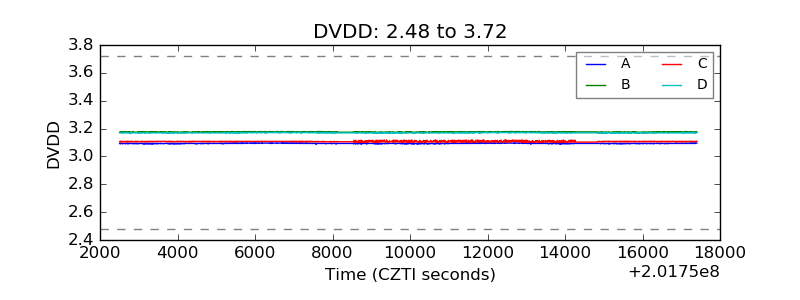 |
| Temperature 1 | 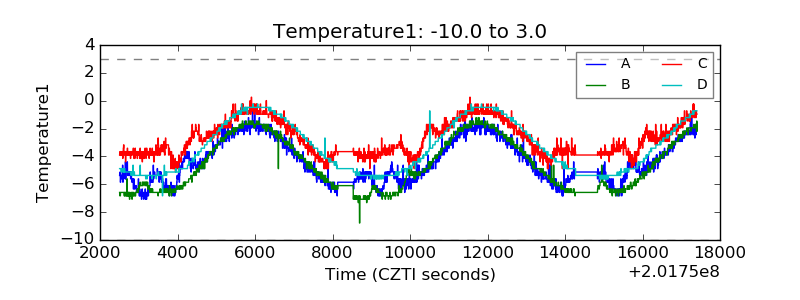 |
| Veto HV Monitor | 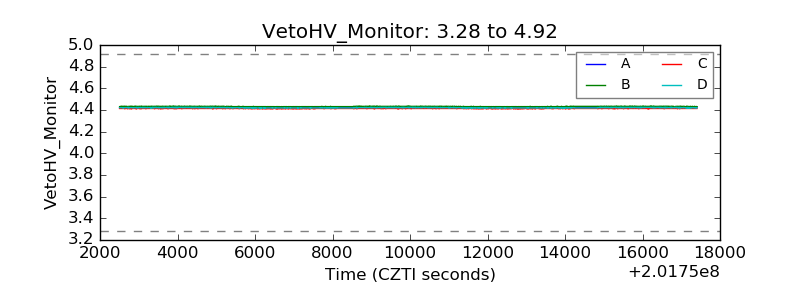 |
| Veto LLD | 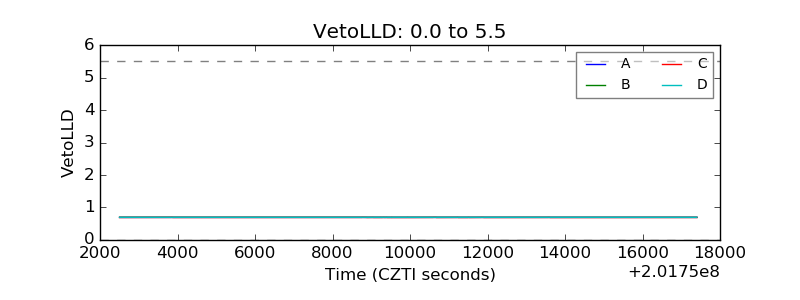 |
| Alpha Counter | 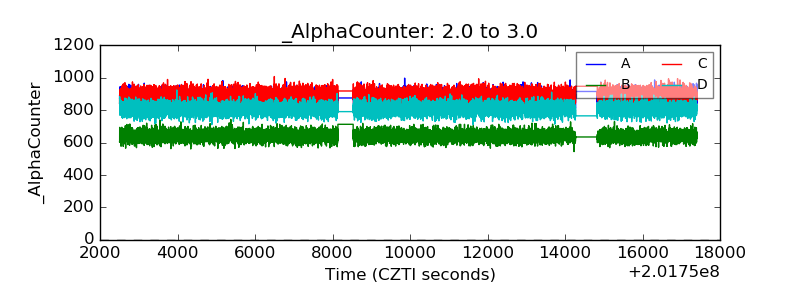 |
| _CPM_Rate | 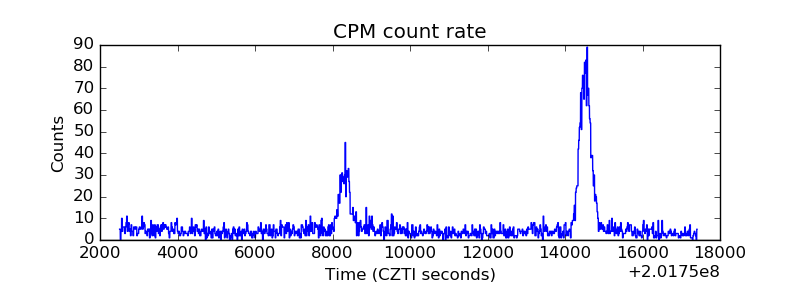 |
| CZT Counter | 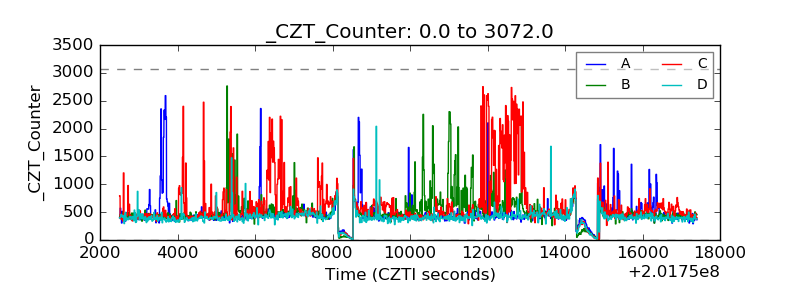 |
| +2.5 Volts monitor | 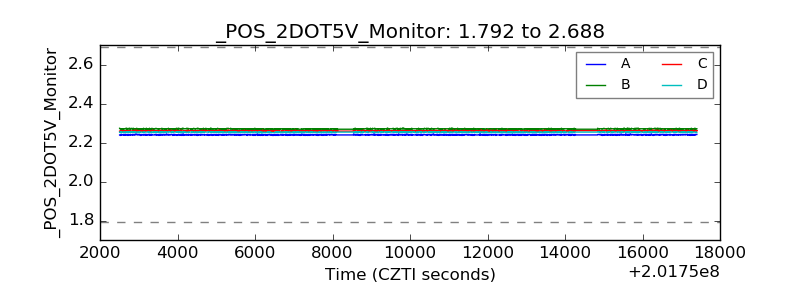 |
| +5 Volts monitor |  |
| _ROLL_ROT | 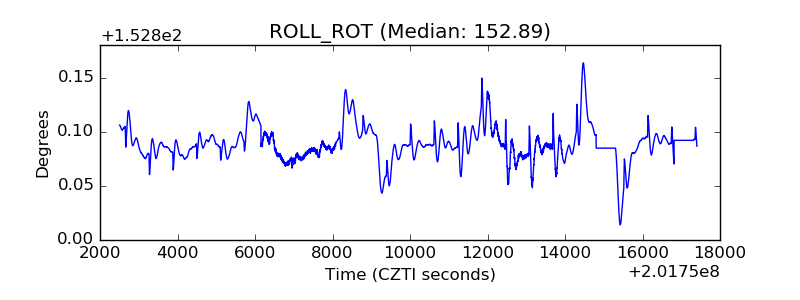 |
| _Roll_DEC | 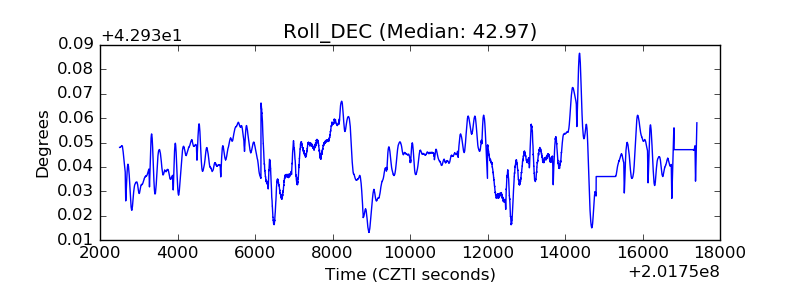 |
| _Roll_RA | 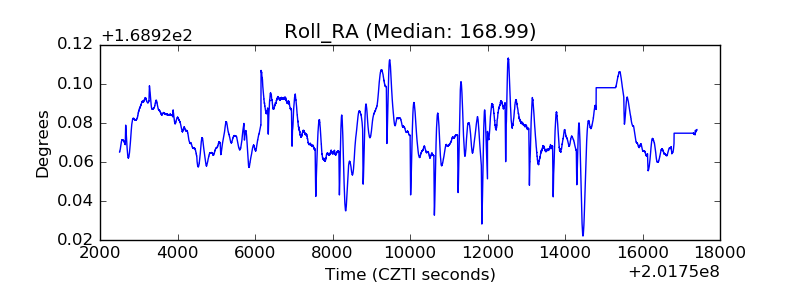 |
| Veto Counter | 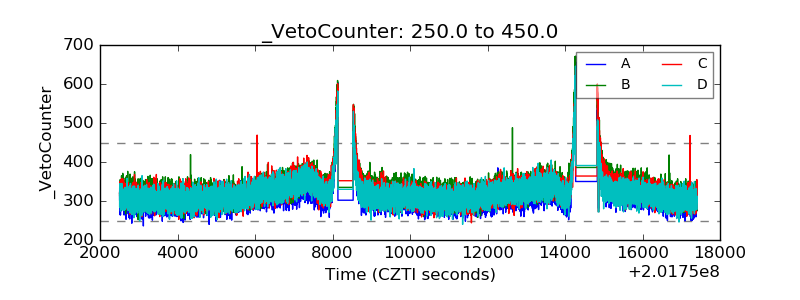 |