| Param | Original file | Final file |
|---|---|---|
| Filename | modeM0/AS1G05_045T01_9000000468_03541cztM0_level2.evt | modeM0/AS1G05_045T01_9000000468_03541cztM0_level2_quad_clean.evt |
| Size (bytes) | 709,113,600 | 120,885,120 |
| Size | 676.3 MB | 115.3 MB |
| Events in quadrant A | 4,655,891 | 753,233 |
| Events in quadrant B | 5,259,203 | 750,070 |
| Events in quadrant C | 6,549,079 | 733,629 |
| Events in quadrant D | 4,329,622 | 726,855 |
| Mode M0 | |||
|---|---|---|---|
| Quadrant | BADHDUFLAG | Total packets | Discarded packets |
| A | 0 | 20937 | 3 |
| B | 0 | 21763 | 2 |
| C | 0 | 26059 | 2 |
| D | 0 | 20643 | 2 |
| Mode M9 | |||
|---|---|---|---|
| Quadrant | BADHDUFLAG | Total packets | Discarded packets |
| A | 0 | 16 | 0 |
| B | 0 | 16 | 0 |
| C | 0 | 16 | 0 |
| D | 0 | 16 | 0 |
| Mode SS | |||
|---|---|---|---|
| Quadrant | BADHDUFLAG | Total packets | Discarded packets |
| A | 0 | 206 | 0 |
| B | 0 | 206 | 0 |
| C | 0 | 206 | 0 |
| D | 0 | 206 | 0 |
| Quadrant | Total seconds | Saturated seconds | Saturation percentage |
|---|---|---|---|
| A | 10058 | 167 | 1.660370% |
| B | 10058 | 173 | 1.720024% |
| C | 10058 | 350 | 3.479817% |
| D | 10058 | 133 | 1.322330% |
Noise dominated data is calculated using 1-second bins in cleaned event files. If a bin has >2000 counts, and if more than 50% of those come from <1% of pixels, then it is considered to be noise-dominated and hence unusable.
| Quadrant | # 1 sec bins | Bins with >0 counts | Bins with >2000 counts | High rate bins dominated by noise | Noise dominated (total time) | Noise dominated (detector-on time) | Marked lightcurve |
|---|---|---|---|---|---|---|---|
| A | 11753 | 10058 | 10 | 10 | 0.09% | 0.10% | 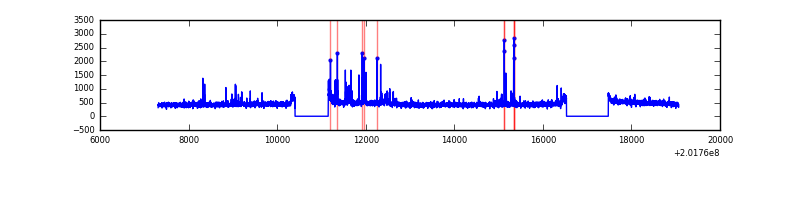 |
| B | 11753 | 10058 | 25 | 25 | 0.21% | 0.25% |  |
| C | 11753 | 10058 | 189 | 189 | 1.61% | 1.88% | 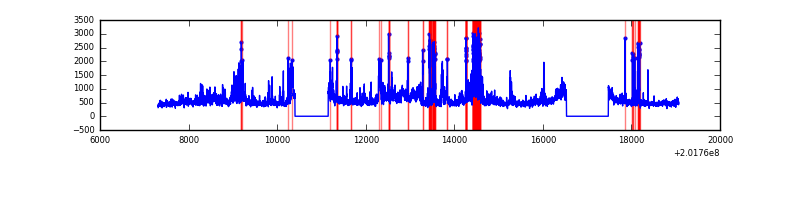 |
| D | 11753 | 10058 | 15 | 15 | 0.13% | 0.15% | 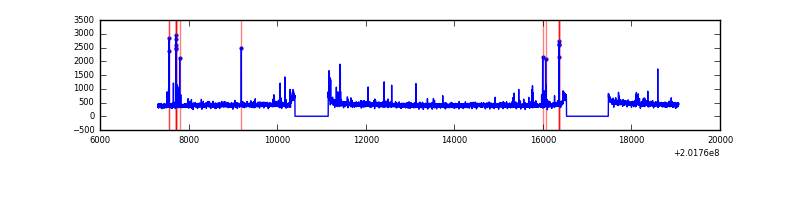 |
Top three noisy pixels from each quadrant. If the there are fewer than three noisy pixels in the level2.evt file, extra rows are filled as -1
| Pixel properties | Quadrant properties | ||||||
|---|---|---|---|---|---|---|---|
| Quadrant | DetID | PixID | Counts | Sigma | Mean | Median | Sigma |
| A | 0 | 50 | 164025 | 688.84 | 1142 | 1113 | 236.5 |
| A | 0 | 118 | 34893 | 142.83 | 1142 | 1113 | 236.5 |
| A | 3 | 1 | 19183 | 76.4 | 1142 | 1113 | 236.5 |
| B | 15 | 204 | 357154 | 1594.55 | 1154 | 1124 | 223.3 |
| B | 0 | 182 | 153369 | 681.86 | 1154 | 1124 | 223.3 |
| B | 14 | 167 | 86956 | 384.41 | 1154 | 1124 | 223.3 |
| C | 1 | 192 | 1105749 | 4261.5 | 1105 | 1109 | 259.2 |
| C | 4 | 248 | 935069 | 3603.05 | 1105 | 1109 | 259.2 |
| C | 15 | 208 | 157262 | 602.41 | 1105 | 1109 | 259.2 |
| D | 13 | 223 | 56076 | 202.8 | 1114 | 1078 | 271.2 |
| D | 2 | 206 | 29057 | 103.17 | 1114 | 1078 | 271.2 |
| D | 5 | 233 | 18564 | 64.48 | 1114 | 1078 | 271.2 |
Histogram calculated using DETX and DETY for each event in the final _common_clean file
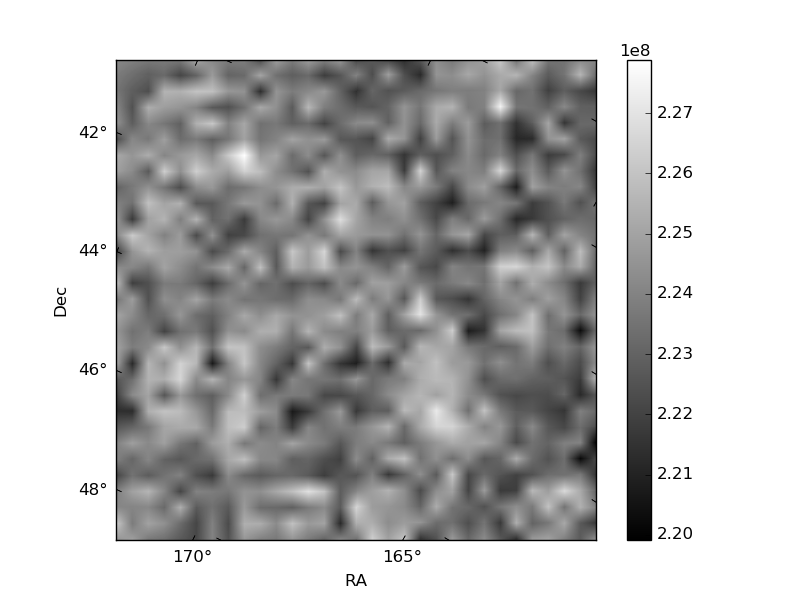
| Quadrant A |  |
 |
Quadrant B |
|---|---|---|---|
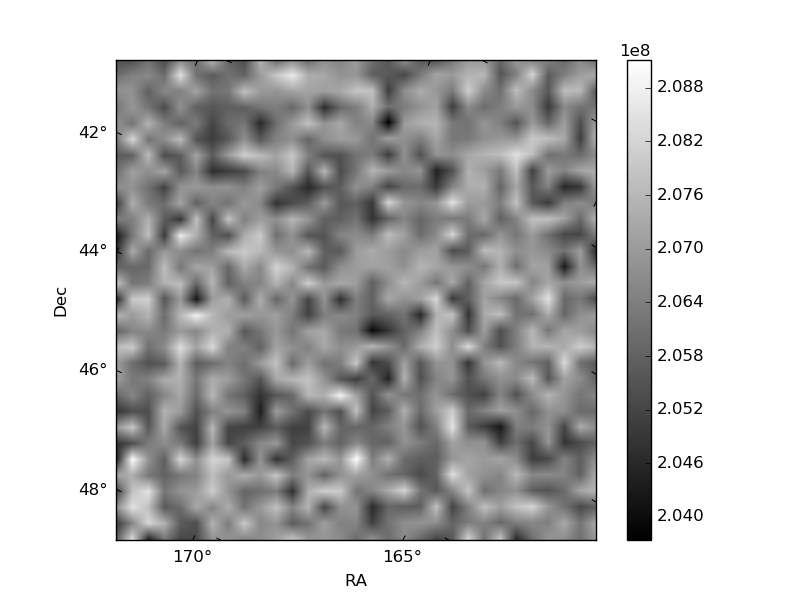
| Quadrant D | 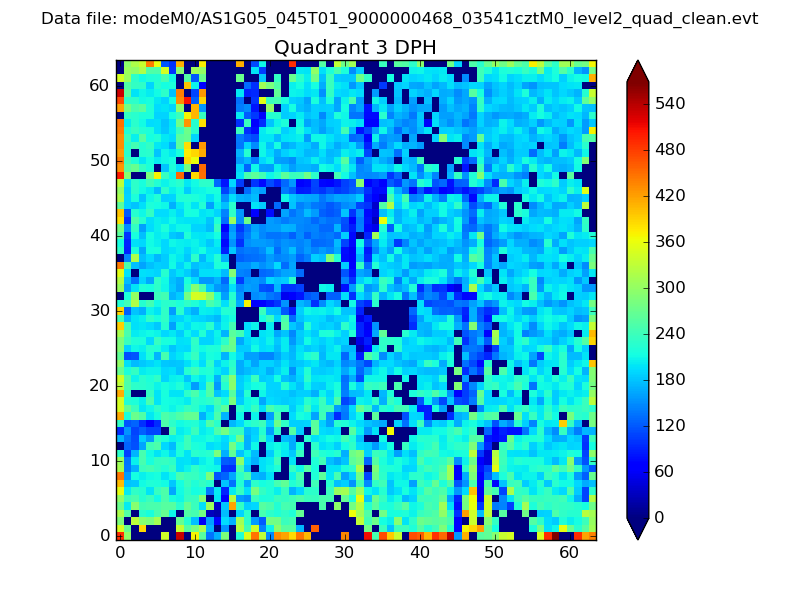 |
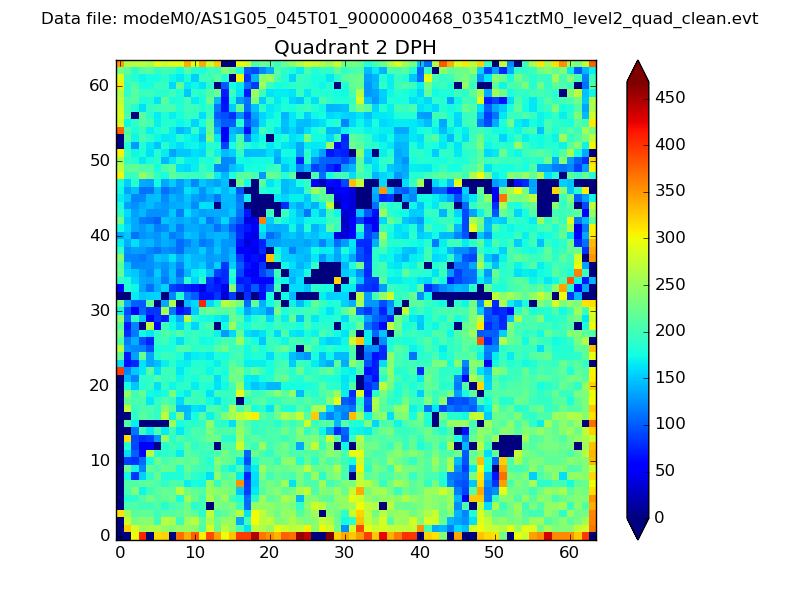 |
Quadrant C |
| Plot type | Count rate plots | Images |
|---|---|---|
| Comparison with Poisson distribution Blue bars denote a histogram of data divided into 1 sec bins. Red curve is a Poisson curve with rate = median count rate of data. |
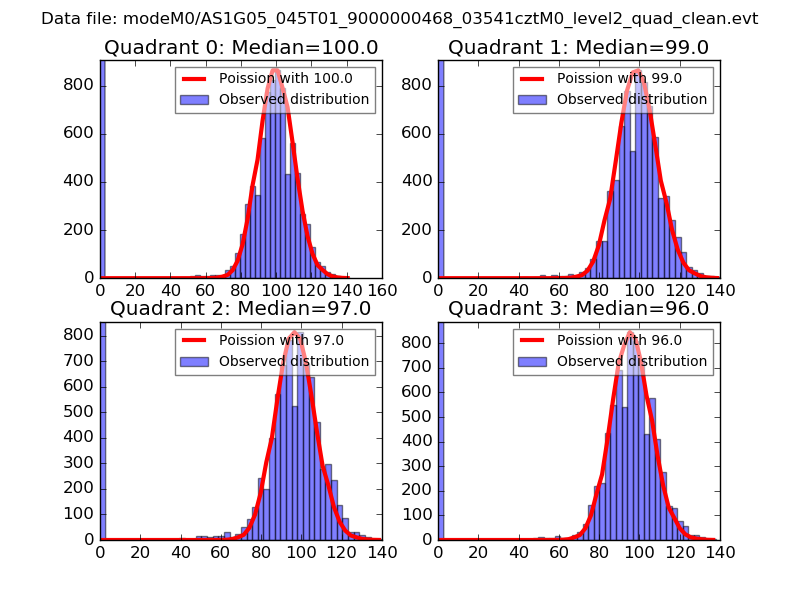 |
 |
| Quadrant-wise count rates Data is divided into 100 sec bins |
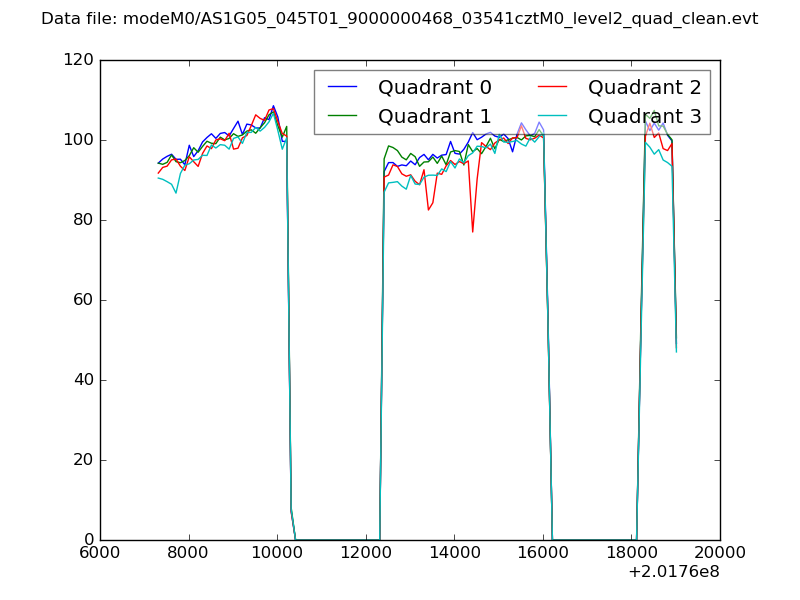 |
|
| Module-wise count rates for Quadrant A Data is divided into 100 sec bins |
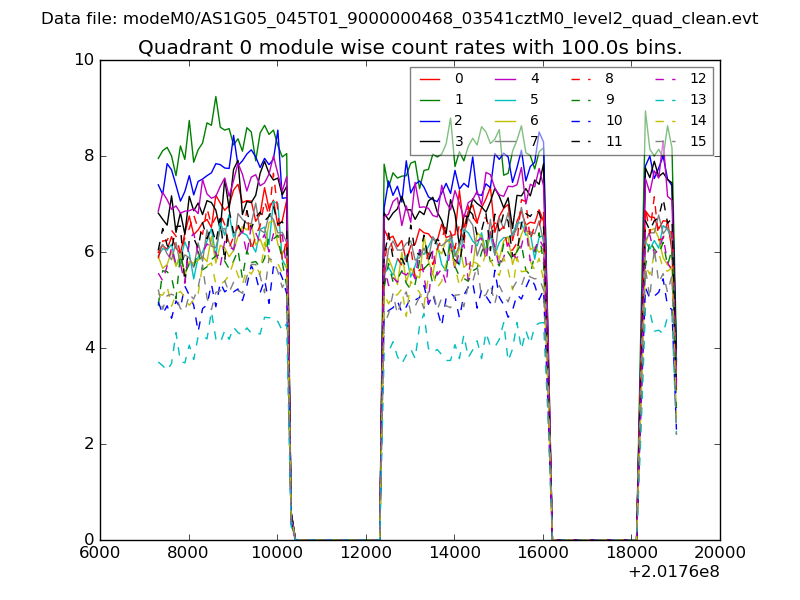 |
 |
| Module-wise count rates for Quadrant B Data is divided into 100 sec bins |
 |
 |
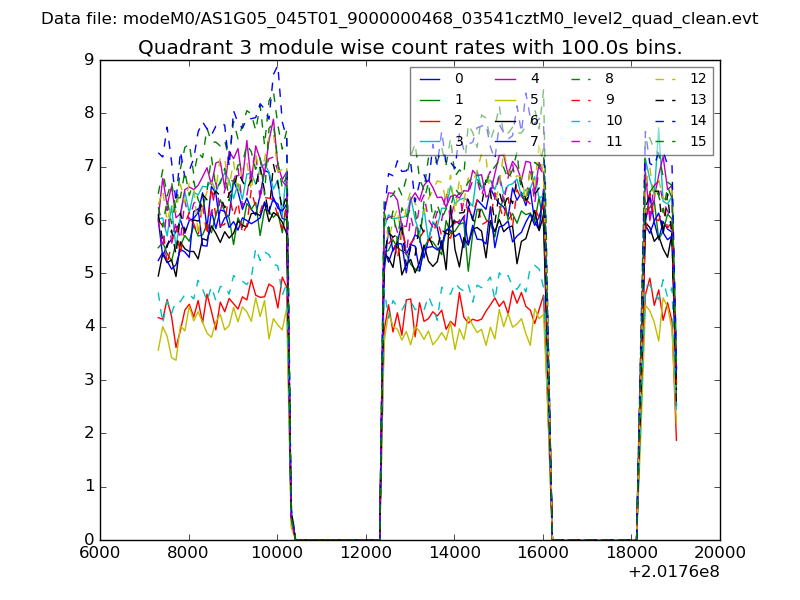
| Module-wise count rates for Quadrant C Data is divided into 100 sec bins |
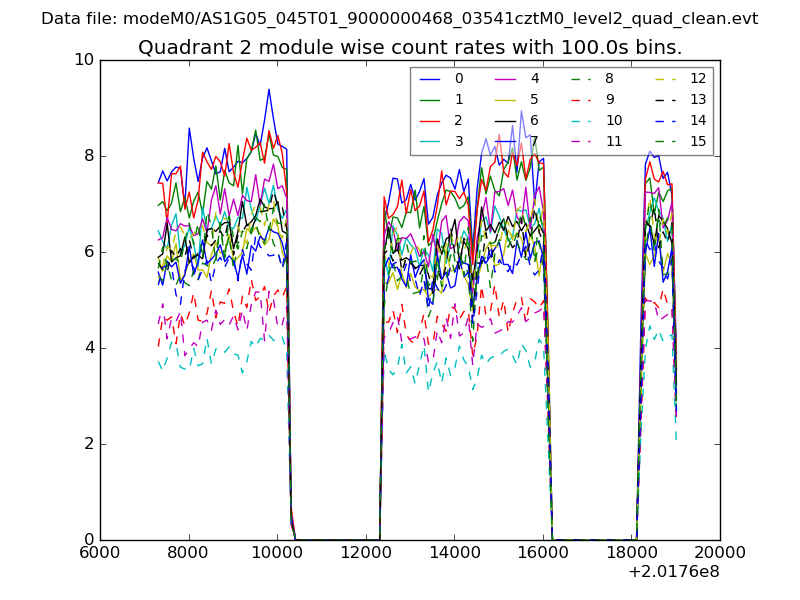 |
 |
| Module-wise count rates for Quadrant D Data is divided into 100 sec bins |
 |
 |
| Parameter | Plot |
|---|---|
| CZT HV Monitor | 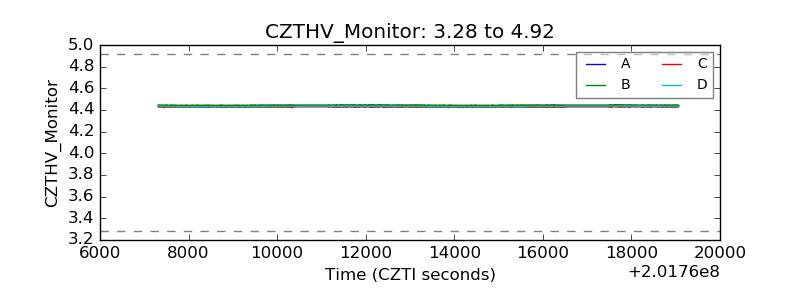 |
| D_VDD | 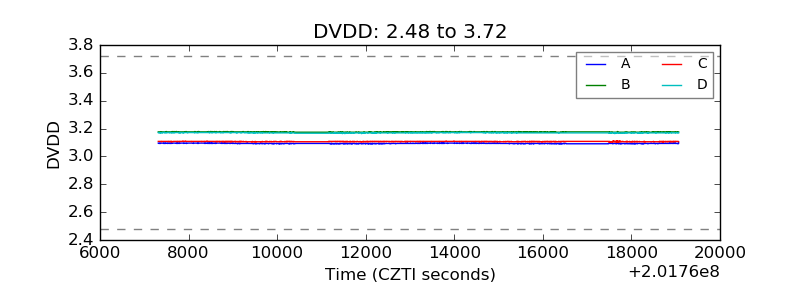 |
| Temperature 1 | 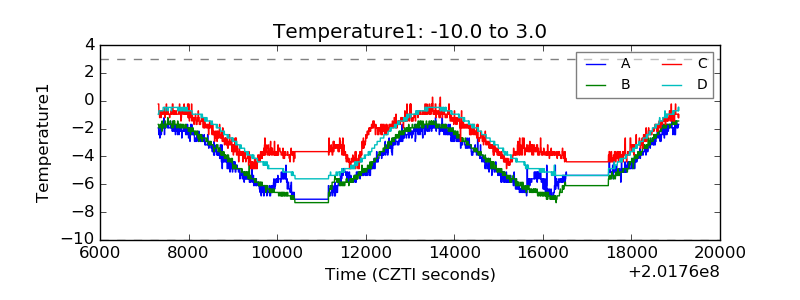 |
| Veto HV Monitor | 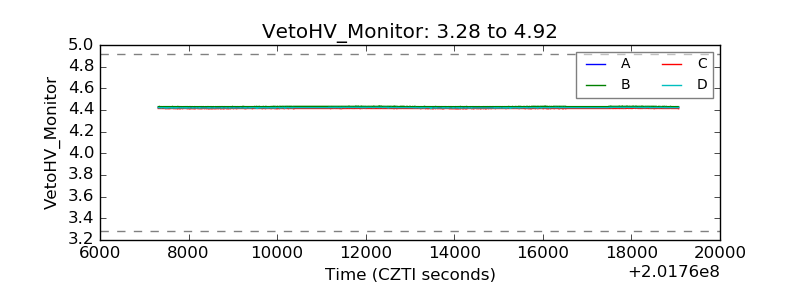 |
| Veto LLD | 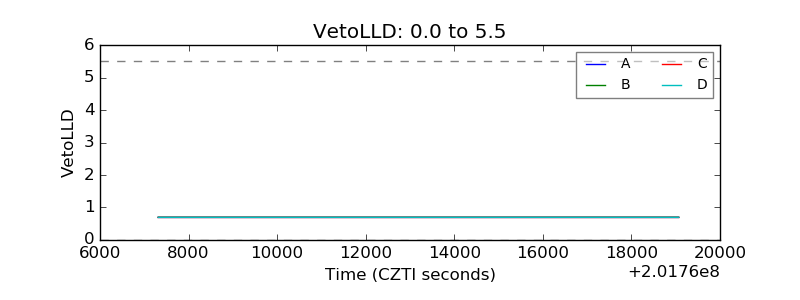 |
| Alpha Counter | 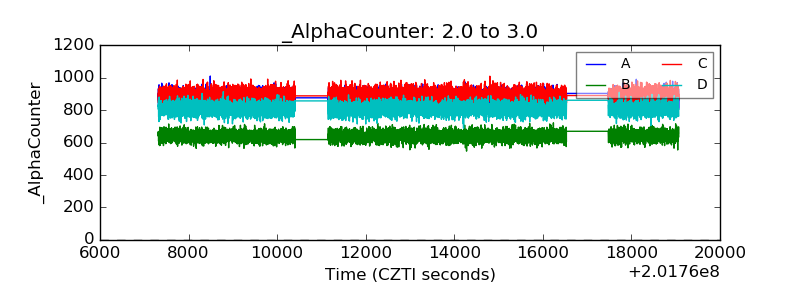 |
| _CPM_Rate | 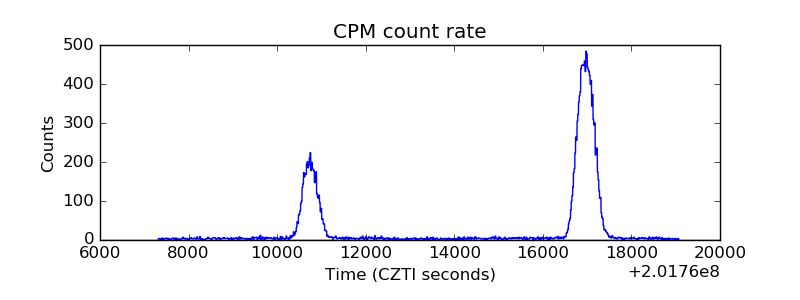 |
| CZT Counter |  |
| +2.5 Volts monitor |  |
| +5 Volts monitor | 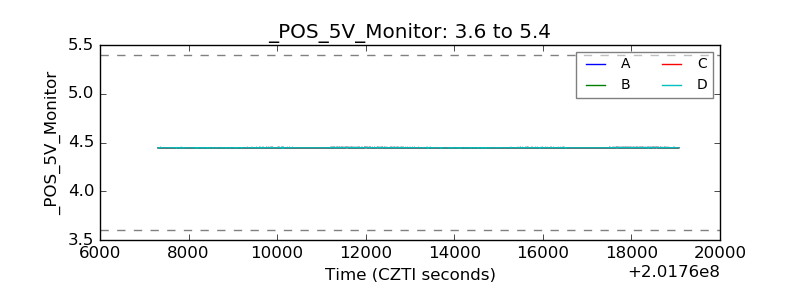 |
| _ROLL_ROT | 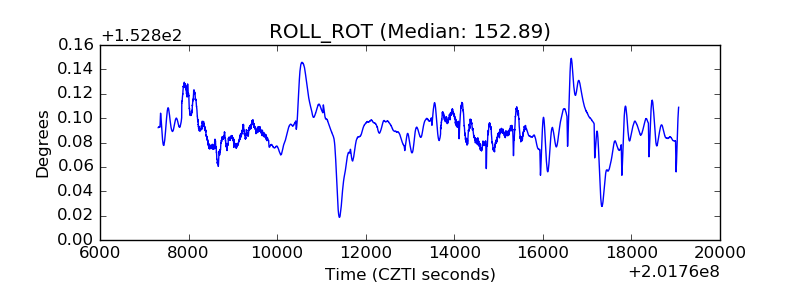 |
| _Roll_DEC | 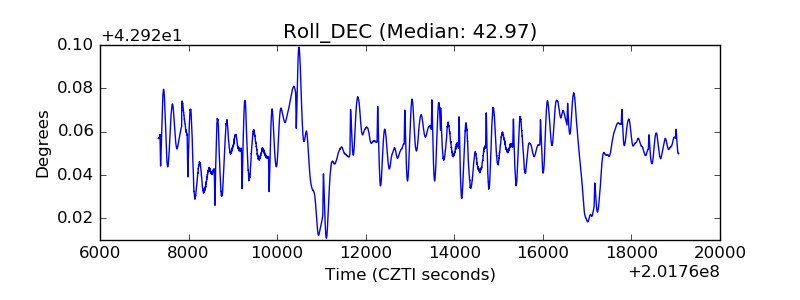 |
| _Roll_RA | 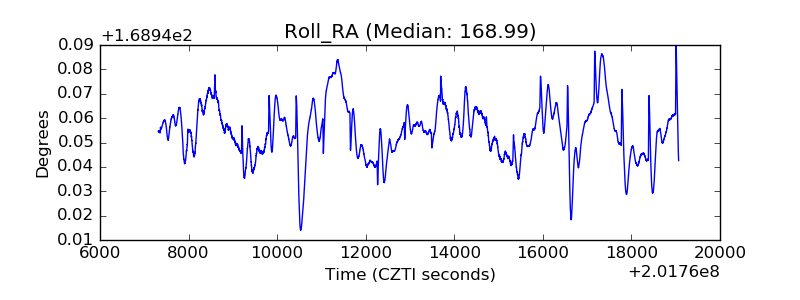 |
| Veto Counter | 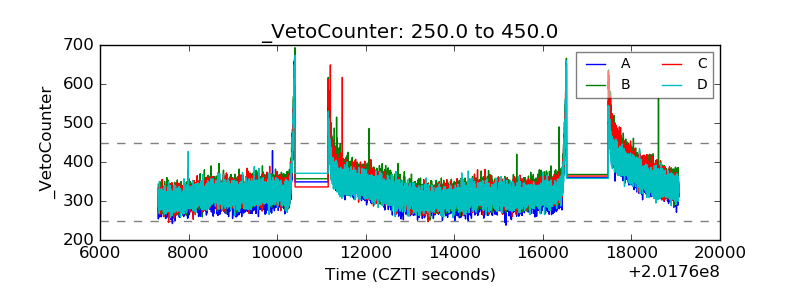 |