| Param | Original file | Final file |
|---|---|---|
| Filename | modeM0/AS1G05_045T01_9000000468_03544cztM0_level2.evt | modeM0/AS1G05_045T01_9000000468_03544cztM0_level2_quad_clean.evt |
| Size (bytes) | 432,420,480 | 102,012,480 |
| Size | 412.4 MB | 97.3 MB |
| Events in quadrant A | 3,068,041 | 672,052 |
| Events in quadrant B | 3,461,695 | 675,587 |
| Events in quadrant C | 3,241,539 | 658,321 |
| Events in quadrant D | 2,896,024 | 643,671 |
| Mode M0 | |||
|---|---|---|---|
| Quadrant | BADHDUFLAG | Total packets | Discarded packets |
| A | 0 | 13394 | 2 |
| B | 0 | 14410 | 1 |
| C | 0 | 13865 | 1 |
| D | 0 | 13166 | 1 |
| Mode M9 | |||
|---|---|---|---|
| Quadrant | BADHDUFLAG | Total packets | Discarded packets |
| A | 0 | 11 | 0 |
| B | 0 | 11 | 0 |
| C | 0 | 11 | 0 |
| D | 0 | 11 | 0 |
| Mode SS | |||
|---|---|---|---|
| Quadrant | BADHDUFLAG | Total packets | Discarded packets |
| A | 0 | 130 | 0 |
| B | 0 | 130 | 0 |
| C | 0 | 130 | 0 |
| D | 0 | 130 | 0 |
| Quadrant | Total seconds | Saturated seconds | Saturation percentage |
|---|---|---|---|
| A | 6296 | 94 | 1.493011% |
| B | 6296 | 78 | 1.238882% |
| C | 6296 | 128 | 2.033037% |
| D | 6296 | 78 | 1.238882% |
Noise dominated data is calculated using 1-second bins in cleaned event files. If a bin has >2000 counts, and if more than 50% of those come from <1% of pixels, then it is considered to be noise-dominated and hence unusable.
| Quadrant | # 1 sec bins | Bins with >0 counts | Bins with >2000 counts | High rate bins dominated by noise | Noise dominated (total time) | Noise dominated (detector-on time) | Marked lightcurve |
|---|---|---|---|---|---|---|---|
| A | 7461 | 6296 | 17 | 17 | 0.23% | 0.27% | 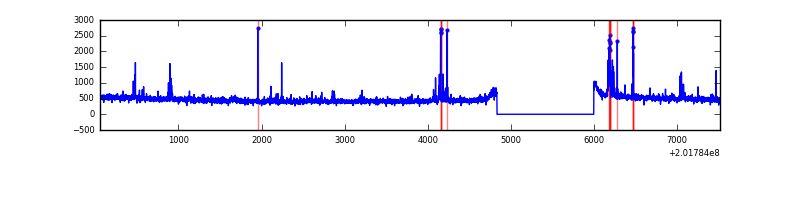 |
| B | 7461 | 6296 | 7 | 7 | 0.09% | 0.11% | 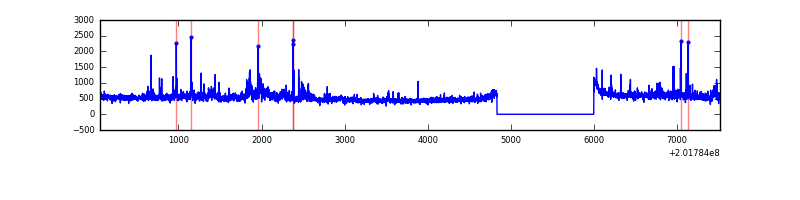 |
| C | 7461 | 6296 | 57 | 57 | 0.76% | 0.91% |  |
| D | 7461 | 6296 | 21 | 21 | 0.28% | 0.33% | 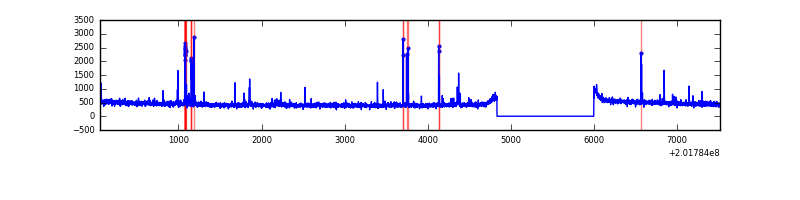 |
Top three noisy pixels from each quadrant. If the there are fewer than three noisy pixels in the level2.evt file, extra rows are filled as -1
| Pixel properties | Quadrant properties | ||||||
|---|---|---|---|---|---|---|---|
| Quadrant | DetID | PixID | Counts | Sigma | Mean | Median | Sigma |
| A | 0 | 50 | 85083 | 557.18 | 748 | 734 | 151.4 |
| A | 3 | 1 | 36953 | 239.25 | 748 | 734 | 151.4 |
| A | 0 | 118 | 34094 | 220.37 | 748 | 734 | 151.4 |
| B | 15 | 204 | 218916 | 1514.07 | 753 | 736 | 144.1 |
| B | 14 | 167 | 134305 | 926.91 | 753 | 736 | 144.1 |
| B | 0 | 228 | 31830 | 215.78 | 753 | 736 | 144.1 |
| C | 1 | 192 | 403409 | 2420.68 | 722 | 725 | 166.4 |
| C | 4 | 248 | 12431 | 70.37 | 722 | 725 | 166.4 |
| C | 13 | 61 | 6158 | 32.66 | 722 | 725 | 166.4 |
| D | 13 | 223 | 70640 | 402.32 | 726 | 704 | 173.8 |
| D | 10 | 172 | 20199 | 112.15 | 726 | 704 | 173.8 |
| D | 5 | 233 | 16720 | 92.14 | 726 | 704 | 173.8 |
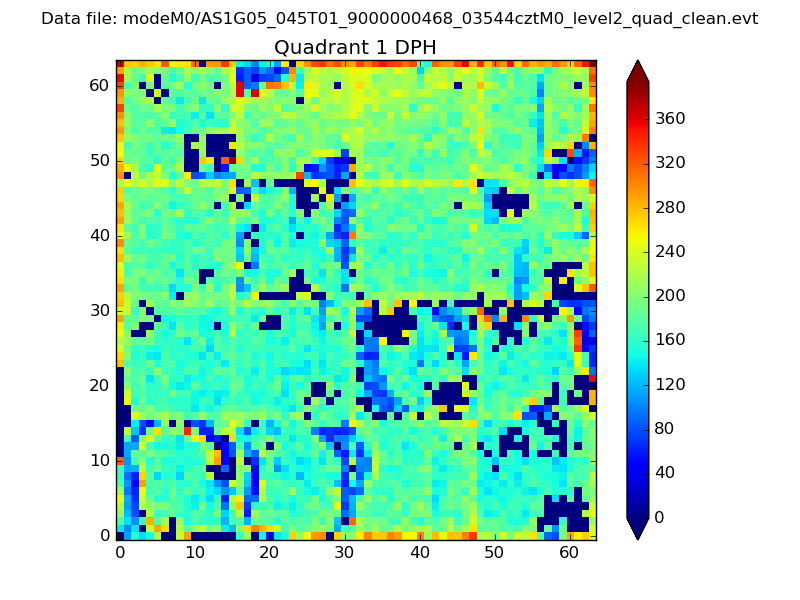
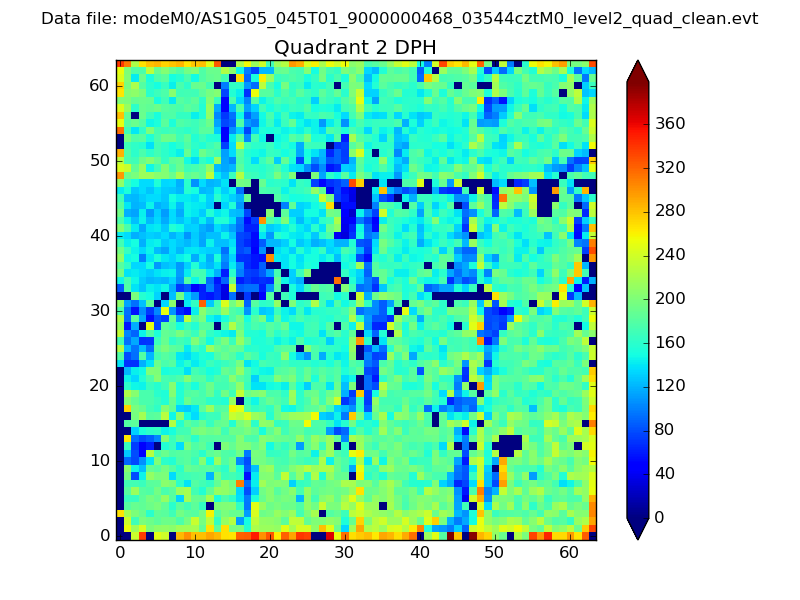
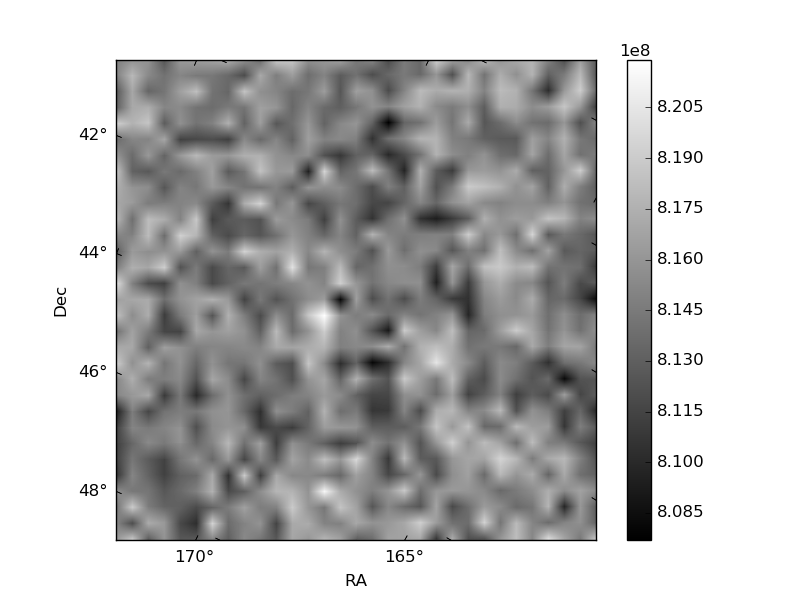
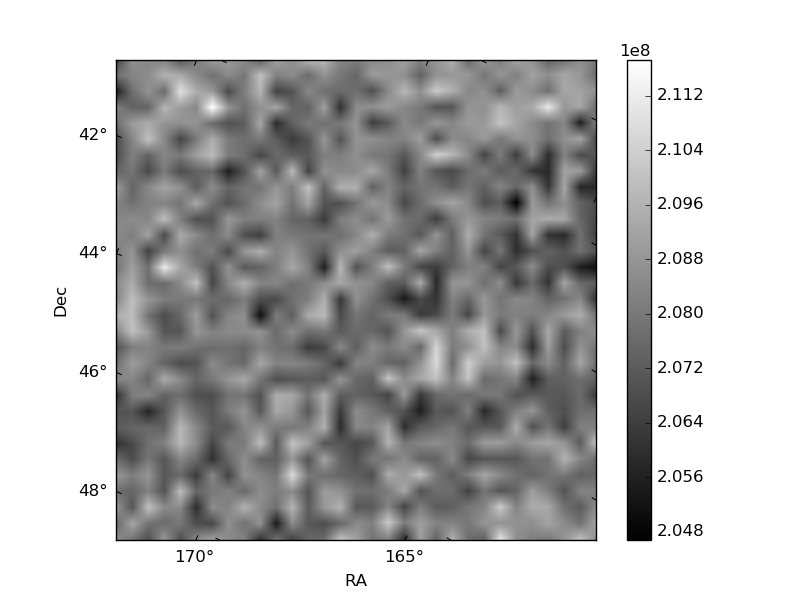
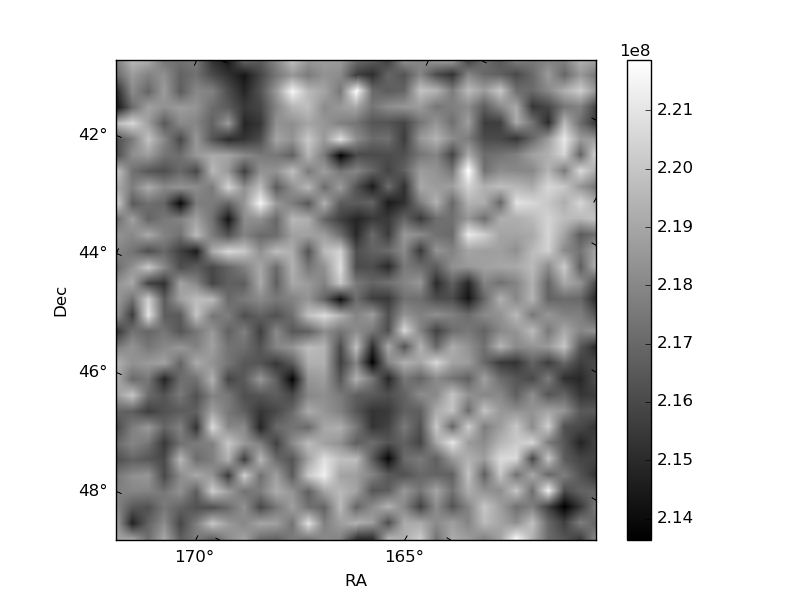
Histogram calculated using DETX and DETY for each event in the final _common_clean file
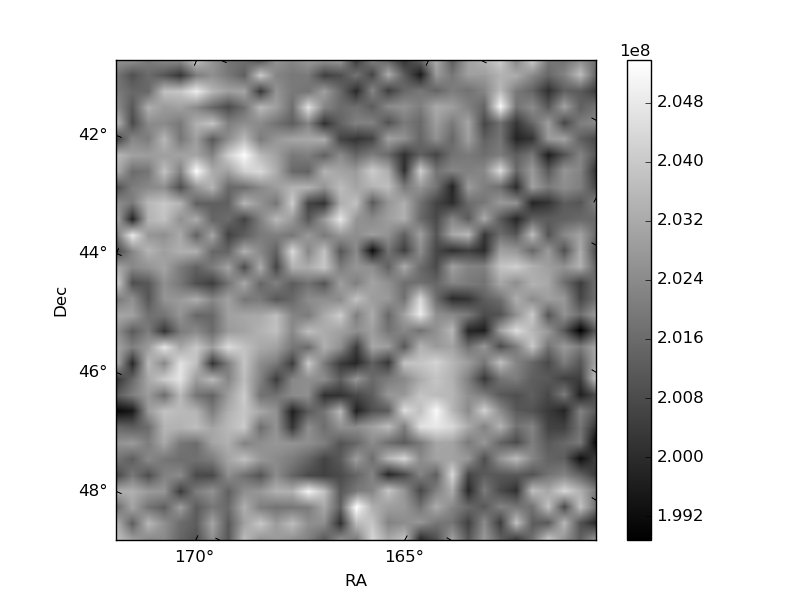
| Quadrant A | 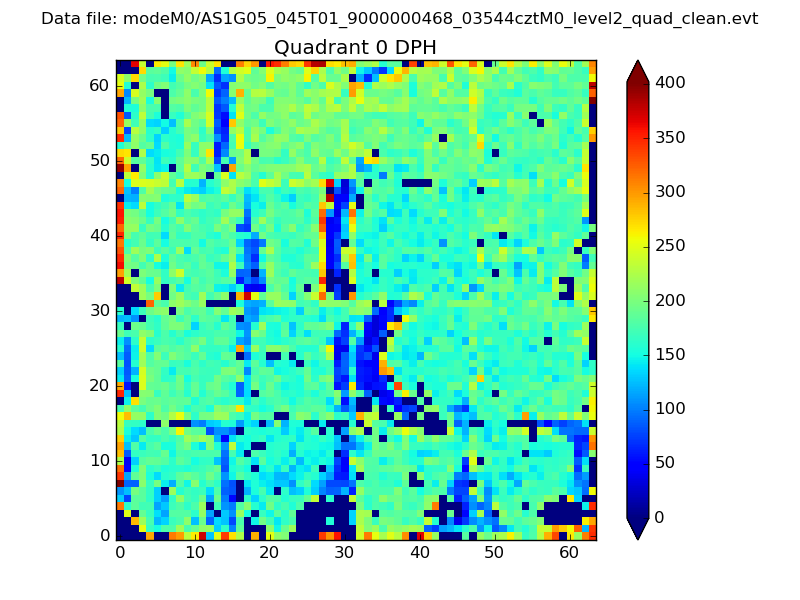 |
 |
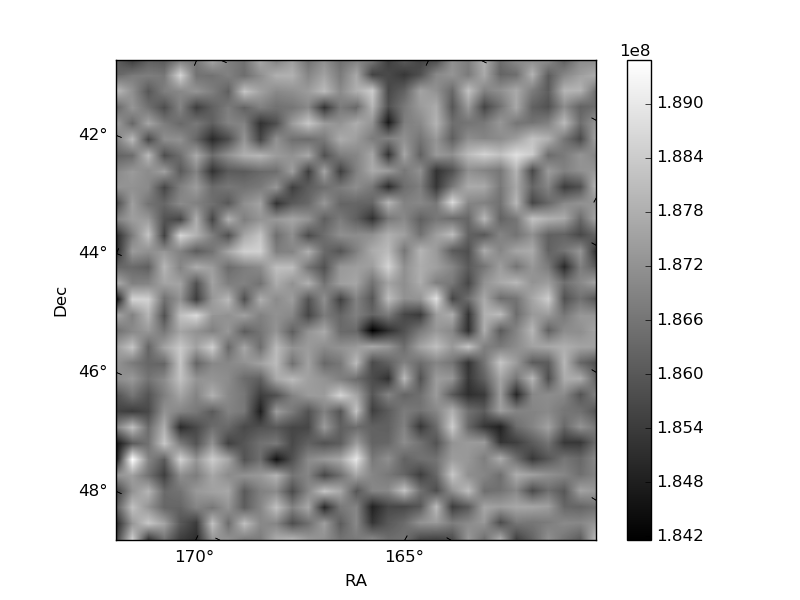
Quadrant B |
|---|---|---|---|
| Quadrant D | 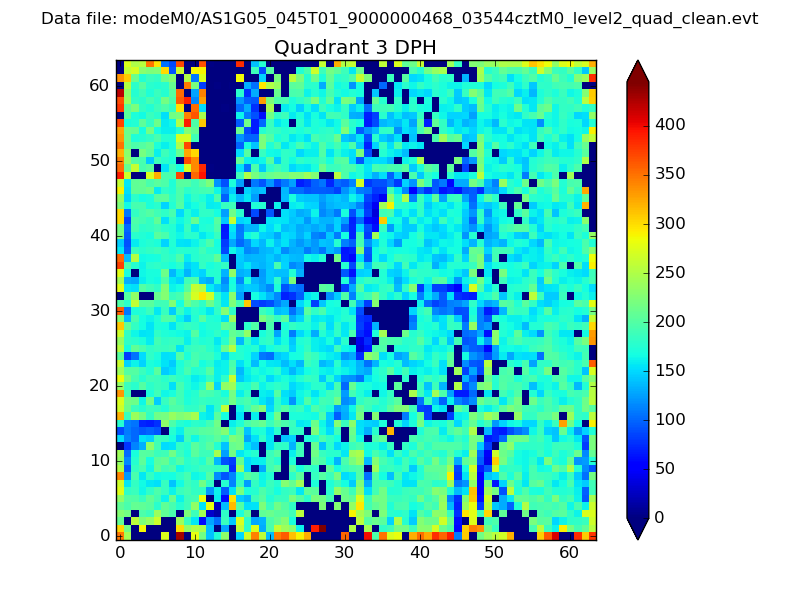 |
 |
Quadrant C |
| Plot type | Count rate plots | Images |
|---|---|---|
| Comparison with Poisson distribution Blue bars denote a histogram of data divided into 1 sec bins. Red curve is a Poisson curve with rate = median count rate of data. |
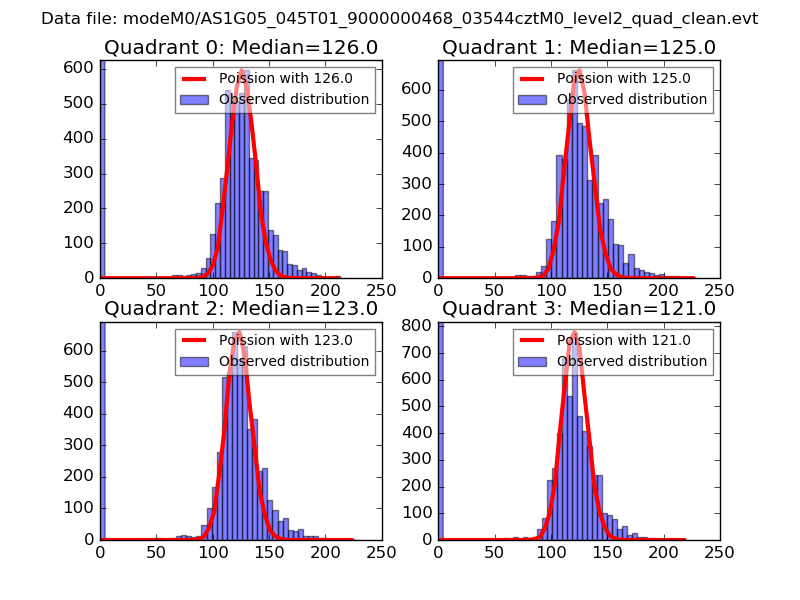 |
 |
| Quadrant-wise count rates Data is divided into 100 sec bins |
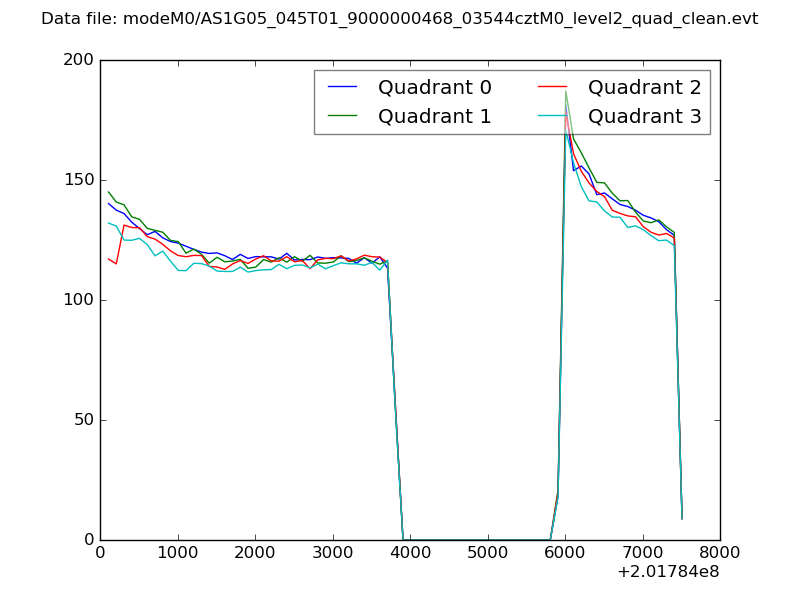 |
|
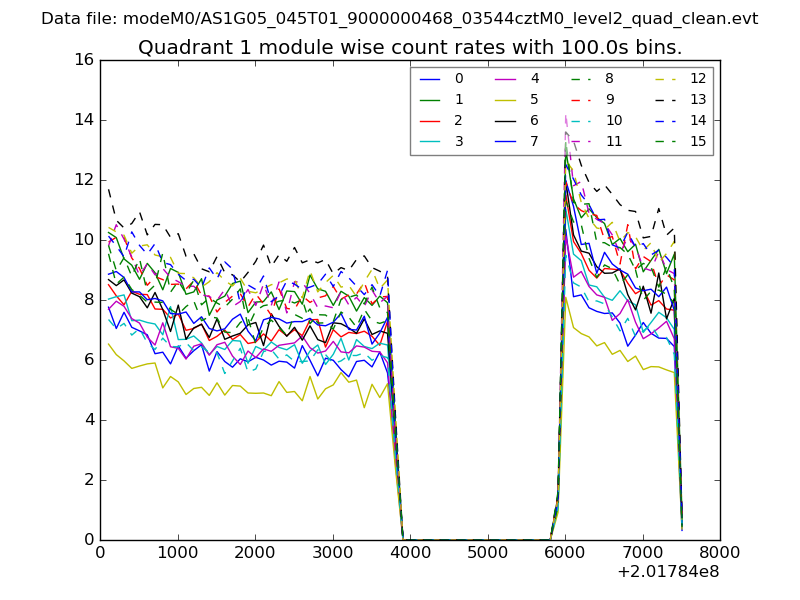
| Module-wise count rates for Quadrant A Data is divided into 100 sec bins |
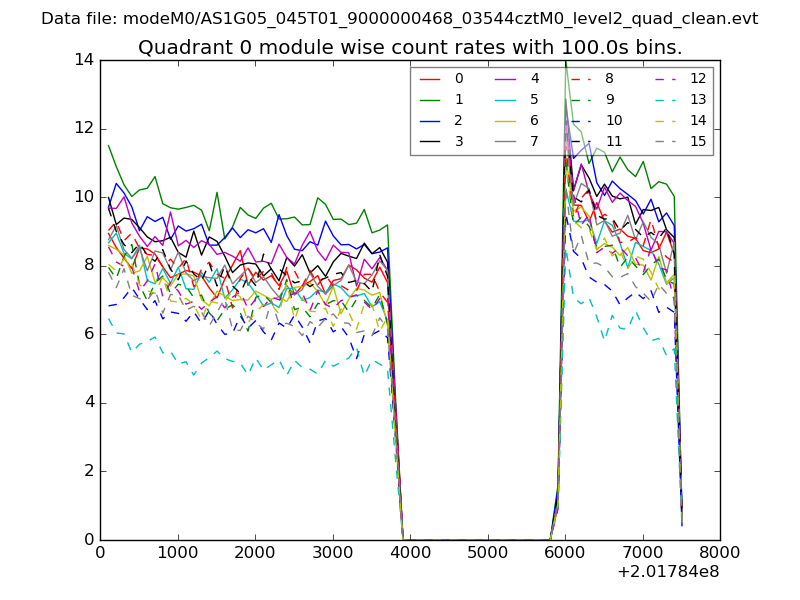 |
 |
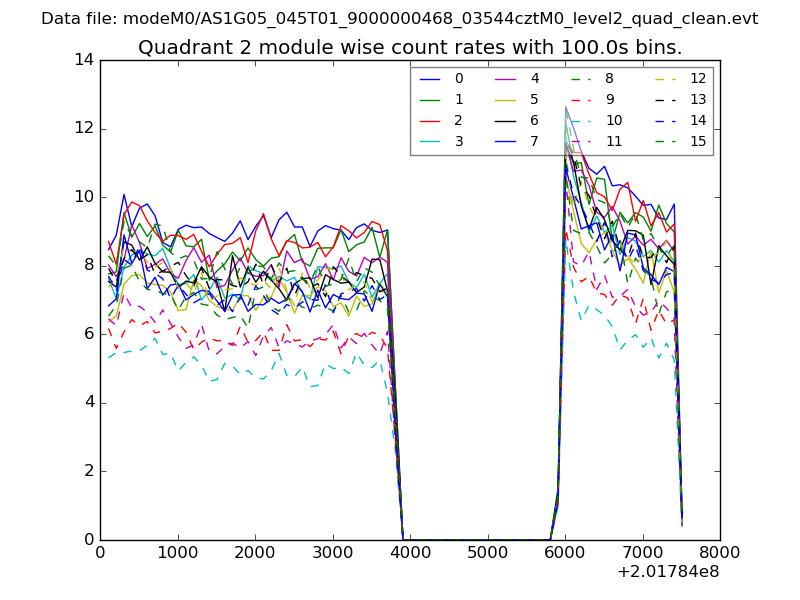
| Module-wise count rates for Quadrant B Data is divided into 100 sec bins |
 |
 |
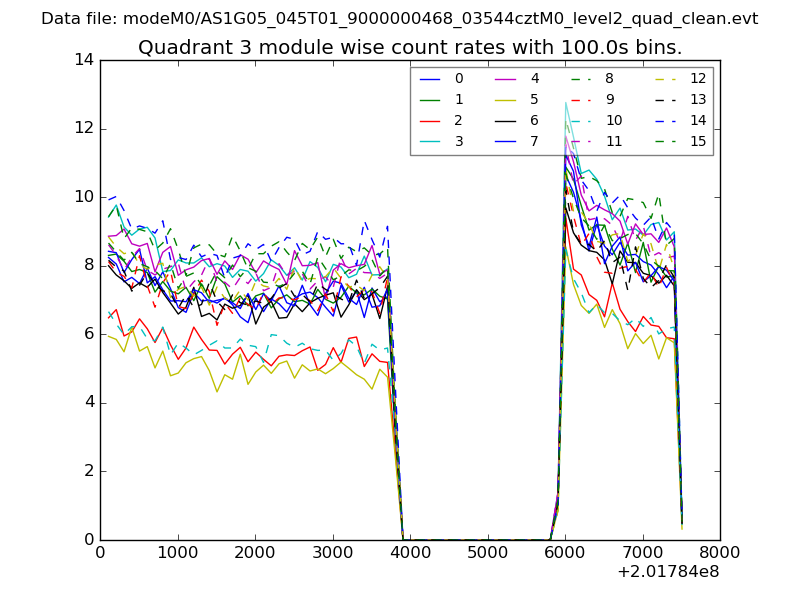
| Module-wise count rates for Quadrant C Data is divided into 100 sec bins |
 |
 |
| Module-wise count rates for Quadrant D Data is divided into 100 sec bins |
 |
 |
| Parameter | Plot |
|---|---|
| CZT HV Monitor | 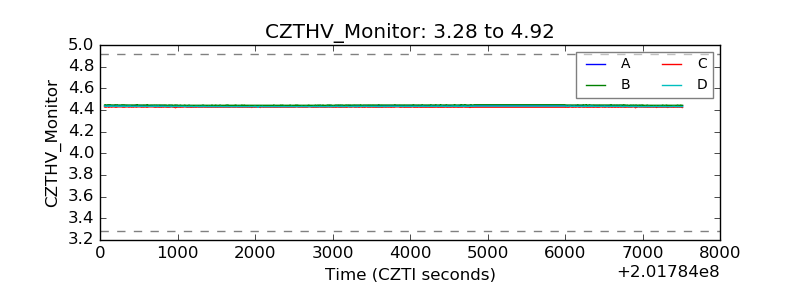 |
| D_VDD | 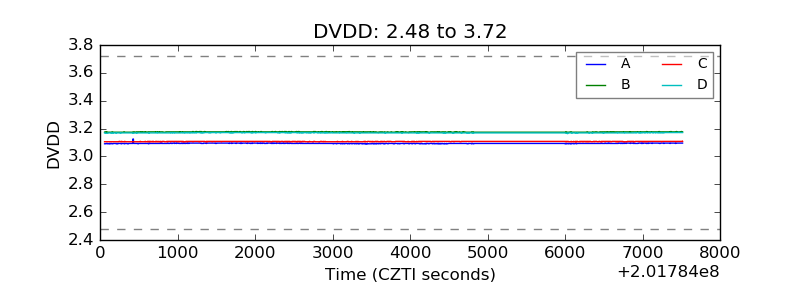 |
| Temperature 1 | 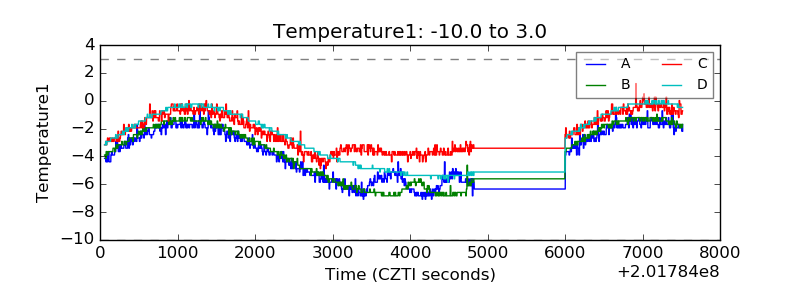 |
| Veto HV Monitor | 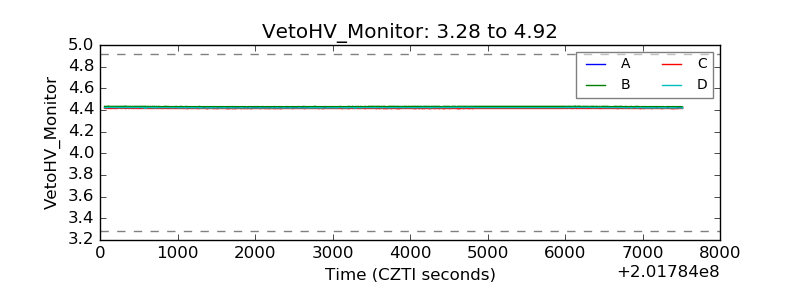 |
| Veto LLD | 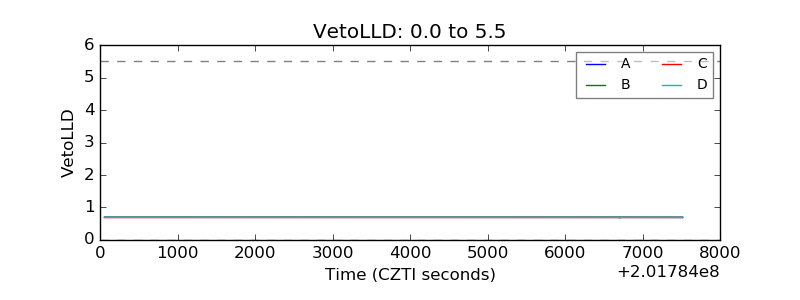 |
| Alpha Counter | 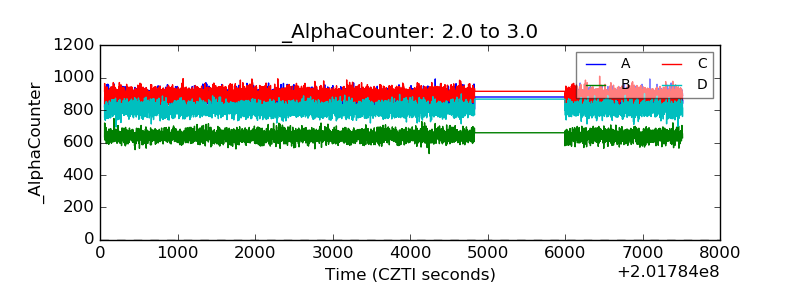 |
| _CPM_Rate | 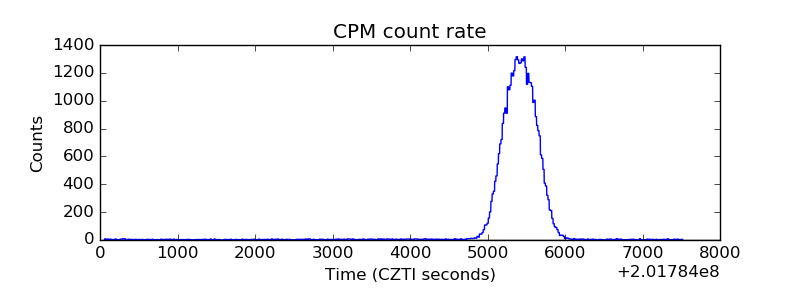 |
| CZT Counter | 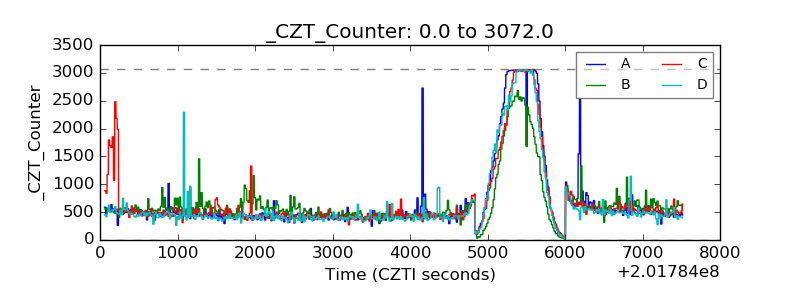 |
| +2.5 Volts monitor | 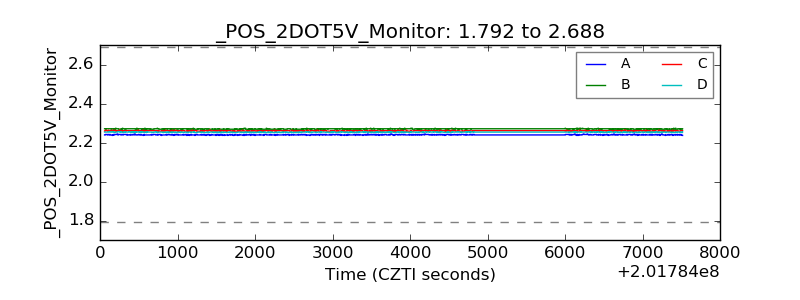 |
| +5 Volts monitor |  |
| _ROLL_ROT | 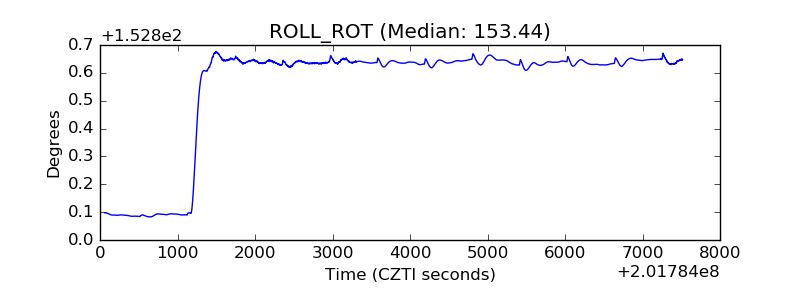 |
| _Roll_DEC | 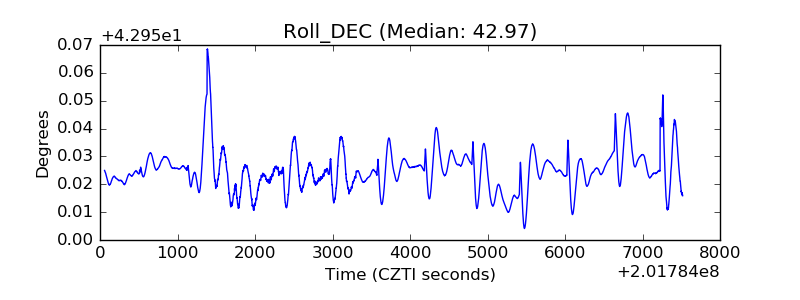 |
| _Roll_RA | 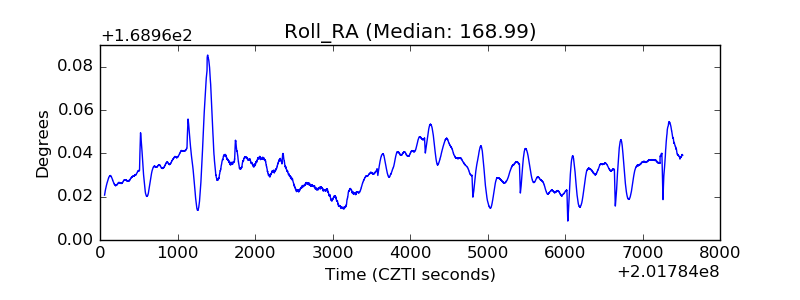 |
| Veto Counter | 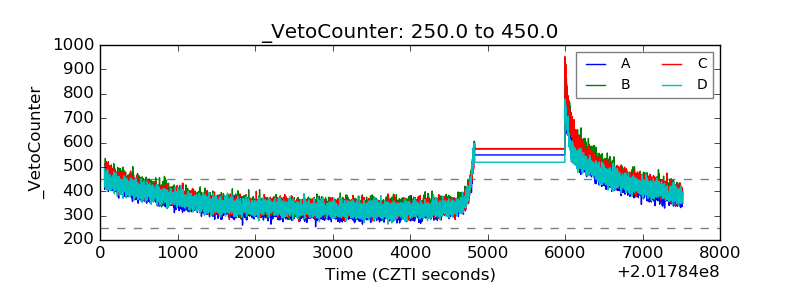 |