| Param | Original file | Final file |
|---|---|---|
| Filename | modeM0/AS1G05_045T01_9000000468_03546cztM0_level2.evt | modeM0/AS1G05_045T01_9000000468_03546cztM0_level2_quad_clean.evt |
| Size (bytes) | 447,151,680 | 74,833,920 |
| Size | 426.4 MB | 71.4 MB |
| Events in quadrant A | 2,816,964 | 473,254 |
| Events in quadrant B | 3,030,060 | 472,688 |
| Events in quadrant C | 4,619,956 | 458,626 |
| Events in quadrant D | 2,682,758 | 457,549 |
| Mode M0 | |||
|---|---|---|---|
| Quadrant | BADHDUFLAG | Total packets | Discarded packets |
| A | 0 | 12268 | 2 |
| B | 0 | 12820 | 1 |
| C | 0 | 17763 | 1 |
| D | 0 | 12195 | 1 |
| Mode M9 | |||
|---|---|---|---|
| Quadrant | BADHDUFLAG | Total packets | Discarded packets |
| A | 0 | 13 | 0 |
| B | 0 | 13 | 0 |
| C | 0 | 13 | 0 |
| D | 0 | 13 | 0 |
| Mode SS | |||
|---|---|---|---|
| Quadrant | BADHDUFLAG | Total packets | Discarded packets |
| A | 0 | 116 | 0 |
| B | 0 | 116 | 0 |
| C | 0 | 116 | 0 |
| D | 0 | 116 | 0 |
| Quadrant | Total seconds | Saturated seconds | Saturation percentage |
|---|---|---|---|
| A | 5783 | 75 | 1.296905% |
| B | 5783 | 46 | 0.795435% |
| C | 5783 | 276 | 4.772609% |
| D | 5783 | 53 | 0.916479% |
Noise dominated data is calculated using 1-second bins in cleaned event files. If a bin has >2000 counts, and if more than 50% of those come from <1% of pixels, then it is considered to be noise-dominated and hence unusable.
| Quadrant | # 1 sec bins | Bins with >0 counts | Bins with >2000 counts | High rate bins dominated by noise | Noise dominated (total time) | Noise dominated (detector-on time) | Marked lightcurve |
|---|---|---|---|---|---|---|---|
| A | 7098 | 5783 | 16 | 16 | 0.23% | 0.28% |  |
| B | 7098 | 5784 | 5 | 5 | 0.07% | 0.09% | 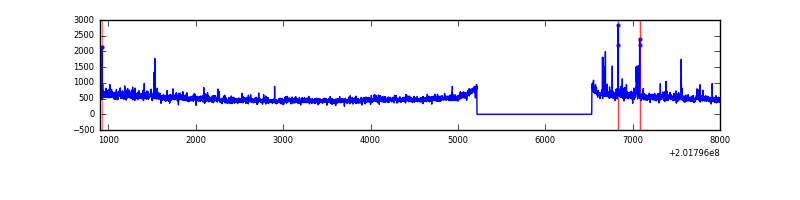 |
| C | 7098 | 5783 | 187 | 187 | 2.63% | 3.23% |  |
| D | 7098 | 5783 | 17 | 17 | 0.24% | 0.29% | 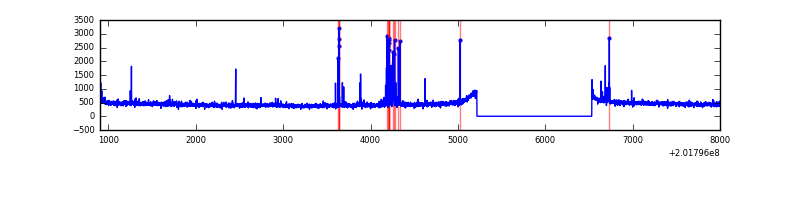 |
Top three noisy pixels from each quadrant. If the there are fewer than three noisy pixels in the level2.evt file, extra rows are filled as -1
| Pixel properties | Quadrant properties | ||||||
|---|---|---|---|---|---|---|---|
| Quadrant | DetID | PixID | Counts | Sigma | Mean | Median | Sigma |
| A | 8 | 15 | 56816 | 405.22 | 681 | 668 | 138.6 |
| A | 3 | 1 | 52789 | 376.16 | 681 | 668 | 138.6 |
| A | 0 | 50 | 42412 | 301.27 | 681 | 668 | 138.6 |
| B | 15 | 204 | 204746 | 1586.98 | 687 | 671 | 128.6 |
| B | 0 | 229 | 32461 | 247.21 | 687 | 671 | 128.6 |
| B | 0 | 183 | 21133 | 159.12 | 687 | 671 | 128.6 |
| C | 1 | 192 | 1099722 | 7181.67 | 658 | 663 | 153.0 |
| C | 4 | 248 | 844275 | 5512.48 | 658 | 663 | 153.0 |
| C | 14 | 48 | 64085 | 414.42 | 658 | 663 | 153.0 |
| D | 13 | 239 | 89626 | 556.88 | 666 | 648 | 159.8 |
| D | 13 | 223 | 39004 | 240.06 | 666 | 648 | 159.8 |
| D | 2 | 37 | 9154 | 53.24 | 666 | 648 | 159.8 |
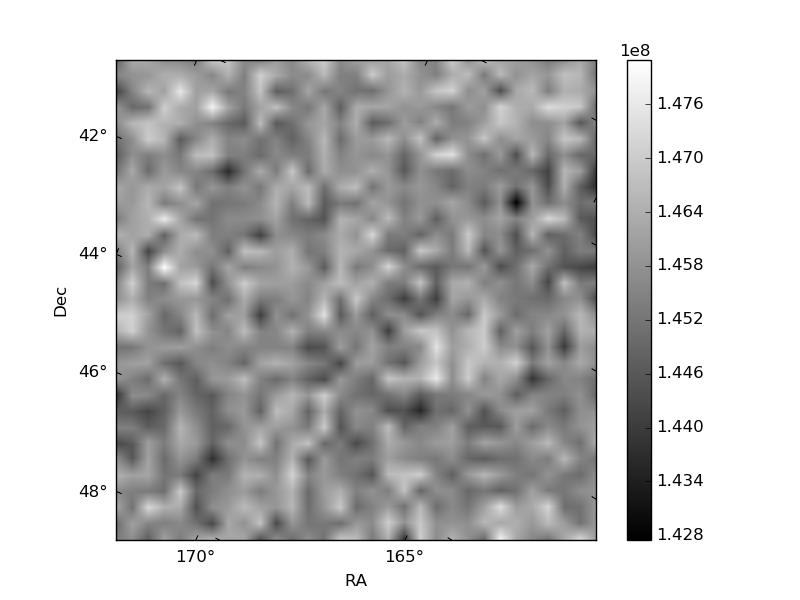
Histogram calculated using DETX and DETY for each event in the final _common_clean file
| Quadrant A |  |
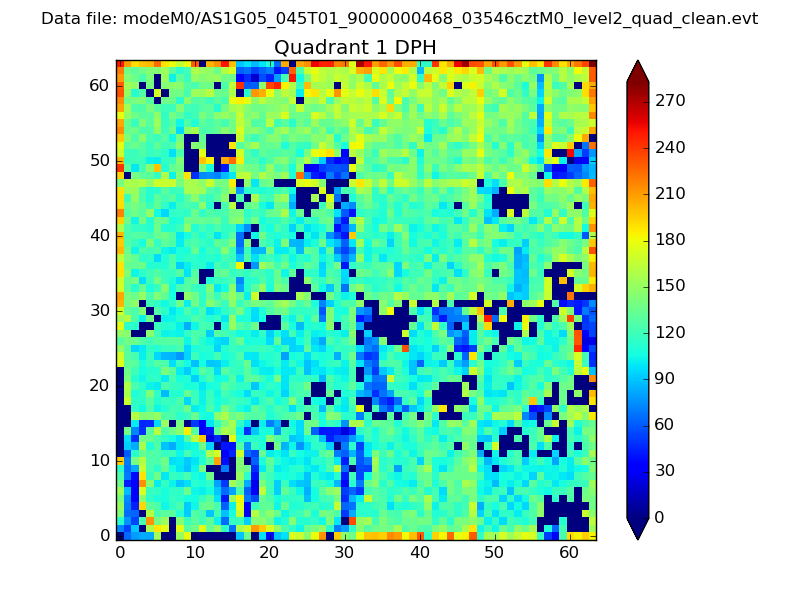 |
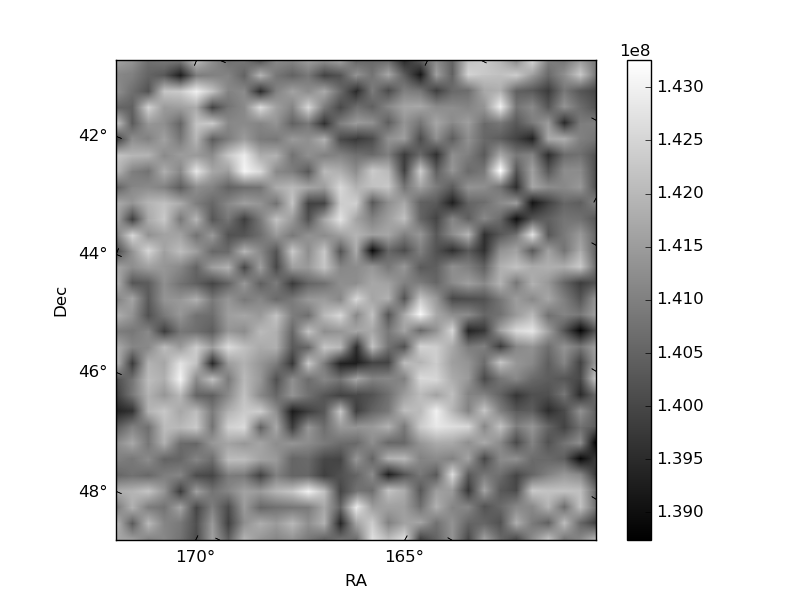
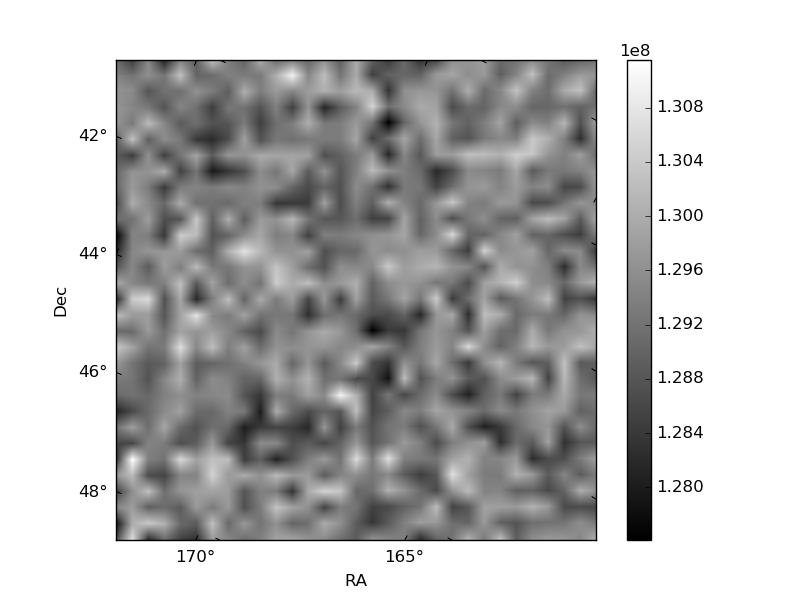
Quadrant B |
|---|---|---|---|
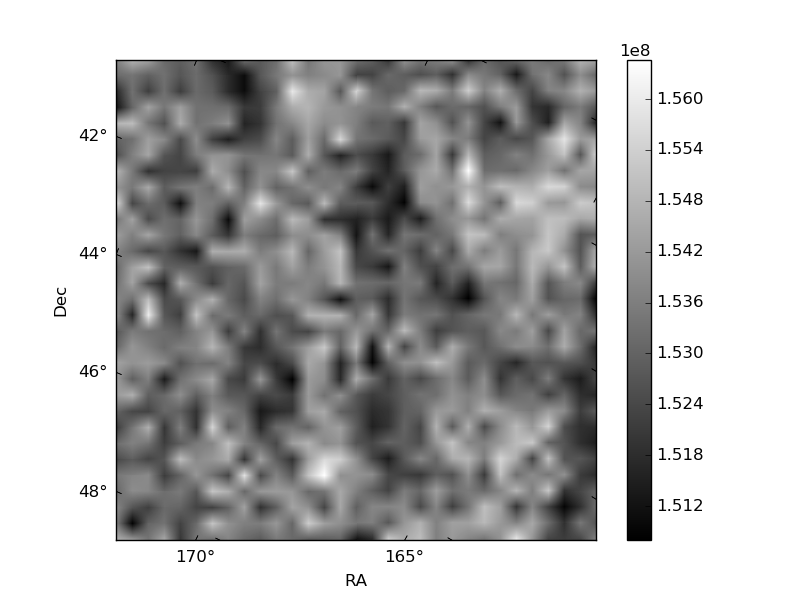
| Quadrant D | 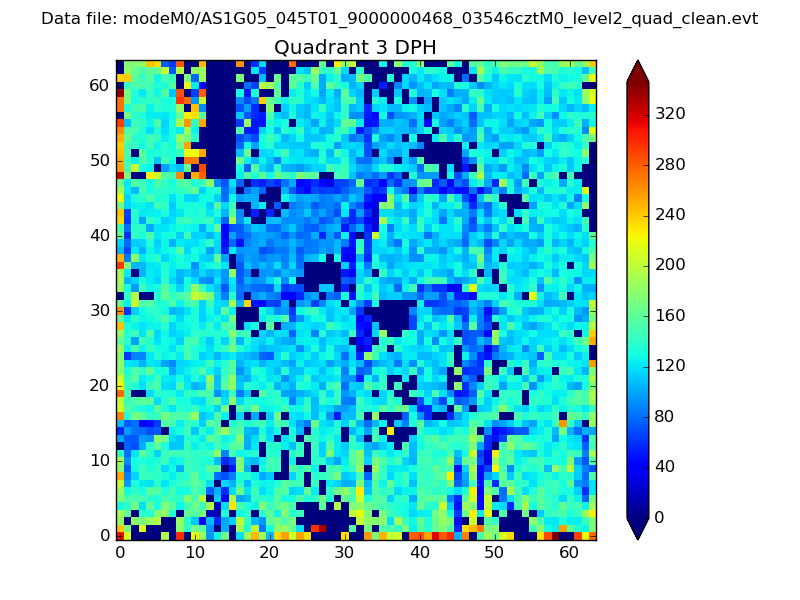 |
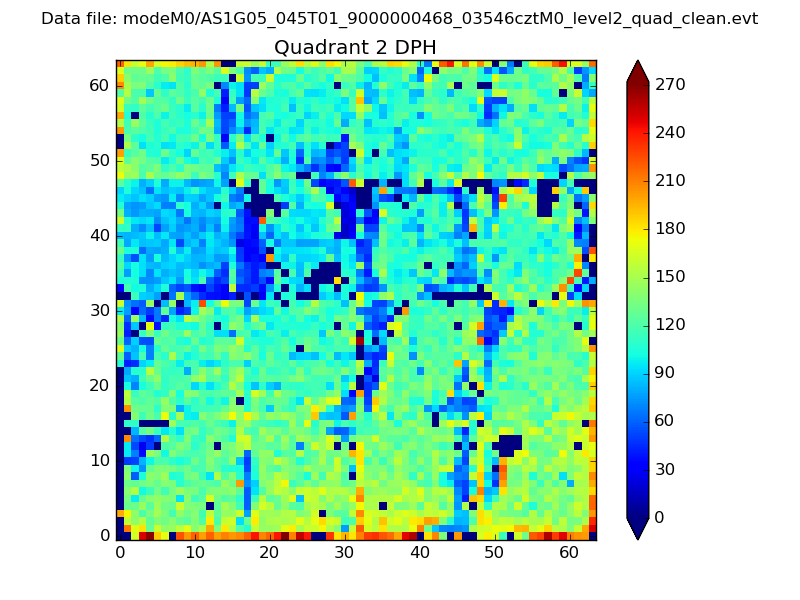 |
Quadrant C |
| Plot type | Count rate plots | Images |
|---|---|---|
| Comparison with Poisson distribution Blue bars denote a histogram of data divided into 1 sec bins. Red curve is a Poisson curve with rate = median count rate of data. |
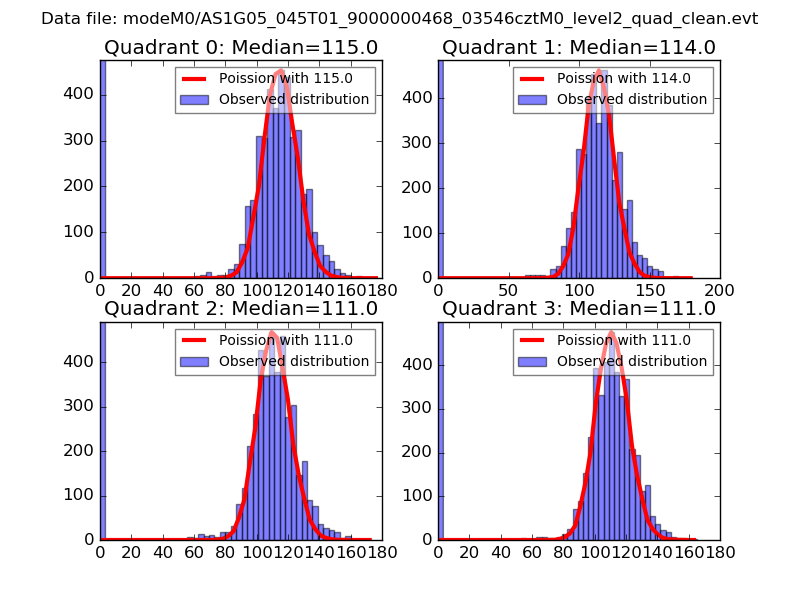 |
 |
| Quadrant-wise count rates Data is divided into 100 sec bins |
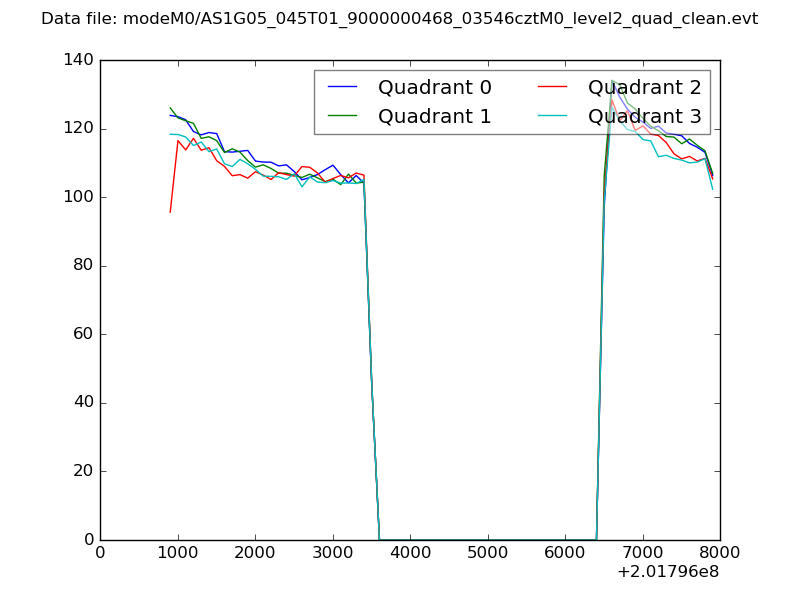 |
|
| Module-wise count rates for Quadrant A Data is divided into 100 sec bins |
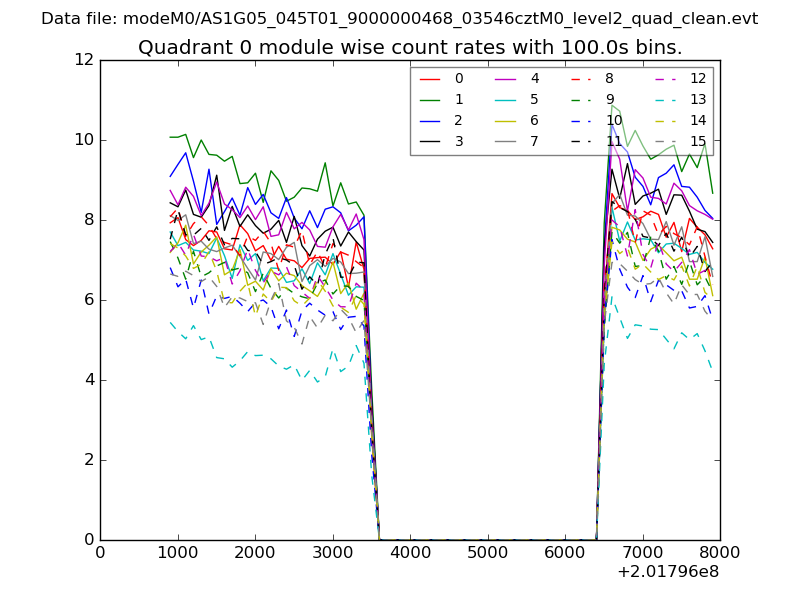 |
 |
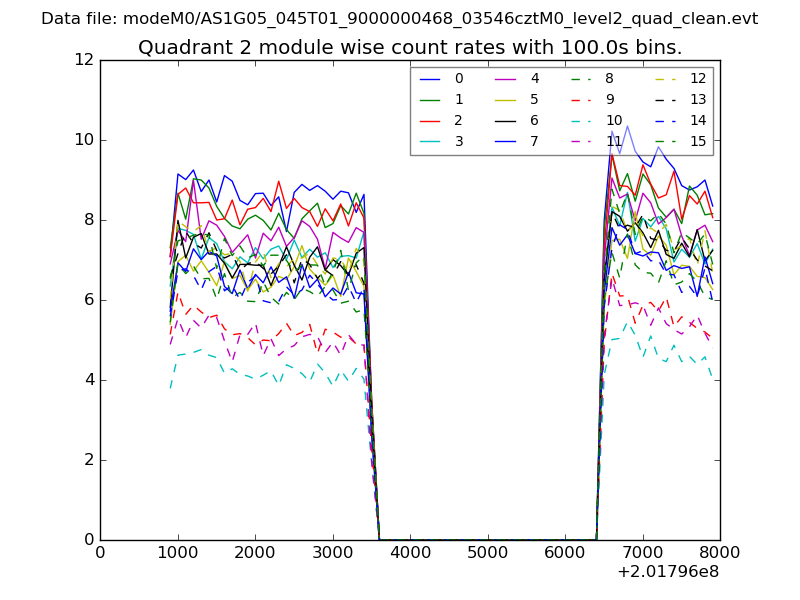
| Module-wise count rates for Quadrant B Data is divided into 100 sec bins |
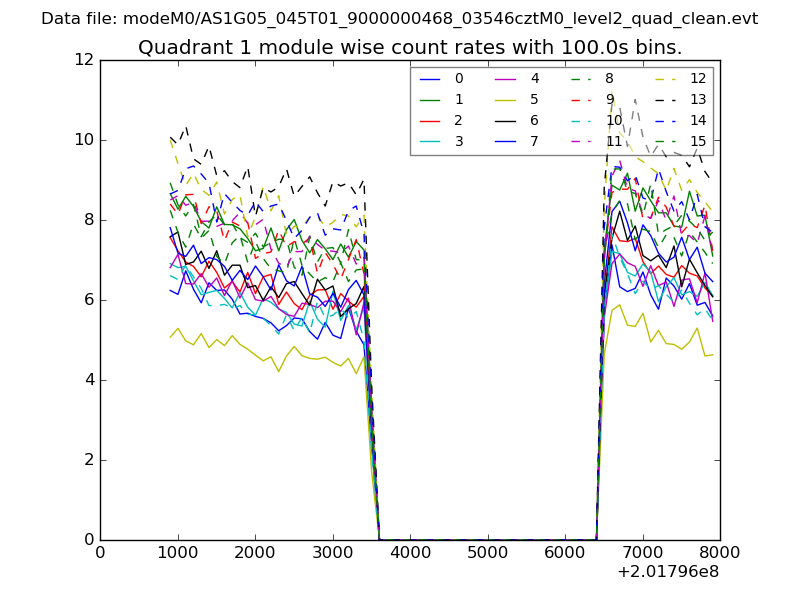 |
 |
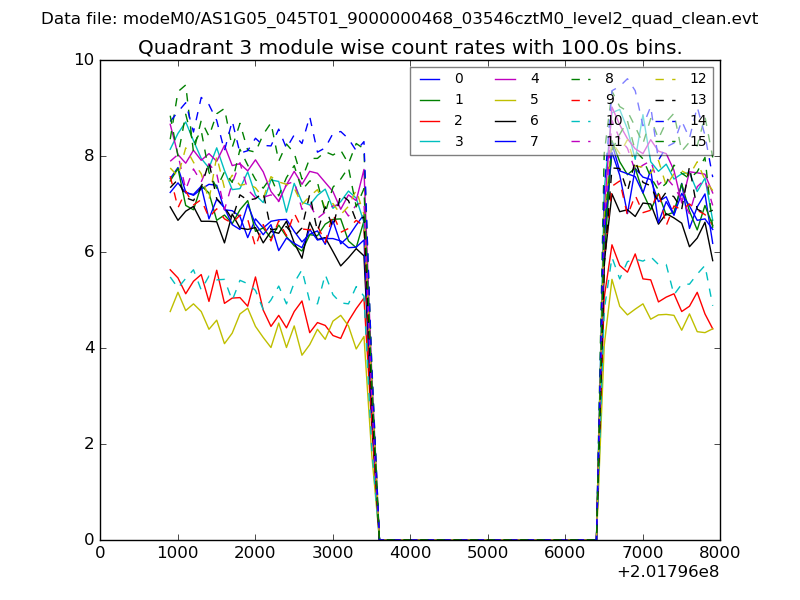
| Module-wise count rates for Quadrant C Data is divided into 100 sec bins |
 |
 |
| Module-wise count rates for Quadrant D Data is divided into 100 sec bins |
 |
 |
| Parameter | Plot |
|---|---|
| CZT HV Monitor | 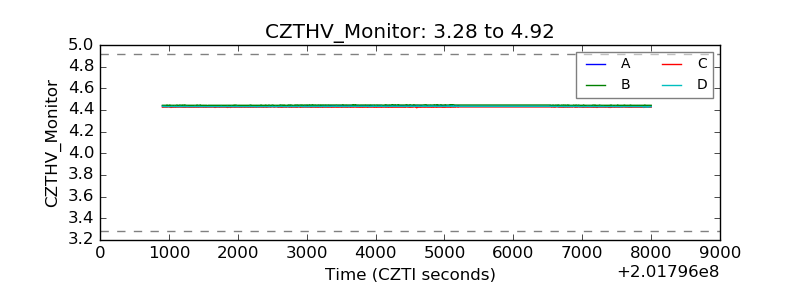 |
| D_VDD | 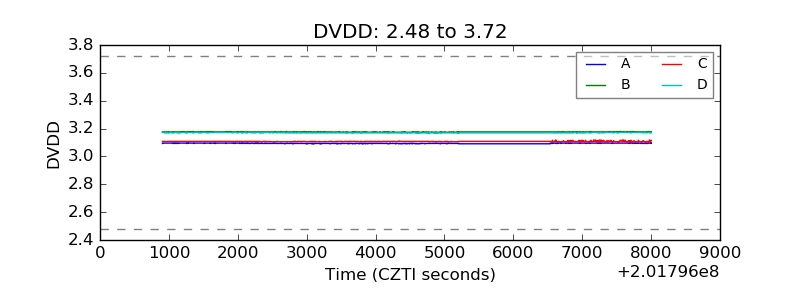 |
| Temperature 1 | 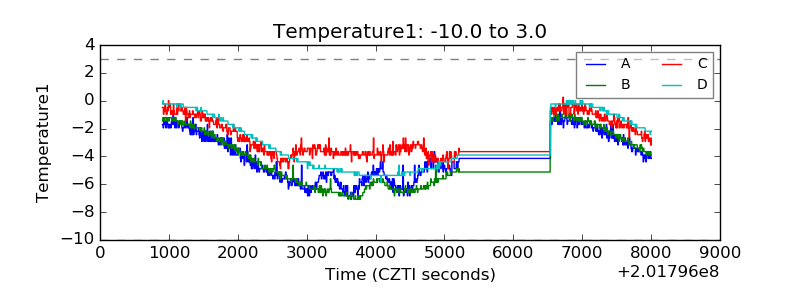 |
| Veto HV Monitor | 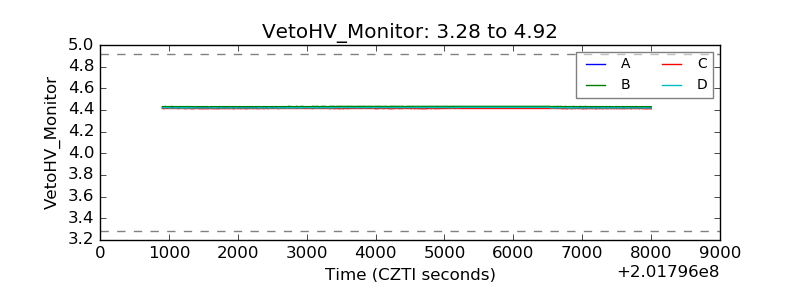 |
| Veto LLD | 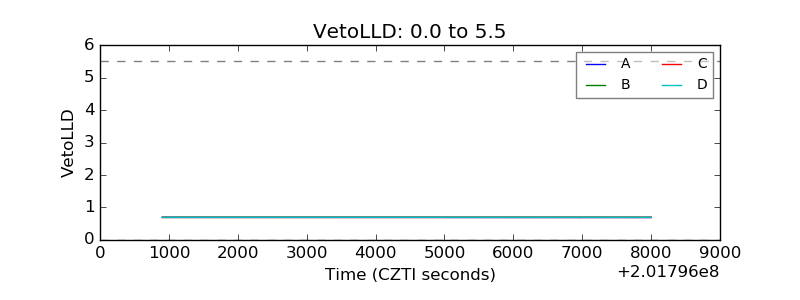 |
| Alpha Counter | 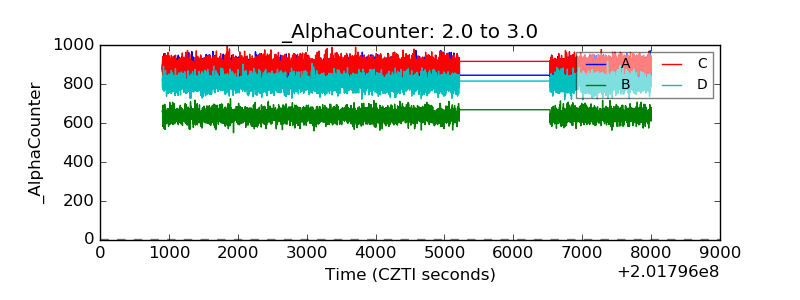 |
| _CPM_Rate | 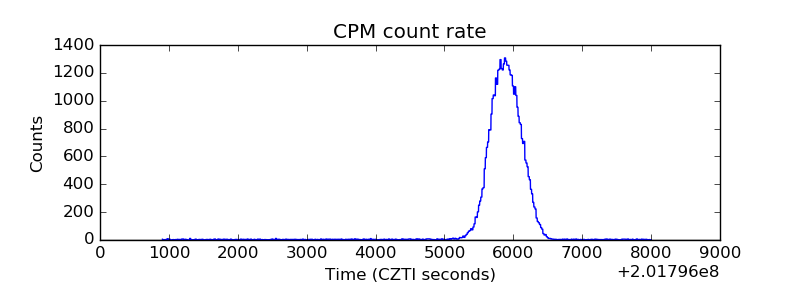 |
| CZT Counter | 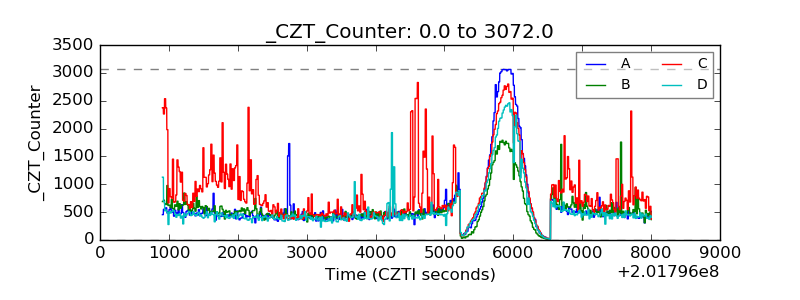 |
| +2.5 Volts monitor | 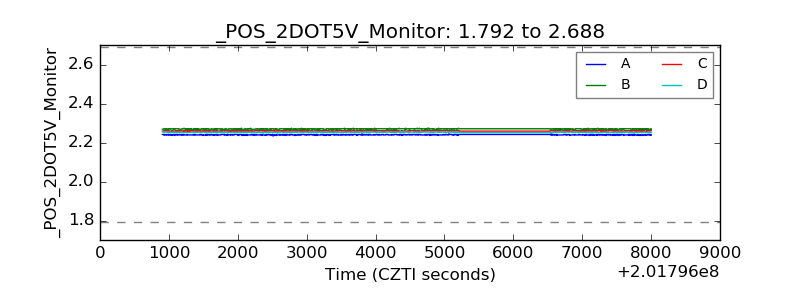 |
| +5 Volts monitor |  |
| _ROLL_ROT | 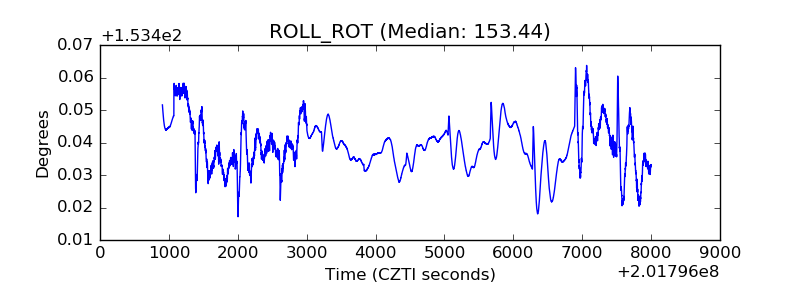 |
| _Roll_DEC | 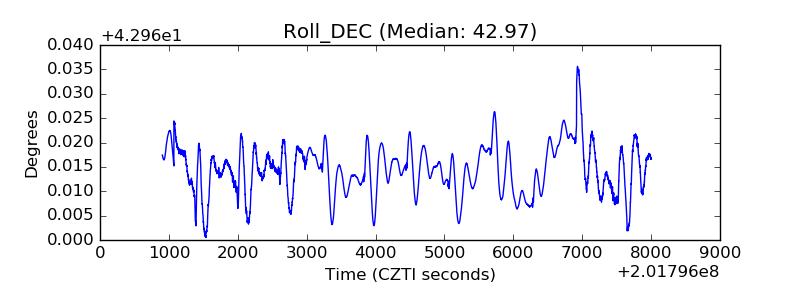 |
| _Roll_RA | 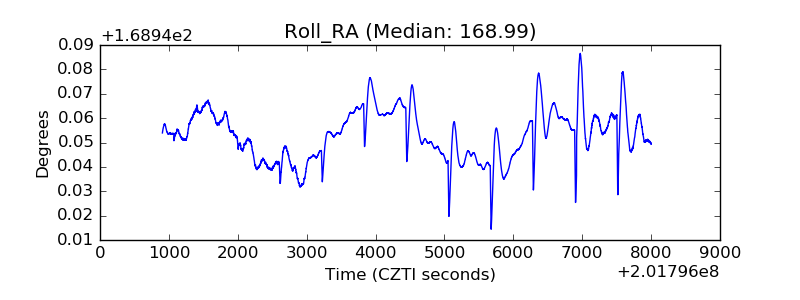 |
| Veto Counter | 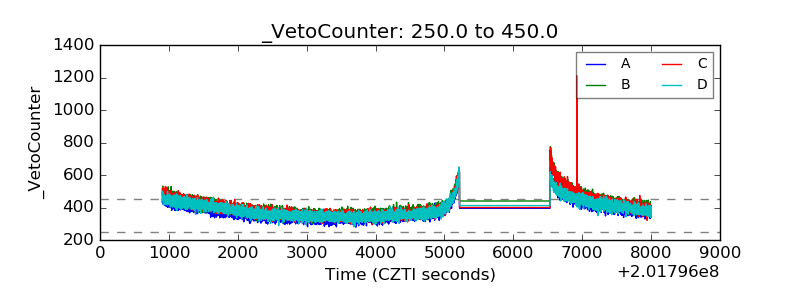 |