| Param | Original file | Final file |
|---|---|---|
| Filename | modeM0/AS1G05_045T01_9000000468_03547cztM0_level2.evt | modeM0/AS1G05_045T01_9000000468_03547cztM0_level2_quad_clean.evt |
| Size (bytes) | 440,634,240 | 71,392,320 |
| Size | 420.2 MB | 68.1 MB |
| Events in quadrant A | 2,833,794 | 441,043 |
| Events in quadrant B | 3,223,545 | 440,822 |
| Events in quadrant C | 4,208,366 | 430,618 |
| Events in quadrant D | 2,668,854 | 427,635 |
| Mode M0 | |||
|---|---|---|---|
| Quadrant | BADHDUFLAG | Total packets | Discarded packets |
| A | 0 | 12564 | 2 |
| B | 0 | 13713 | 1 |
| C | 0 | 16829 | 1 |
| D | 0 | 12421 | 1 |
| Mode M9 | |||
|---|---|---|---|
| Quadrant | BADHDUFLAG | Total packets | Discarded packets |
| A | 0 | 13 | 0 |
| B | 0 | 13 | 0 |
| C | 0 | 13 | 0 |
| D | 0 | 13 | 0 |
| Mode SS | |||
|---|---|---|---|
| Quadrant | BADHDUFLAG | Total packets | Discarded packets |
| A | 0 | 122 | 0 |
| B | 0 | 122 | 0 |
| C | 0 | 122 | 0 |
| D | 0 | 122 | 0 |
| Quadrant | Total seconds | Saturated seconds | Saturation percentage |
|---|---|---|---|
| A | 6038 | 27 | 0.447168% |
| B | 6038 | 36 | 0.596224% |
| C | 6038 | 197 | 3.262670% |
| D | 6038 | 21 | 0.347797% |
Noise dominated data is calculated using 1-second bins in cleaned event files. If a bin has >2000 counts, and if more than 50% of those come from <1% of pixels, then it is considered to be noise-dominated and hence unusable.
| Quadrant | # 1 sec bins | Bins with >0 counts | Bins with >2000 counts | High rate bins dominated by noise | Noise dominated (total time) | Noise dominated (detector-on time) | Marked lightcurve |
|---|---|---|---|---|---|---|---|
| A | 7318 | 6038 | 3 | 3 | 0.04% | 0.05% | 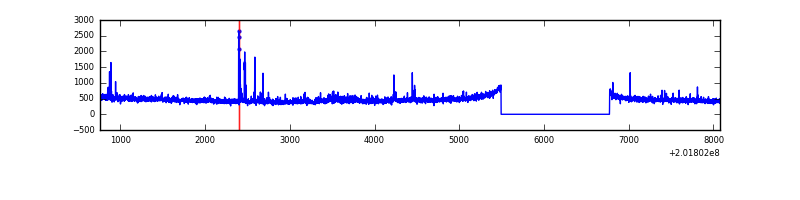 |
| B | 7318 | 6039 | 8 | 8 | 0.11% | 0.13% | 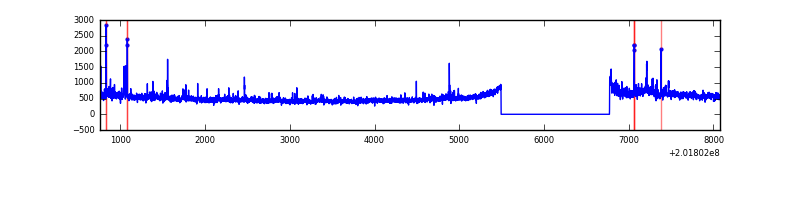 |
| C | 7318 | 6038 | 148 | 148 | 2.02% | 2.45% |  |
| D | 7318 | 6038 | 1 | 1 | 0.01% | 0.02% | 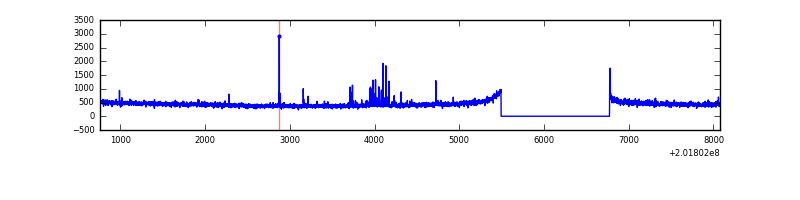 |
Top three noisy pixels from each quadrant. If the there are fewer than three noisy pixels in the level2.evt file, extra rows are filled as -1
| Pixel properties | Quadrant properties | ||||||
|---|---|---|---|---|---|---|---|
| Quadrant | DetID | PixID | Counts | Sigma | Mean | Median | Sigma |
| A | 0 | 118 | 68784 | 472.89 | 701 | 685 | 144.0 |
| A | 0 | 50 | 32478 | 220.78 | 701 | 685 | 144.0 |
| A | 3 | 1 | 13794 | 91.03 | 701 | 685 | 144.0 |
| B | 15 | 204 | 178454 | 1325.32 | 711 | 695 | 134.1 |
| B | 14 | 167 | 149293 | 1107.9 | 711 | 695 | 134.1 |
| B | 15 | 85 | 26450 | 192.02 | 711 | 695 | 134.1 |
| C | 1 | 192 | 919120 | 5739.48 | 686 | 691 | 160.0 |
| C | 4 | 248 | 545839 | 3406.76 | 686 | 691 | 160.0 |
| C | 14 | 48 | 19812 | 119.49 | 686 | 691 | 160.0 |
| D | 13 | 239 | 43198 | 257.21 | 686 | 665 | 165.4 |
| D | 13 | 137 | 11163 | 63.49 | 686 | 665 | 165.4 |
| D | 5 | 233 | 10498 | 59.46 | 686 | 665 | 165.4 |
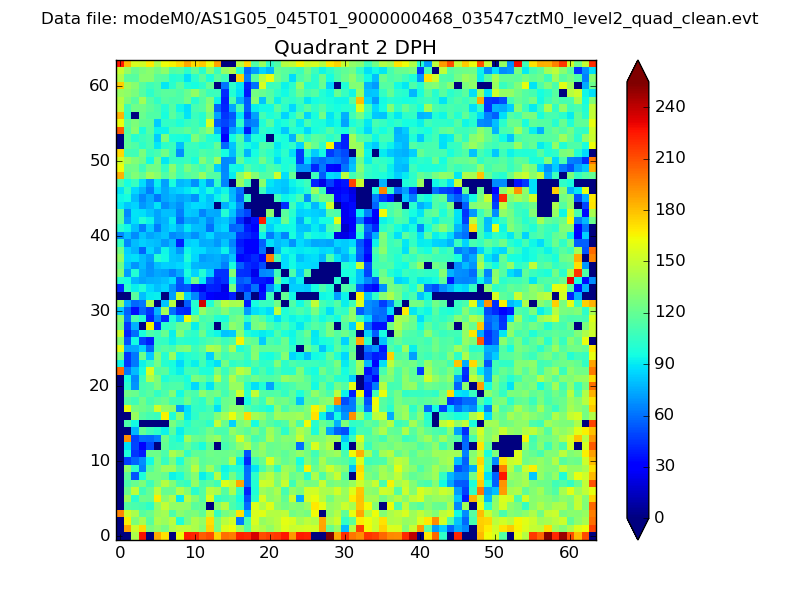
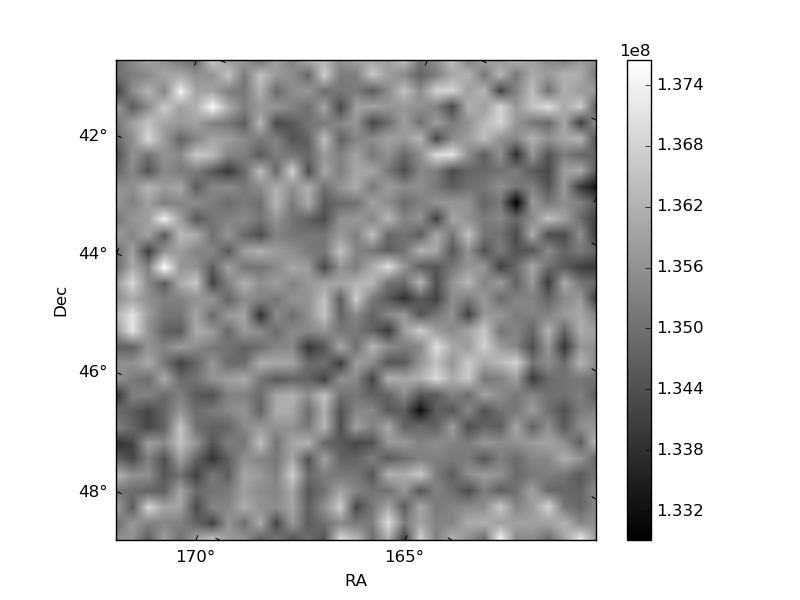
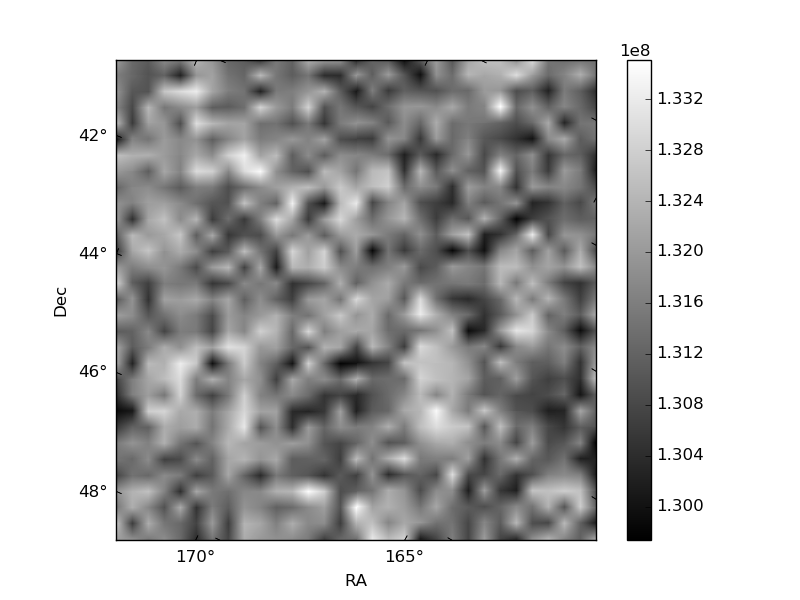
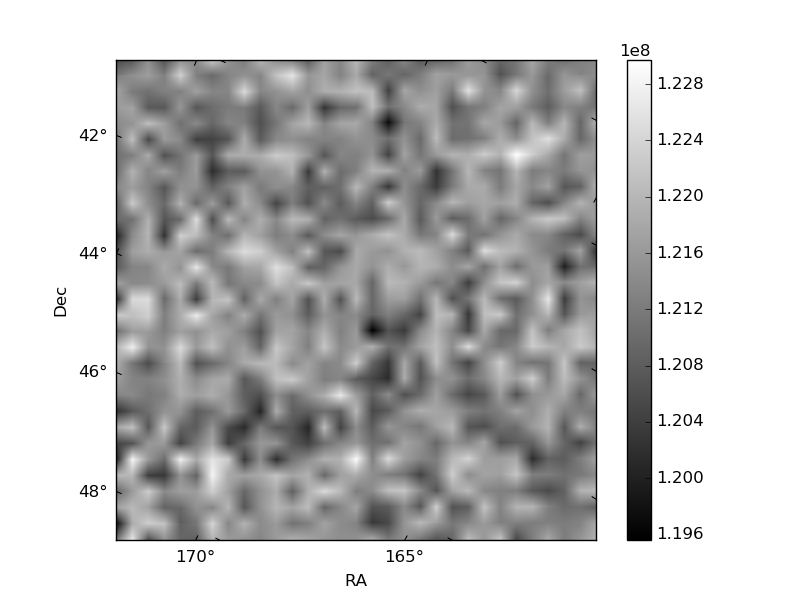
Histogram calculated using DETX and DETY for each event in the final _common_clean file
| Quadrant A | 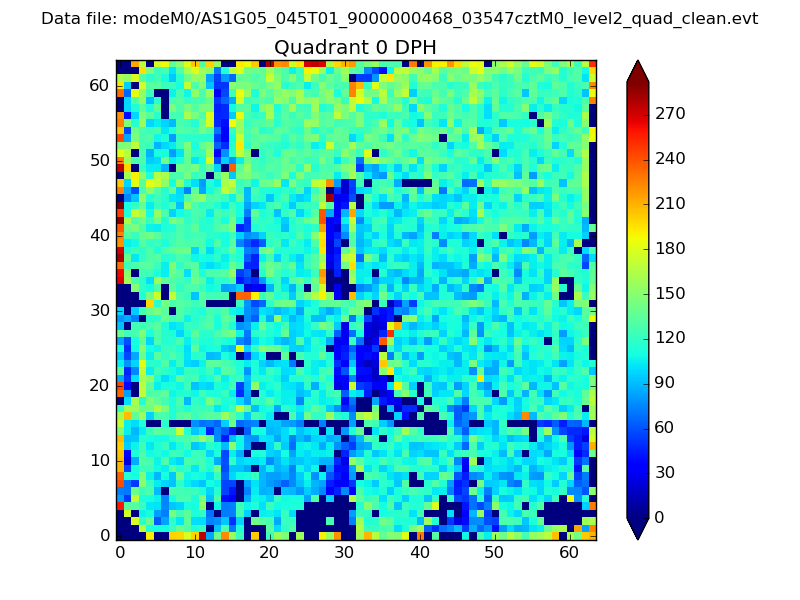 |
 |
Quadrant B |
|---|---|---|---|
| Quadrant D | 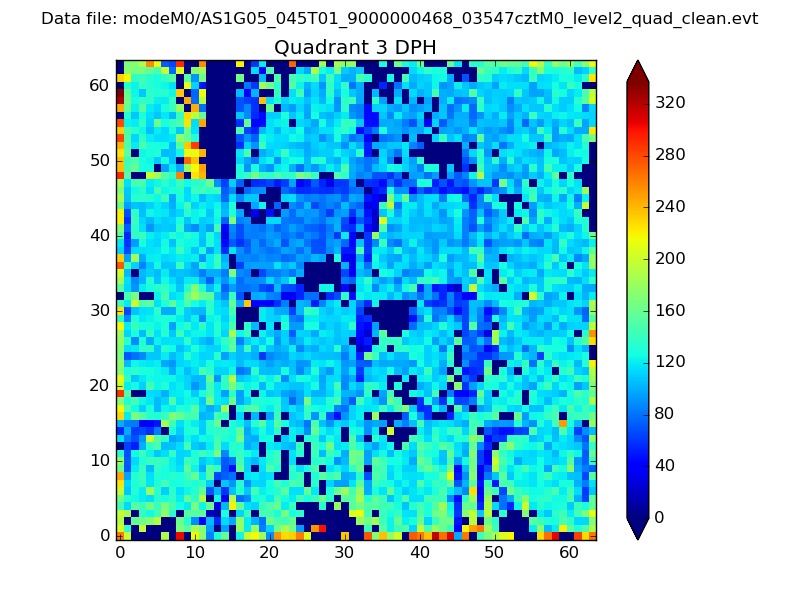 |
 |
Quadrant C |
| Plot type | Count rate plots | Images |
|---|---|---|
| Comparison with Poisson distribution Blue bars denote a histogram of data divided into 1 sec bins. Red curve is a Poisson curve with rate = median count rate of data. |
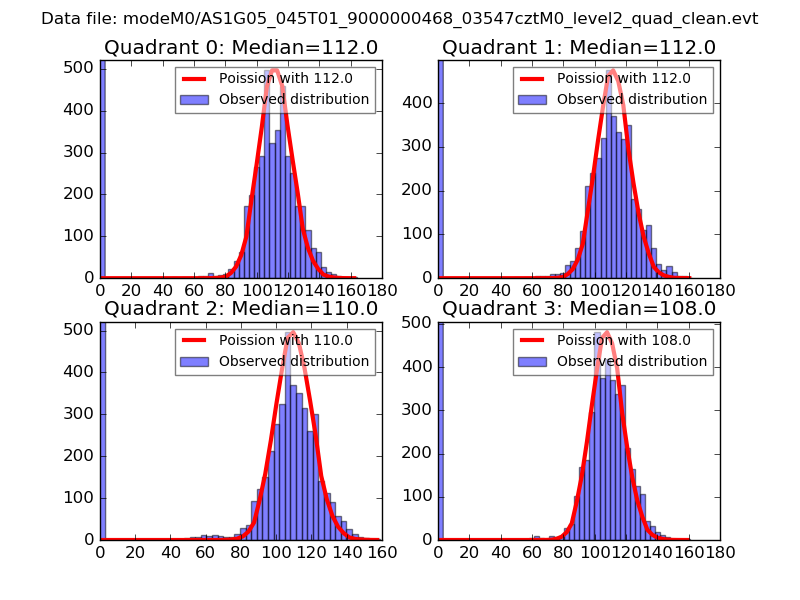 |
 |
| Quadrant-wise count rates Data is divided into 100 sec bins |
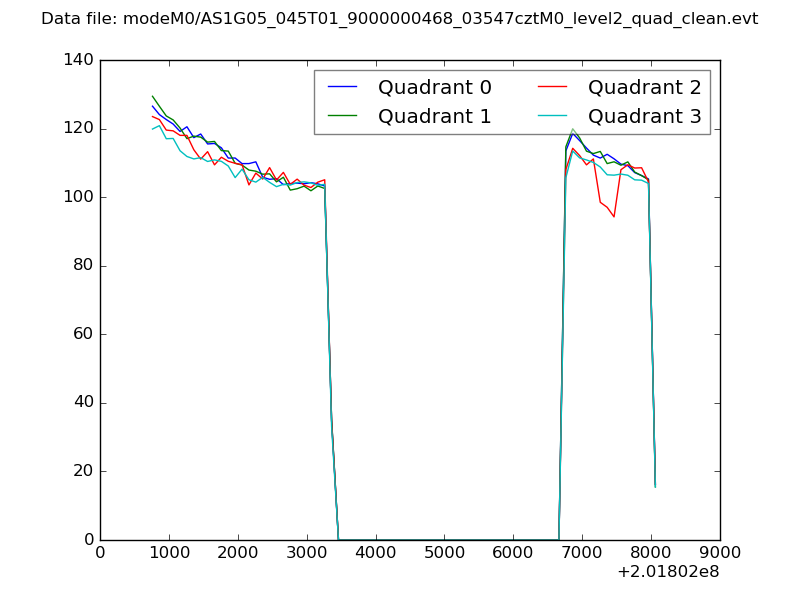 |
|
| Module-wise count rates for Quadrant A Data is divided into 100 sec bins |
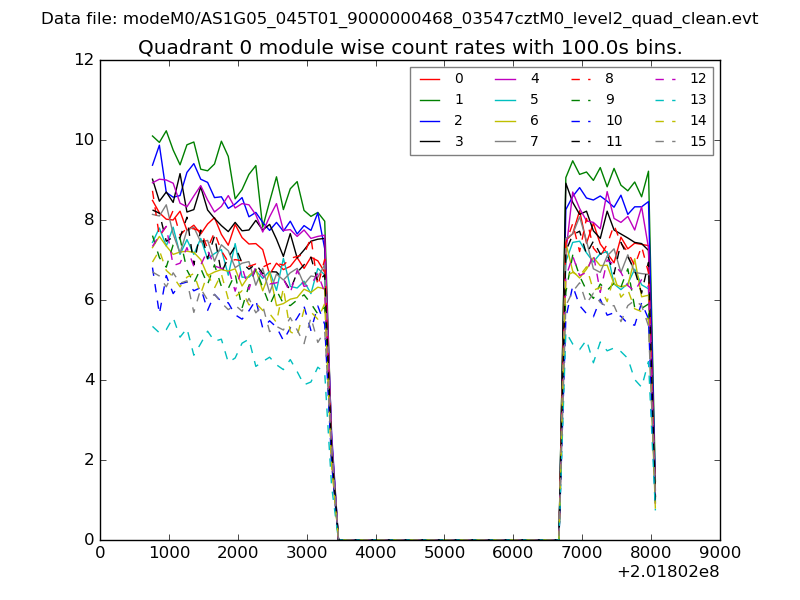 |
 |
| Module-wise count rates for Quadrant B Data is divided into 100 sec bins |
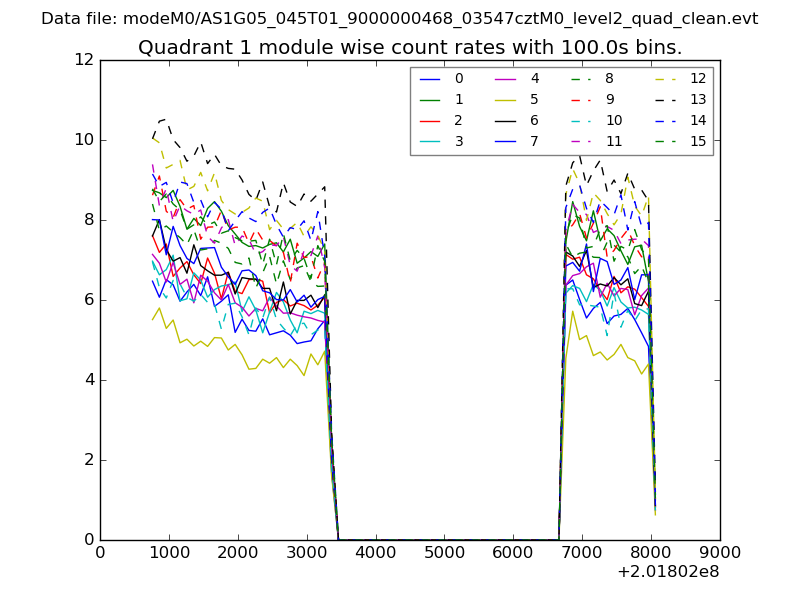 |
 |
| Module-wise count rates for Quadrant C Data is divided into 100 sec bins |
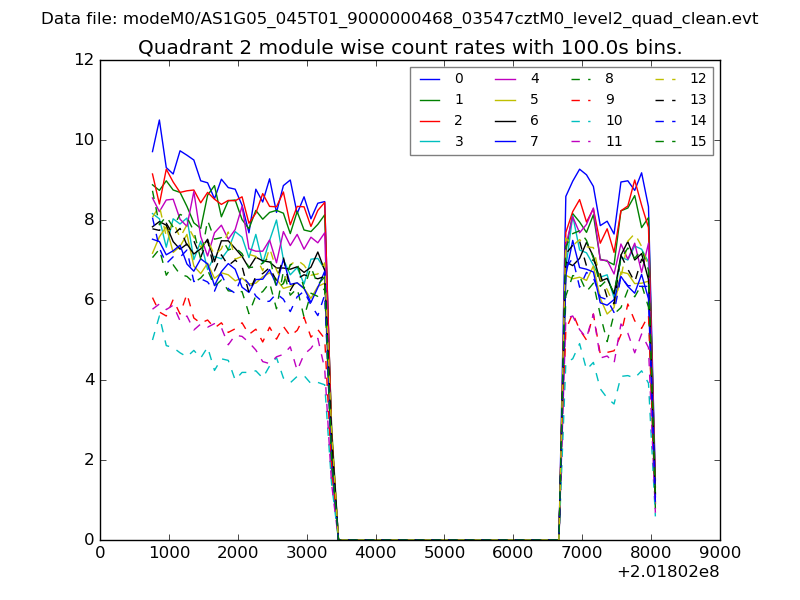 |
 |
| Module-wise count rates for Quadrant D Data is divided into 100 sec bins |
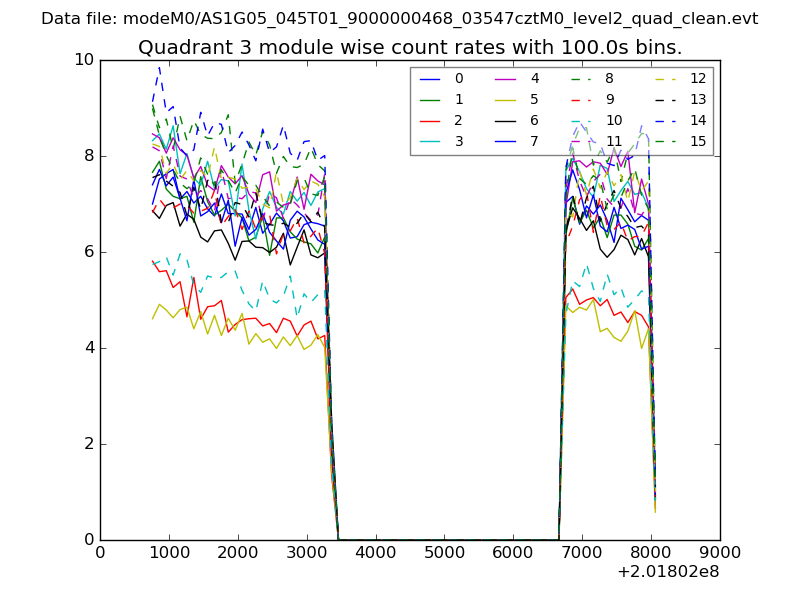 |
 |
| Parameter | Plot |
|---|---|
| CZT HV Monitor | 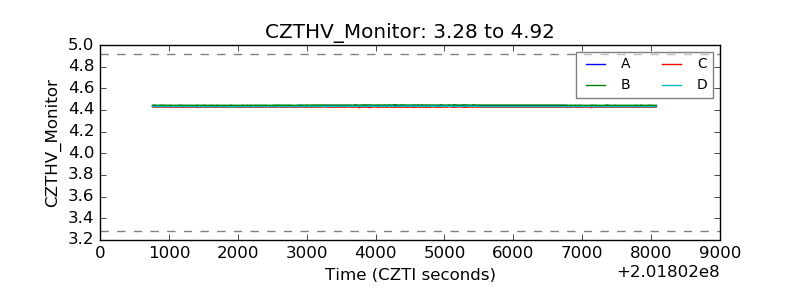 |
| D_VDD | 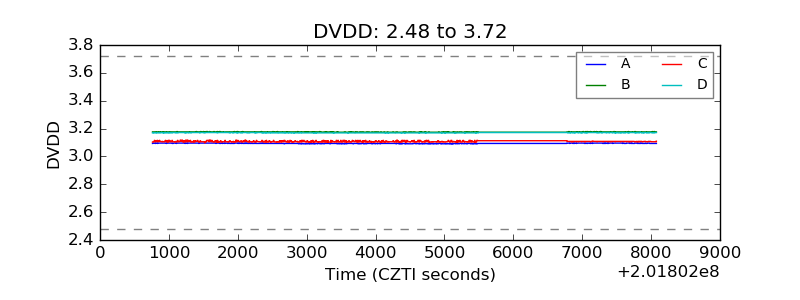 |
| Temperature 1 | 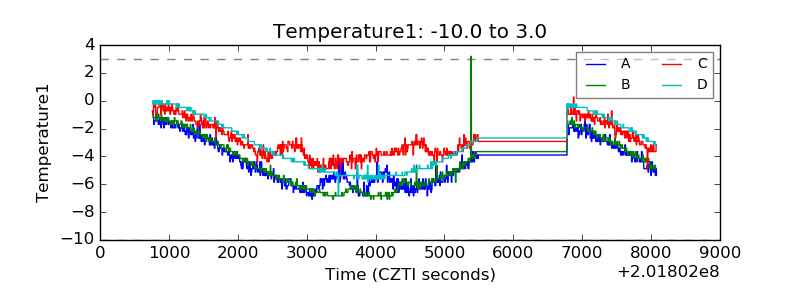 |
| Veto HV Monitor | 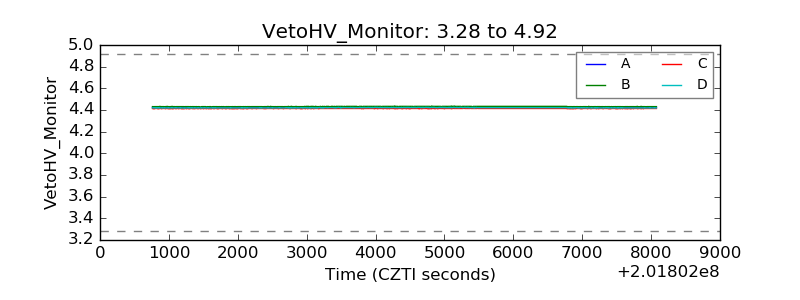 |
| Veto LLD | 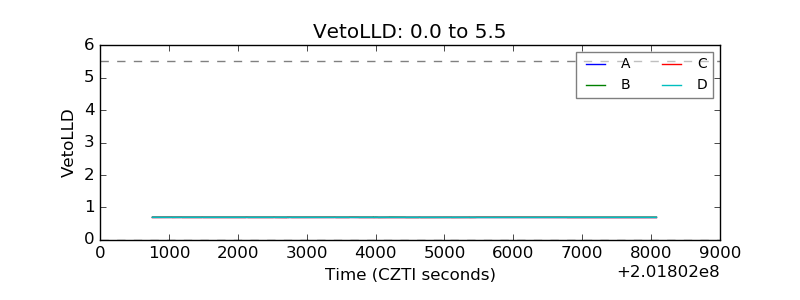 |
| Alpha Counter | 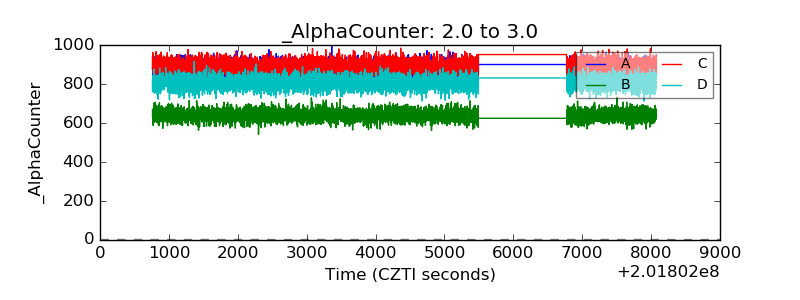 |
| _CPM_Rate | 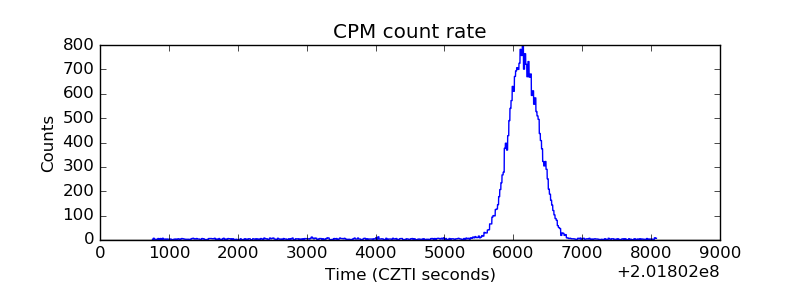 |
| CZT Counter | 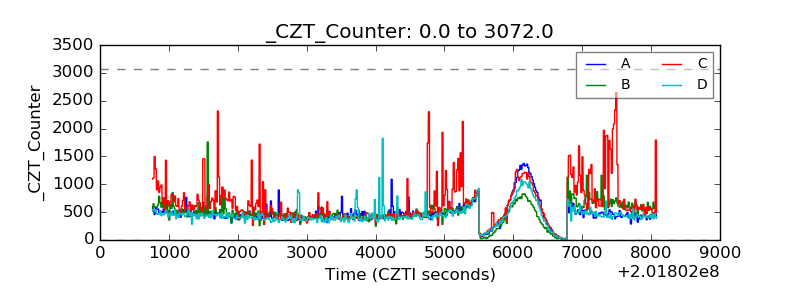 |
| +2.5 Volts monitor |  |
| +5 Volts monitor |  |
| _ROLL_ROT | 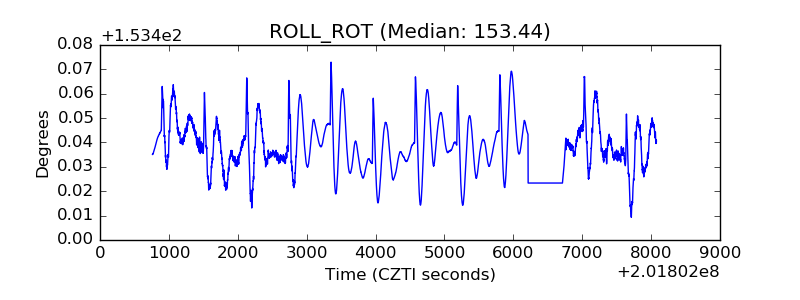 |
| _Roll_DEC | 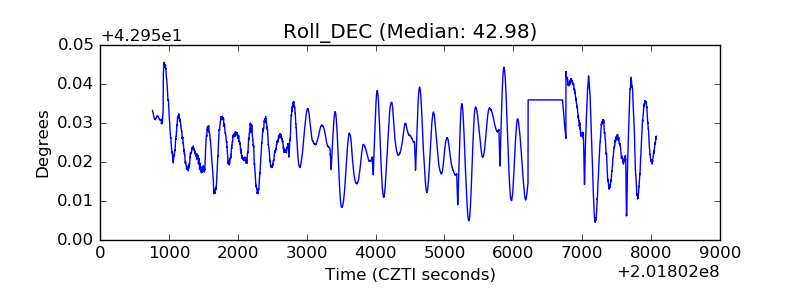 |
| _Roll_RA | 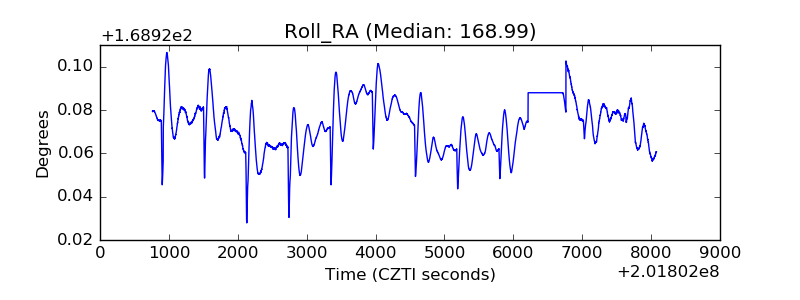 |
| Veto Counter | 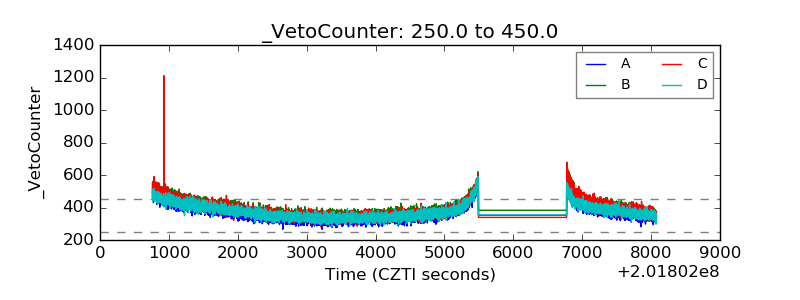 |