| Param | Original file | Final file |
|---|---|---|
| Filename | modeM0/AS1G05_045T01_9000000468_03548cztM0_level2.evt | modeM0/AS1G05_045T01_9000000468_03548cztM0_level2_quad_clean.evt |
| Size (bytes) | 447,281,280 | 77,008,320 |
| Size | 426.6 MB | 73.4 MB |
| Events in quadrant A | 2,983,758 | 474,142 |
| Events in quadrant B | 3,466,773 | 475,133 |
| Events in quadrant C | 3,790,910 | 469,519 |
| Events in quadrant D | 2,861,760 | 458,701 |
| Mode M0 | |||
|---|---|---|---|
| Quadrant | BADHDUFLAG | Total packets | Discarded packets |
| A | 0 | 13578 | 3 |
| B | 0 | 14708 | 2 |
| C | 0 | 15875 | 2 |
| D | 0 | 13483 | 2 |
| Mode M9 | |||
|---|---|---|---|
| Quadrant | BADHDUFLAG | Total packets | Discarded packets |
| A | 0 | 10 | 0 |
| B | 0 | 10 | 0 |
| C | 0 | 10 | 0 |
| D | 0 | 10 | 0 |
| Mode SS | |||
|---|---|---|---|
| Quadrant | BADHDUFLAG | Total packets | Discarded packets |
| A | 0 | 134 | 0 |
| B | 0 | 134 | 0 |
| C | 0 | 134 | 0 |
| D | 0 | 134 | 0 |
| Quadrant | Total seconds | Saturated seconds | Saturation percentage |
|---|---|---|---|
| A | 6508 | 21 | 0.322680% |
| B | 6508 | 43 | 0.660725% |
| C | 6508 | 144 | 2.212661% |
| D | 6509 | 30 | 0.460900% |
Noise dominated data is calculated using 1-second bins in cleaned event files. If a bin has >2000 counts, and if more than 50% of those come from <1% of pixels, then it is considered to be noise-dominated and hence unusable.
| Quadrant | # 1 sec bins | Bins with >0 counts | Bins with >2000 counts | High rate bins dominated by noise | Noise dominated (total time) | Noise dominated (detector-on time) | Marked lightcurve |
|---|---|---|---|---|---|---|---|
| A | 7568 | 6509 | 5 | 5 | 0.07% | 0.08% |  |
| B | 7568 | 6509 | 4 | 4 | 0.05% | 0.06% | 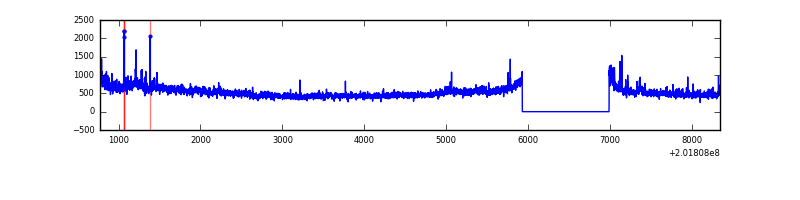 |
| C | 7568 | 6509 | 115 | 115 | 1.52% | 1.77% | 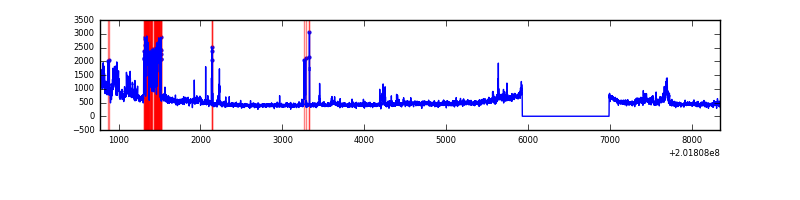 |
| D | 7569 | 6510 | 11 | 11 | 0.15% | 0.17% |  |
Top three noisy pixels from each quadrant. If the there are fewer than three noisy pixels in the level2.evt file, extra rows are filled as -1
| Pixel properties | Quadrant properties | ||||||
|---|---|---|---|---|---|---|---|
| Quadrant | DetID | PixID | Counts | Sigma | Mean | Median | Sigma |
| A | 0 | 118 | 75734 | 496.9 | 739 | 724 | 151.0 |
| A | 3 | 1 | 24829 | 159.68 | 739 | 724 | 151.0 |
| A | 0 | 50 | 23679 | 152.06 | 739 | 724 | 151.0 |
| B | 14 | 167 | 273823 | 1880.07 | 752 | 733 | 145.3 |
| B | 15 | 204 | 197382 | 1353.82 | 752 | 733 | 145.3 |
| B | 0 | 229 | 20957 | 139.23 | 752 | 733 | 145.3 |
| C | 1 | 192 | 573780 | 3362.6 | 727 | 730 | 170.4 |
| C | 4 | 248 | 353202 | 2068.27 | 727 | 730 | 170.4 |
| C | 1 | 16 | 15926 | 89.17 | 727 | 730 | 170.4 |
| D | 13 | 46 | 27428 | 153.51 | 722 | 700 | 174.1 |
| D | 8 | 195 | 24572 | 137.11 | 722 | 700 | 174.1 |
| D | 13 | 223 | 19583 | 108.45 | 722 | 700 | 174.1 |
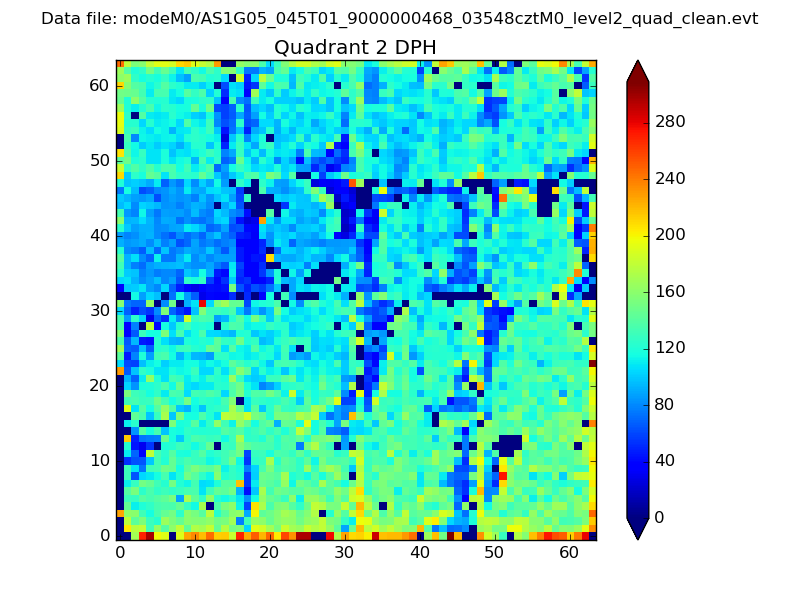
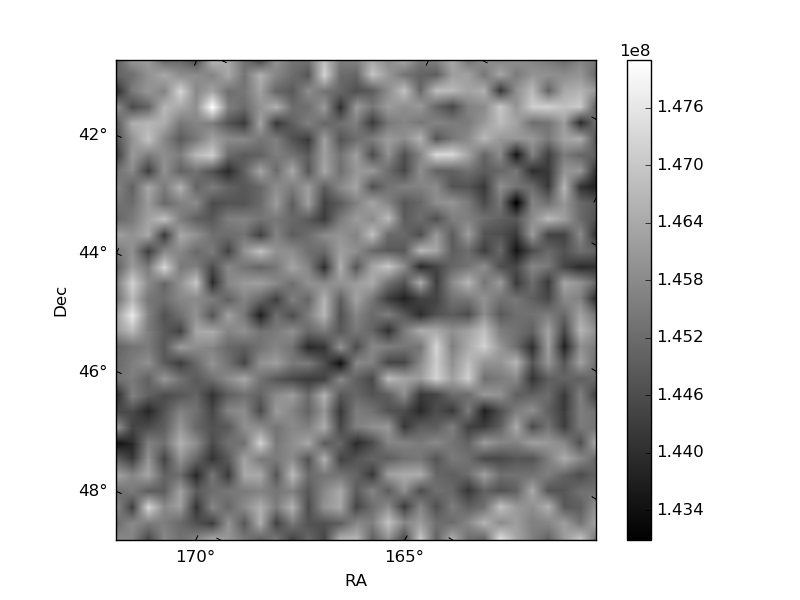
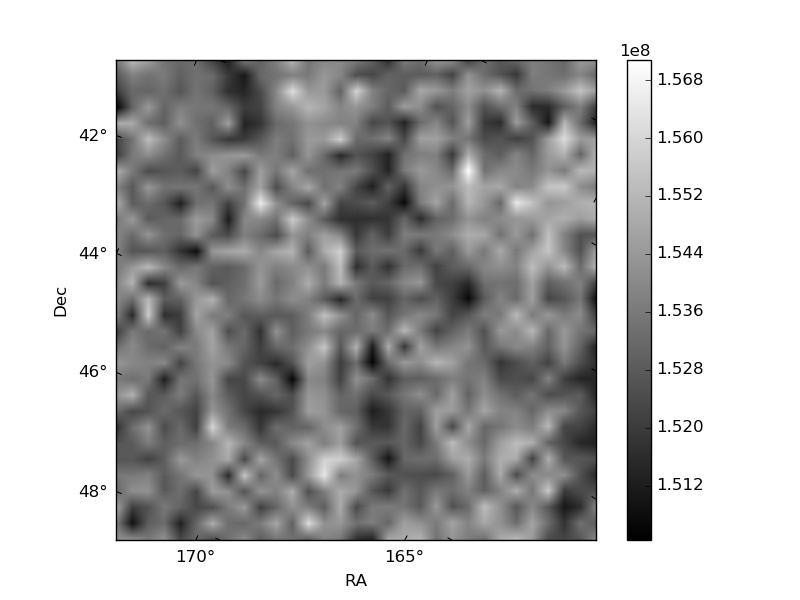
Histogram calculated using DETX and DETY for each event in the final _common_clean file
| Quadrant A | 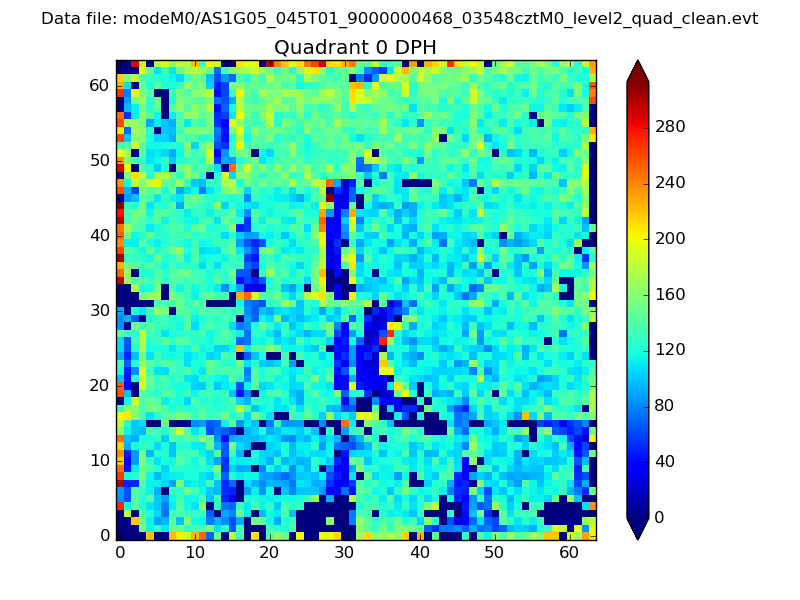 |
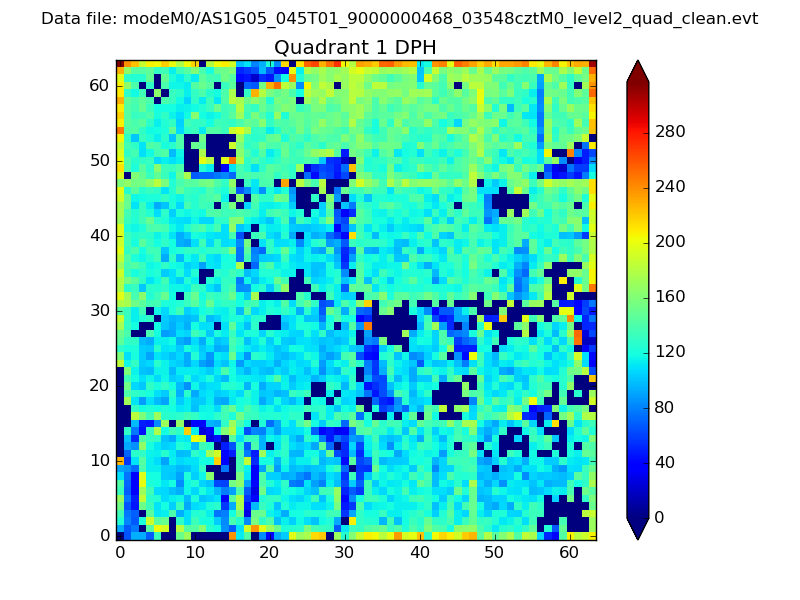 |
Quadrant B |
|---|---|---|---|
| Quadrant D | 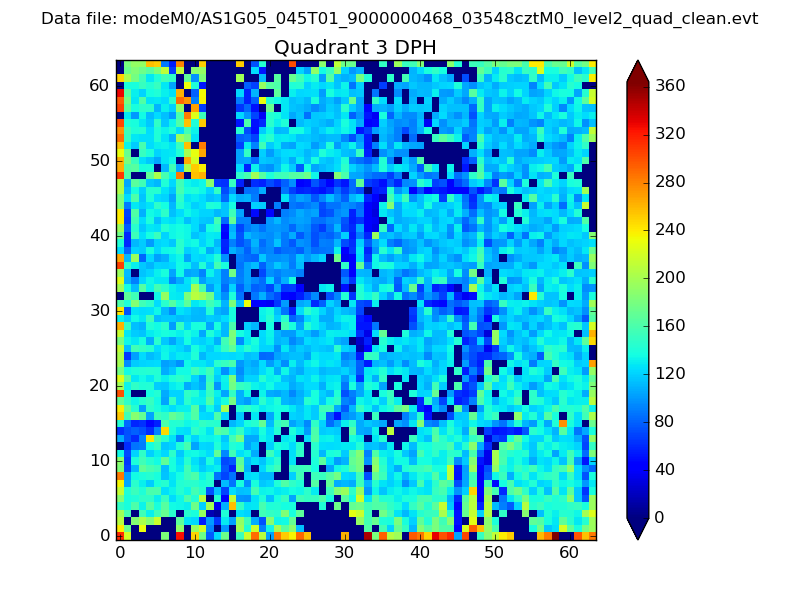 |
 |
Quadrant C |
| Plot type | Count rate plots | Images |
|---|---|---|
| Comparison with Poisson distribution Blue bars denote a histogram of data divided into 1 sec bins. Red curve is a Poisson curve with rate = median count rate of data. |
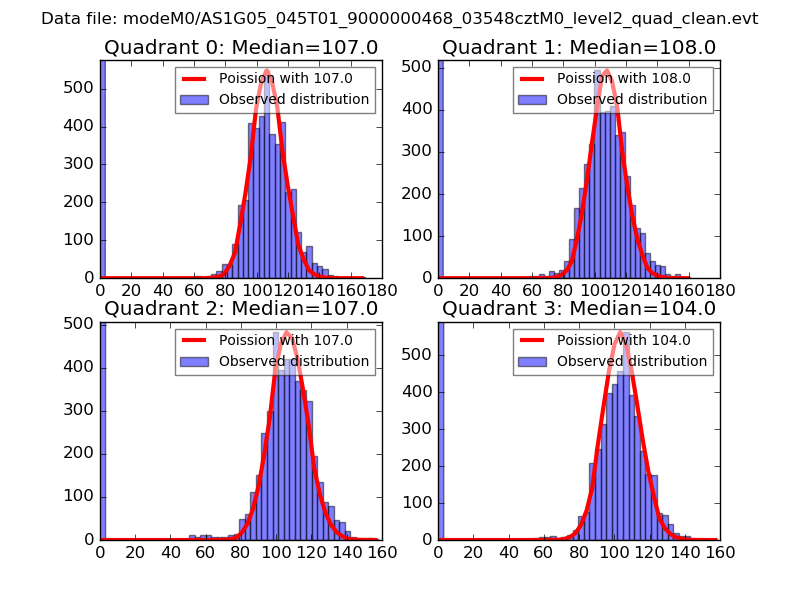 |
 |
| Quadrant-wise count rates Data is divided into 100 sec bins |
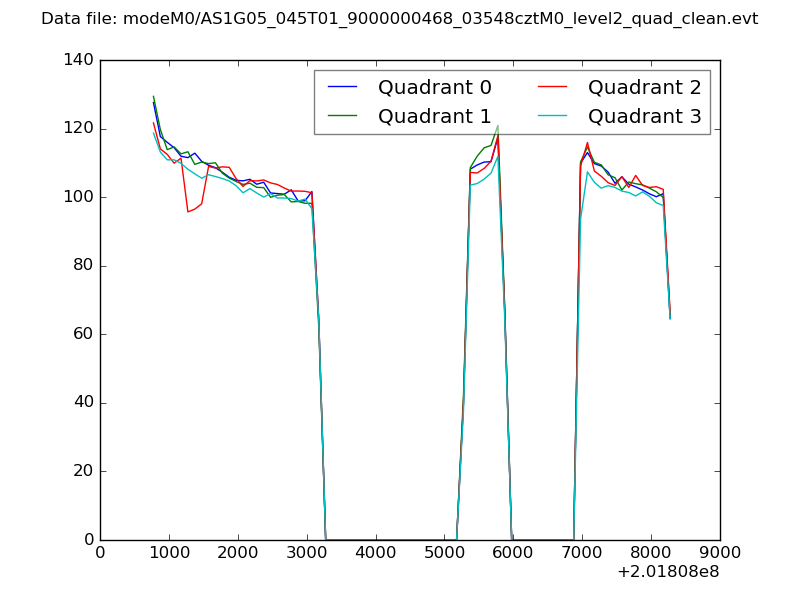 |
|
| Module-wise count rates for Quadrant A Data is divided into 100 sec bins |
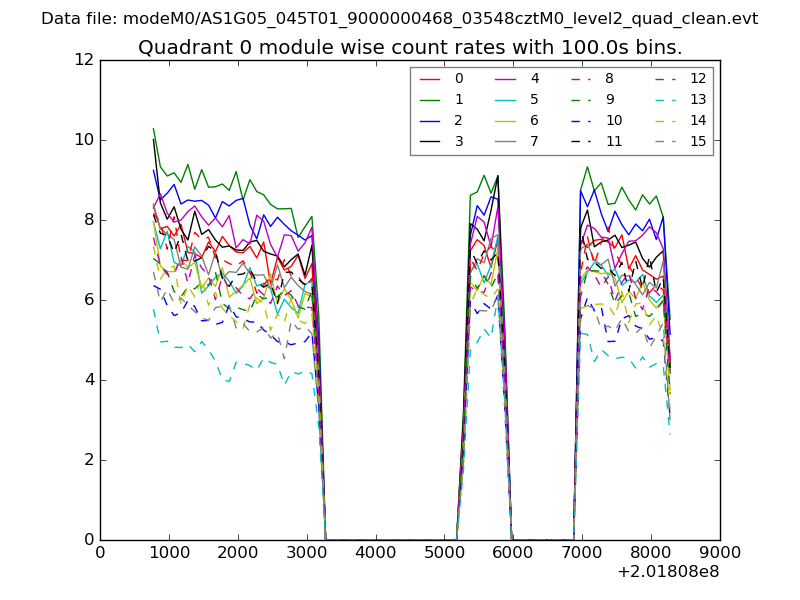 |
 |
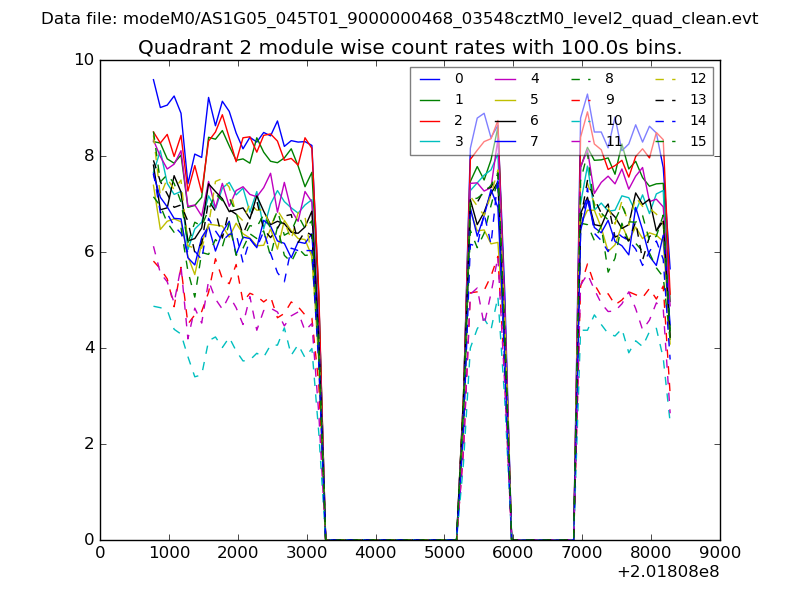
| Module-wise count rates for Quadrant B Data is divided into 100 sec bins |
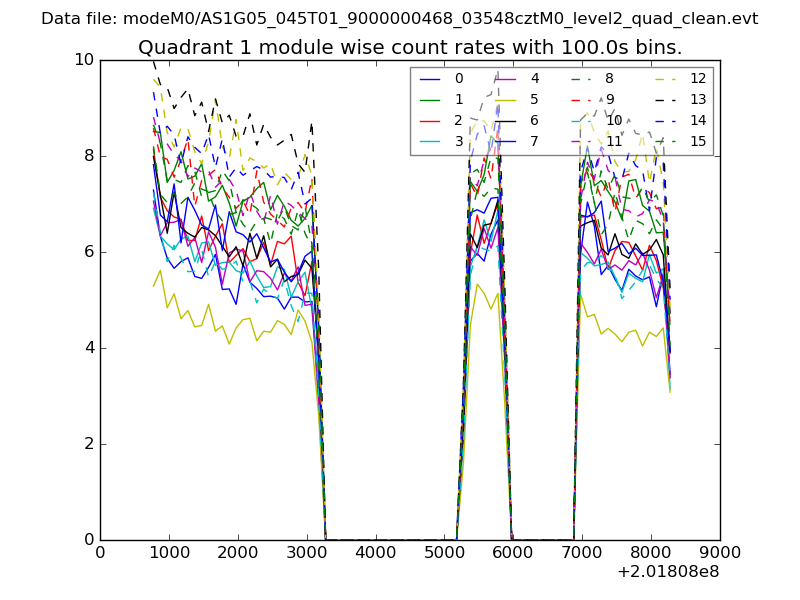 |
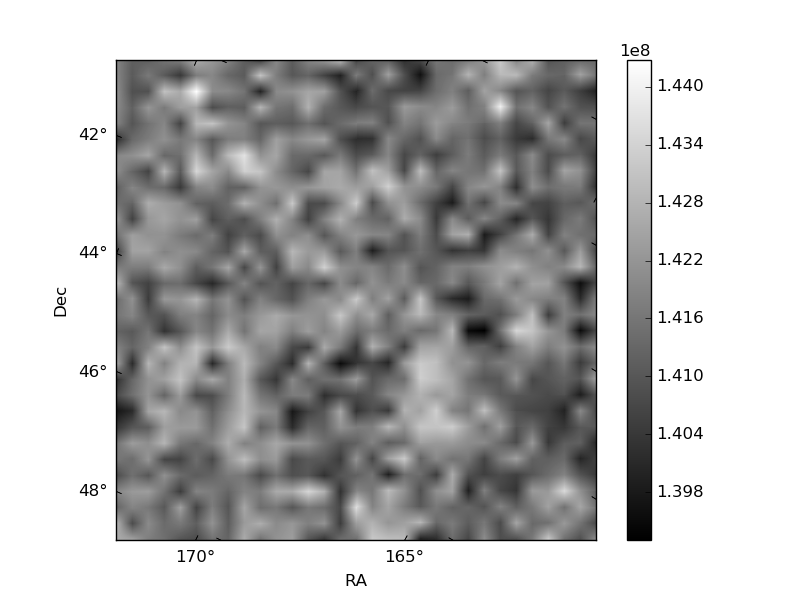 |
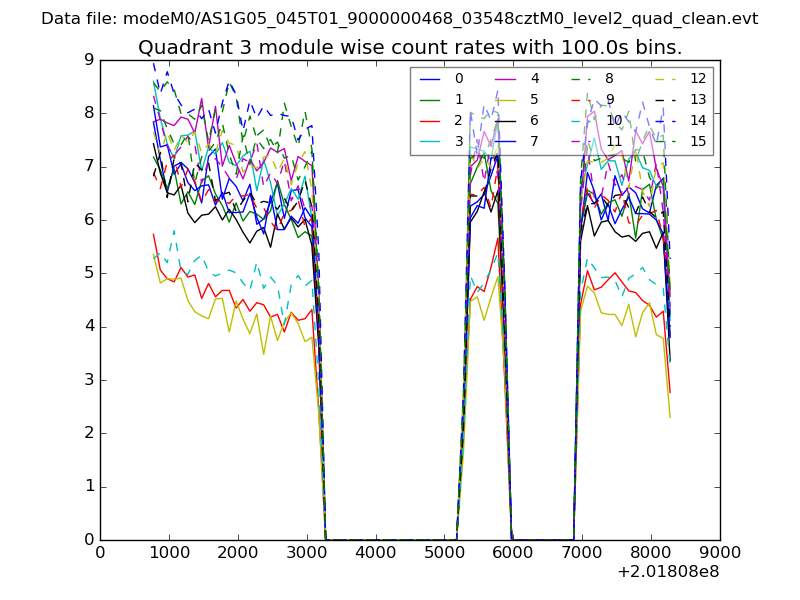
| Module-wise count rates for Quadrant C Data is divided into 100 sec bins |
 |
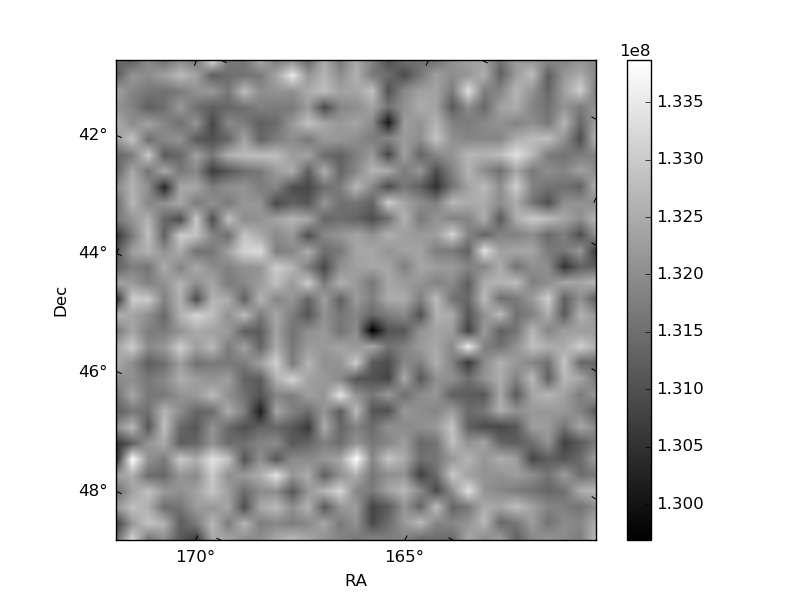 |
| Module-wise count rates for Quadrant D Data is divided into 100 sec bins |
 |
 |
| Parameter | Plot |
|---|---|
| CZT HV Monitor | 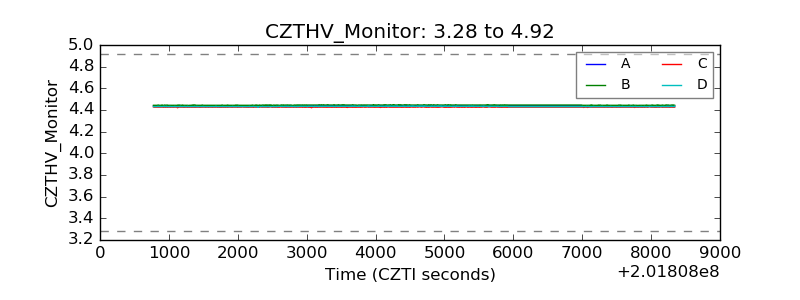 |
| D_VDD | 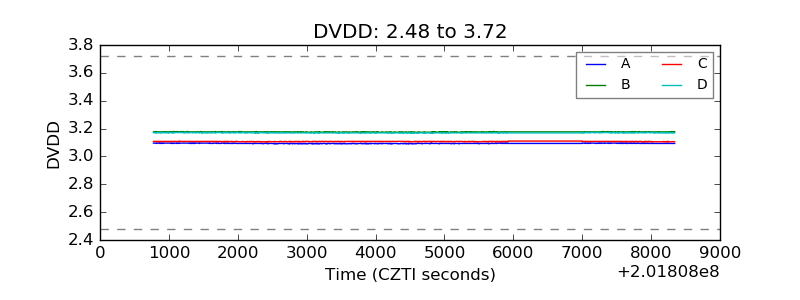 |
| Temperature 1 | 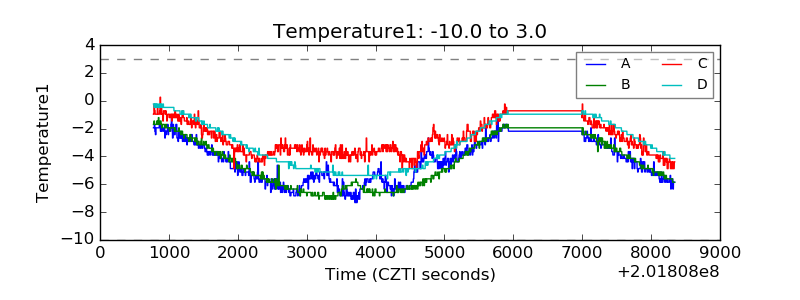 |
| Veto HV Monitor | 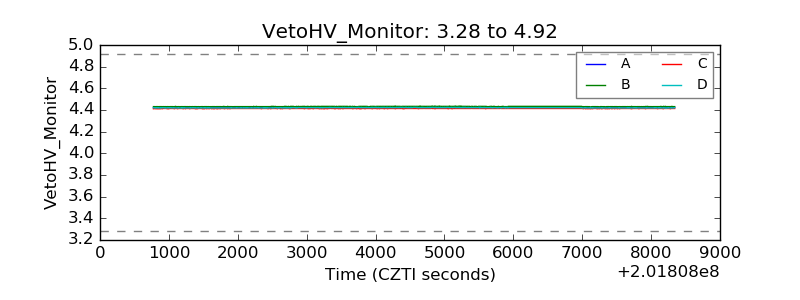 |
| Veto LLD | 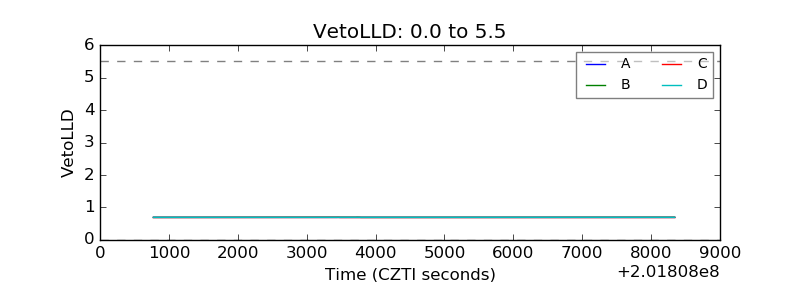 |
| Alpha Counter | 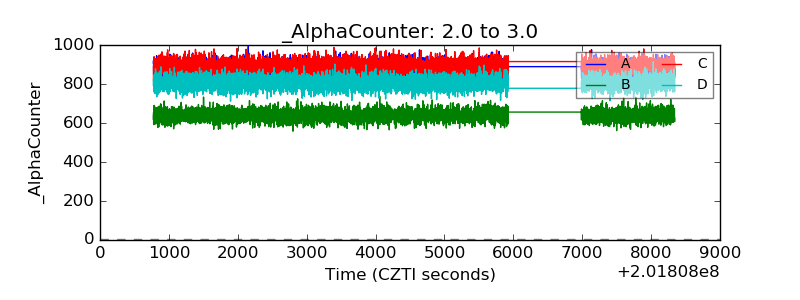 |
| _CPM_Rate | 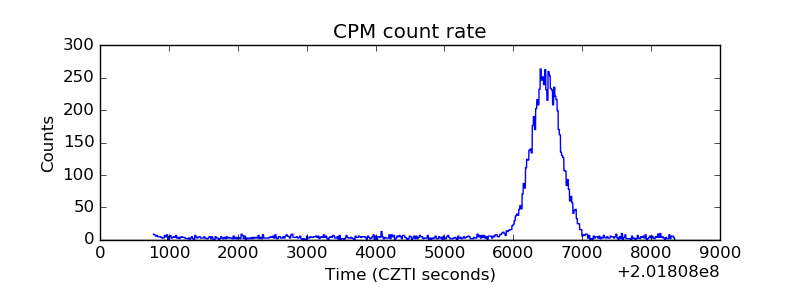 |
| CZT Counter | 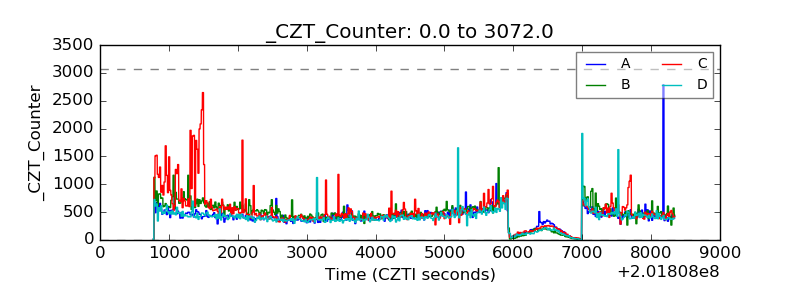 |
| +2.5 Volts monitor | 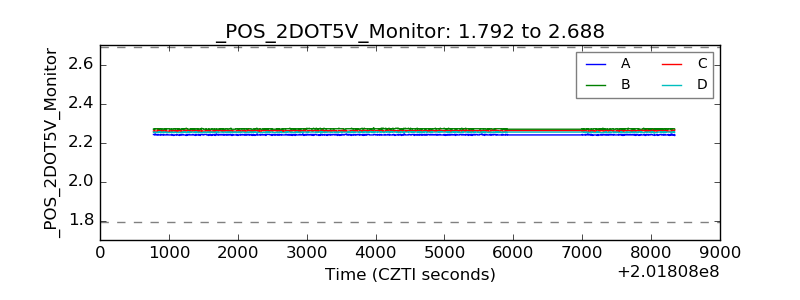 |
| +5 Volts monitor |  |
| _ROLL_ROT | 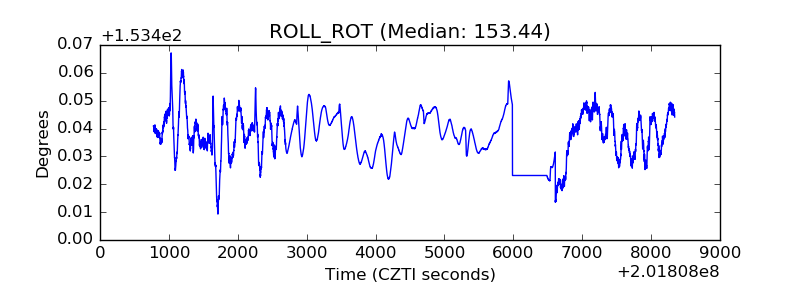 |
| _Roll_DEC | 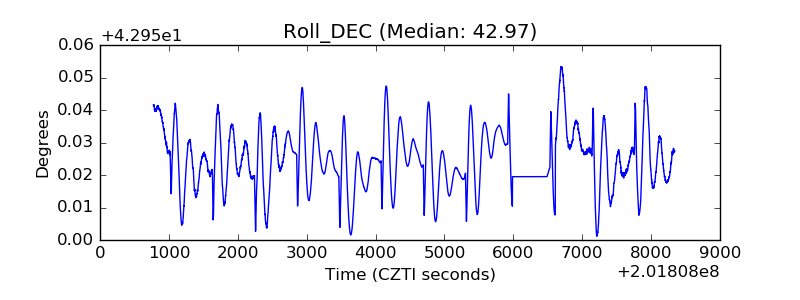 |
| _Roll_RA | 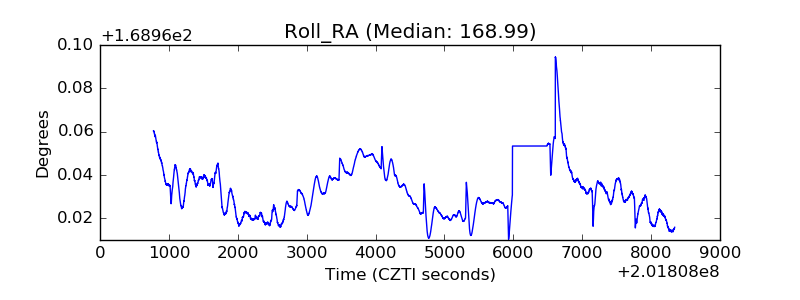 |
| Veto Counter | 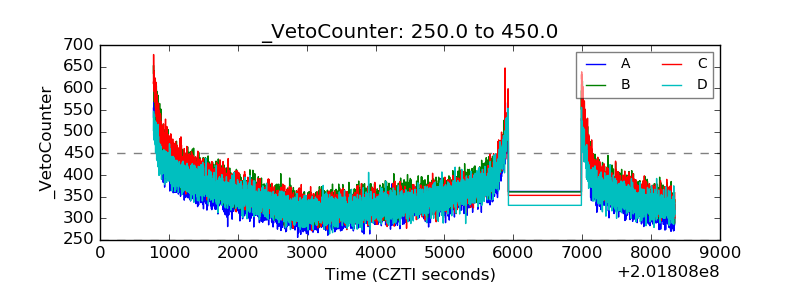 |