| Param | Original file | Final file |
|---|---|---|
| Filename | modeM0/AS1G05_045T01_9000000468_03549cztM0_level2.evt | modeM0/AS1G05_045T01_9000000468_03549cztM0_level2_quad_clean.evt |
| Size (bytes) | 549,780,480 | 83,813,760 |
| Size | 524.3 MB | 79.9 MB |
| Events in quadrant A | 3,237,785 | 519,769 |
| Events in quadrant B | 3,618,715 | 519,381 |
| Events in quadrant C | 6,160,499 | 500,897 |
| Events in quadrant D | 3,152,343 | 503,904 |
| Mode M0 | |||
|---|---|---|---|
| Quadrant | BADHDUFLAG | Total packets | Discarded packets |
| A | 0 | 14776 | 3 |
| B | 0 | 15635 | 2 |
| C | 0 | 23308 | 2 |
| D | 0 | 14844 | 2 |
| Mode M9 | |||
|---|---|---|---|
| Quadrant | BADHDUFLAG | Total packets | Discarded packets |
| A | 0 | 10 | 0 |
| B | 0 | 10 | 0 |
| C | 0 | 10 | 0 |
| D | 0 | 11 | 0 |
| Mode SS | |||
|---|---|---|---|
| Quadrant | BADHDUFLAG | Total packets | Discarded packets |
| A | 0 | 146 | 0 |
| B | 0 | 146 | 0 |
| C | 0 | 146 | 0 |
| D | 0 | 146 | 0 |
| Quadrant | Total seconds | Saturated seconds | Saturation percentage |
|---|---|---|---|
| A | 7084 | 29 | 0.409373% |
| B | 7084 | 56 | 0.790514% |
| C | 7084 | 390 | 5.505364% |
| D | 7084 | 40 | 0.564653% |
Noise dominated data is calculated using 1-second bins in cleaned event files. If a bin has >2000 counts, and if more than 50% of those come from <1% of pixels, then it is considered to be noise-dominated and hence unusable.
| Quadrant | # 1 sec bins | Bins with >0 counts | Bins with >2000 counts | High rate bins dominated by noise | Noise dominated (total time) | Noise dominated (detector-on time) | Marked lightcurve |
|---|---|---|---|---|---|---|---|
| A | 7739 | 7085 | 6 | 6 | 0.08% | 0.08% |  |
| B | 7739 | 7085 | 1 | 1 | 0.01% | 0.01% |  |
| C | 7739 | 7085 | 283 | 283 | 3.66% | 3.99% |  |
| D | 7739 | 7085 | 27 | 27 | 0.35% | 0.38% | 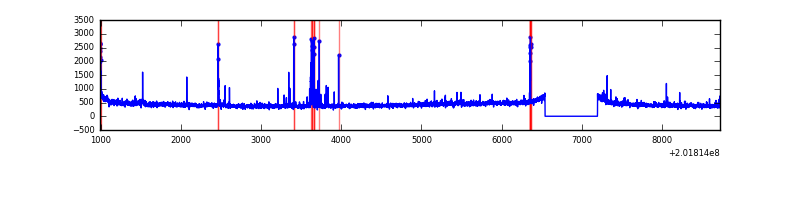 |
Top three noisy pixels from each quadrant. If the there are fewer than three noisy pixels in the level2.evt file, extra rows are filled as -1
| Pixel properties | Quadrant properties | ||||||
|---|---|---|---|---|---|---|---|
| Quadrant | DetID | PixID | Counts | Sigma | Mean | Median | Sigma |
| A | 0 | 118 | 72467 | 443.56 | 793 | 775 | 161.6 |
| A | 0 | 50 | 45438 | 276.33 | 793 | 775 | 161.6 |
| A | 3 | 1 | 42274 | 256.76 | 793 | 775 | 161.6 |
| B | 15 | 204 | 234827 | 1501.05 | 806 | 784 | 155.9 |
| B | 14 | 167 | 124607 | 794.15 | 806 | 784 | 155.9 |
| B | 0 | 228 | 24629 | 152.93 | 806 | 784 | 155.9 |
| C | 1 | 192 | 3114864 | 17190.74 | 770 | 772 | 181.1 |
| C | 1 | 16 | 20316 | 107.89 | 770 | 772 | 181.1 |
| C | 8 | 128 | 6716 | 32.81 | 770 | 772 | 181.1 |
| D | 13 | 239 | 70895 | 376.97 | 770 | 748 | 186.1 |
| D | 8 | 195 | 35766 | 188.19 | 770 | 748 | 186.1 |
| D | 13 | 223 | 30766 | 161.32 | 770 | 748 | 186.1 |
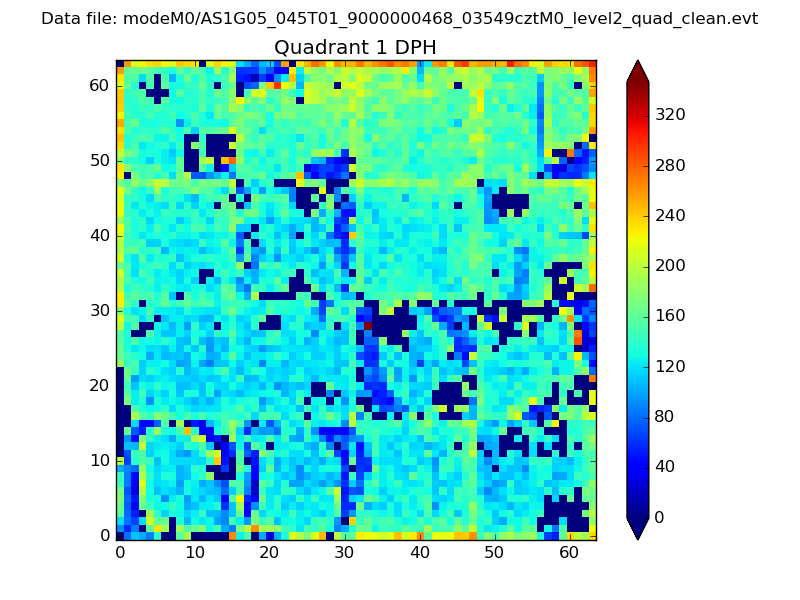
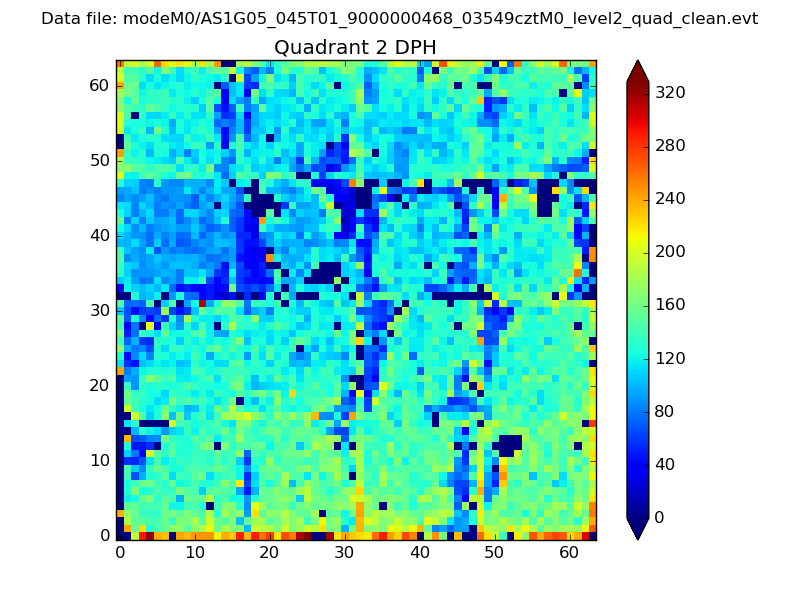
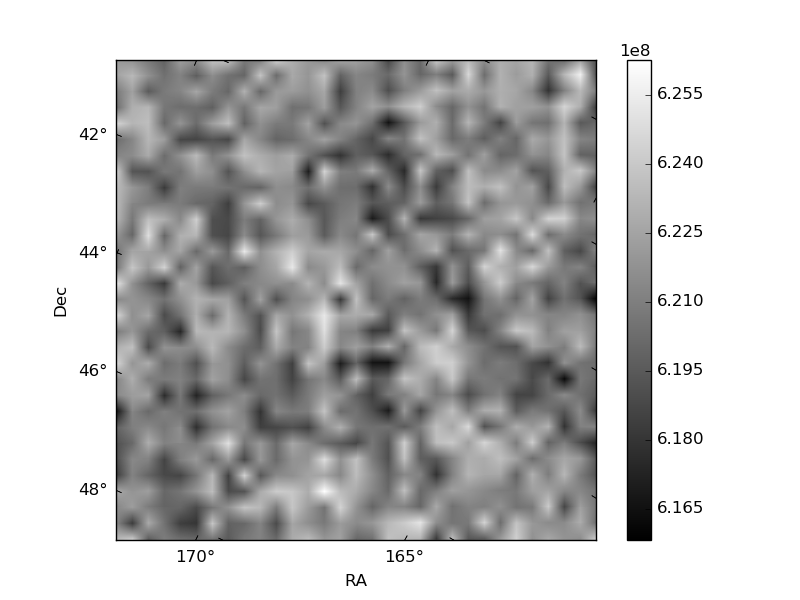
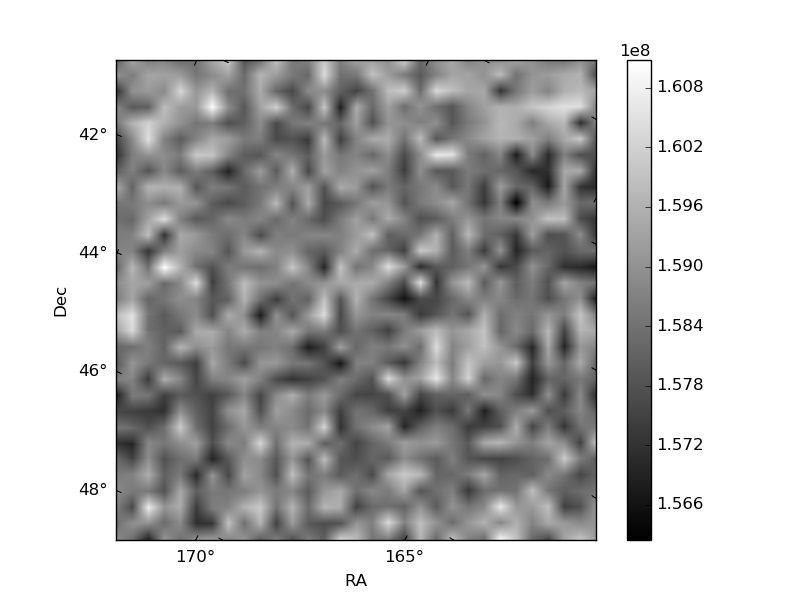
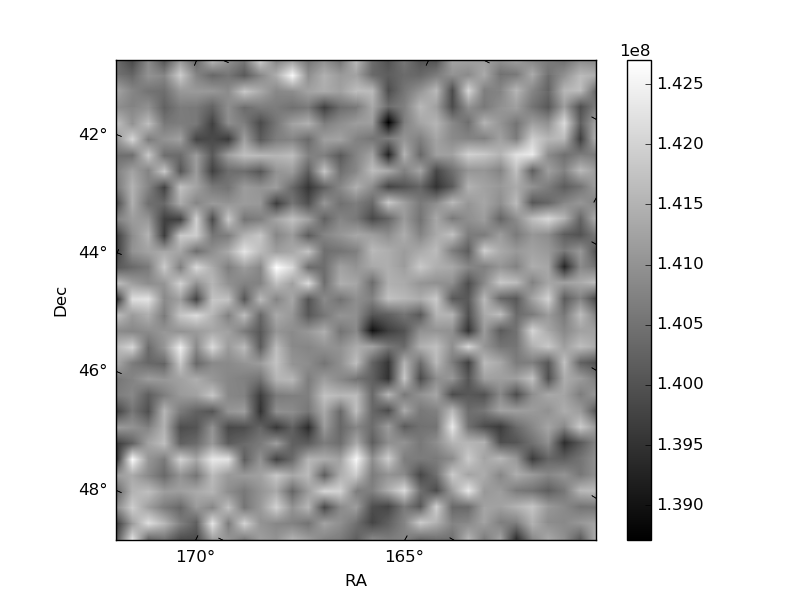
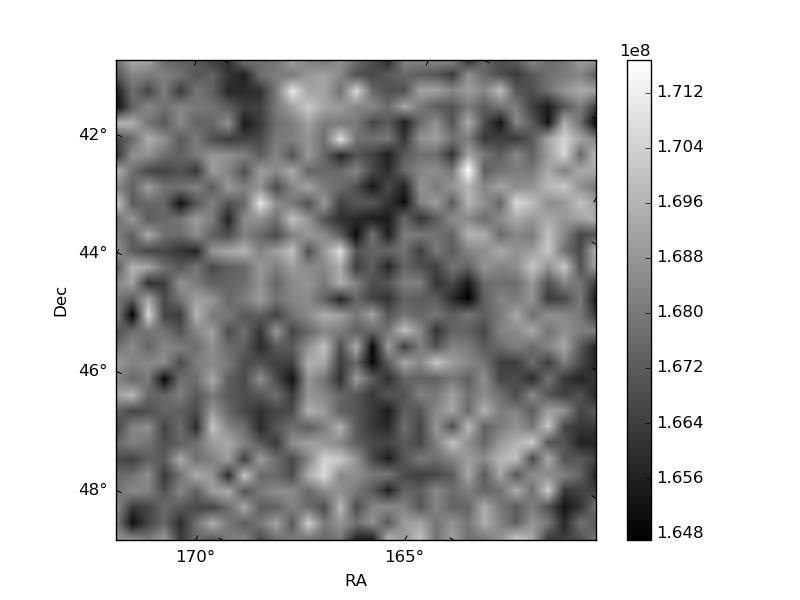
Histogram calculated using DETX and DETY for each event in the final _common_clean file
| Quadrant A |  |
 |
Quadrant B |
|---|---|---|---|
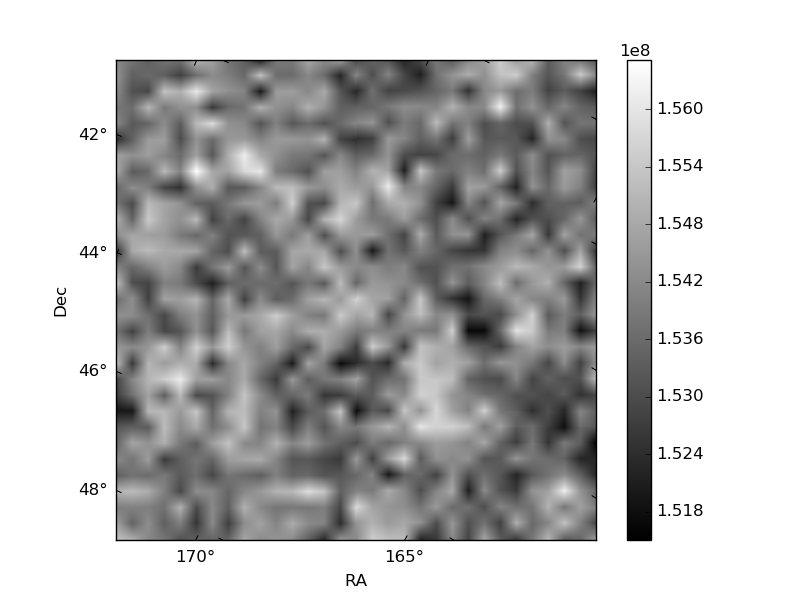
| Quadrant D | 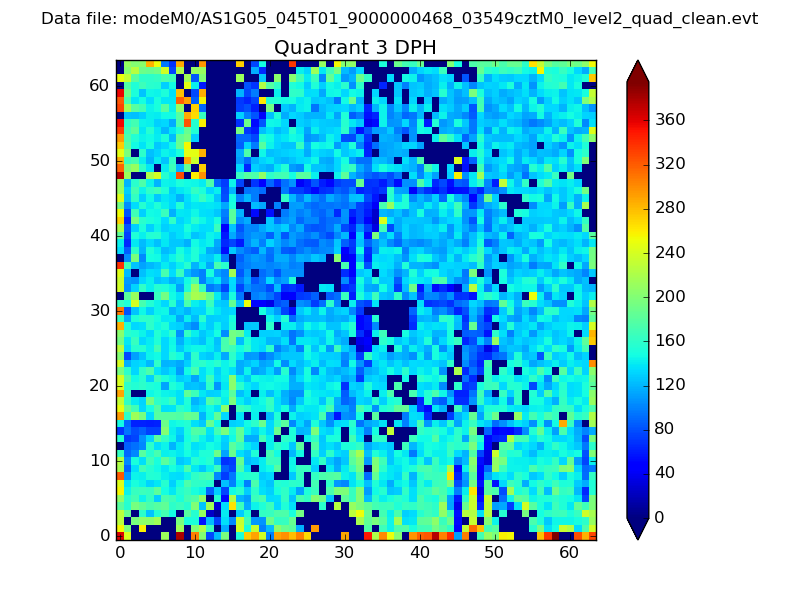 |
 |
Quadrant C |
| Plot type | Count rate plots | Images |
|---|---|---|
| Comparison with Poisson distribution Blue bars denote a histogram of data divided into 1 sec bins. Red curve is a Poisson curve with rate = median count rate of data. |
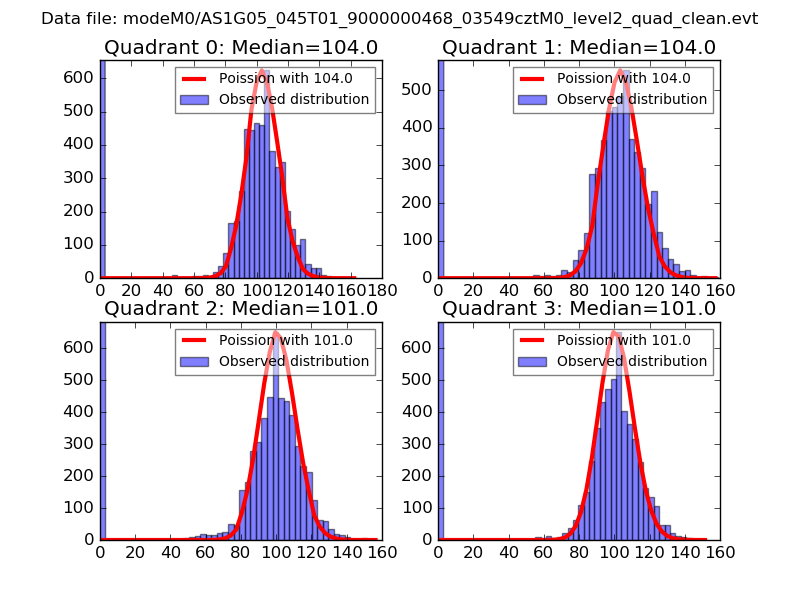 |
 |
| Quadrant-wise count rates Data is divided into 100 sec bins |
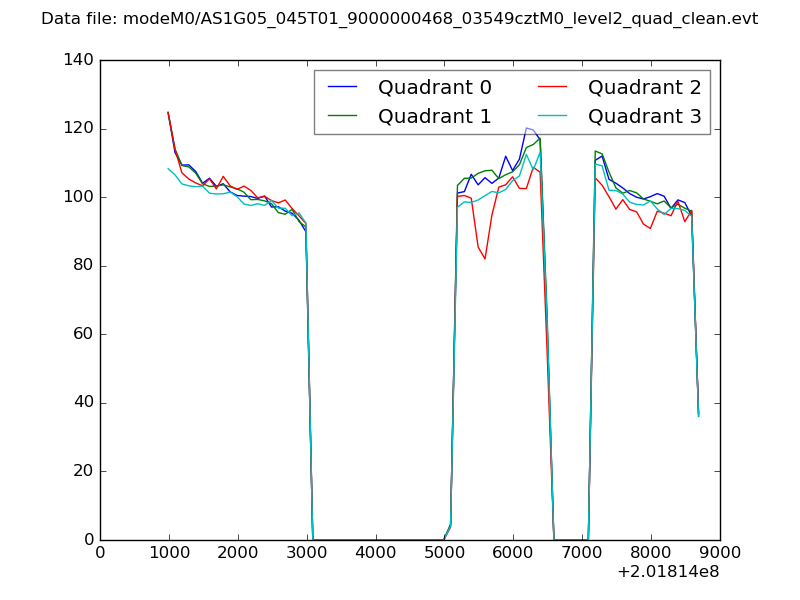 |
|
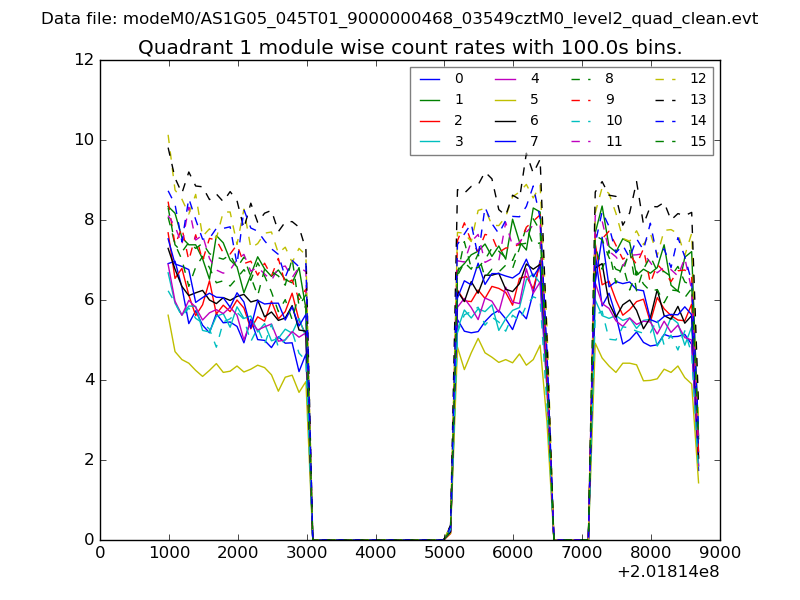
| Module-wise count rates for Quadrant A Data is divided into 100 sec bins |
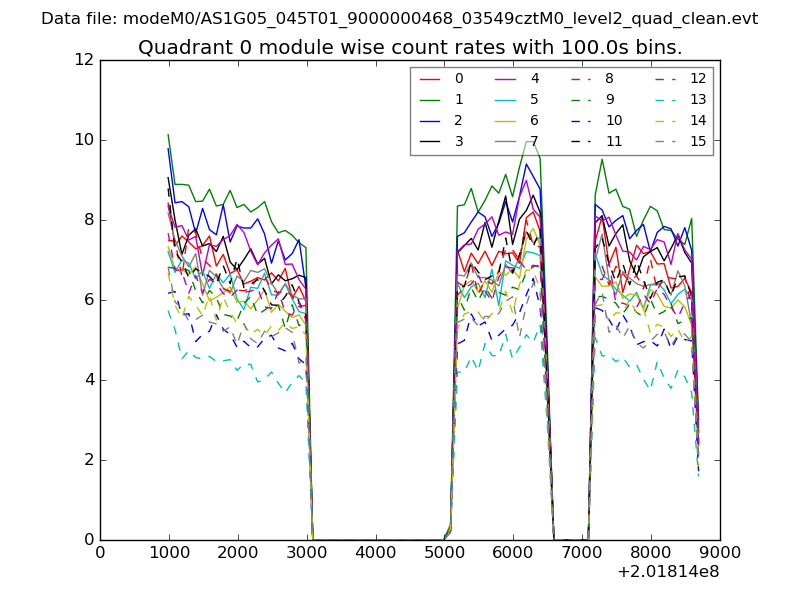 |
 |
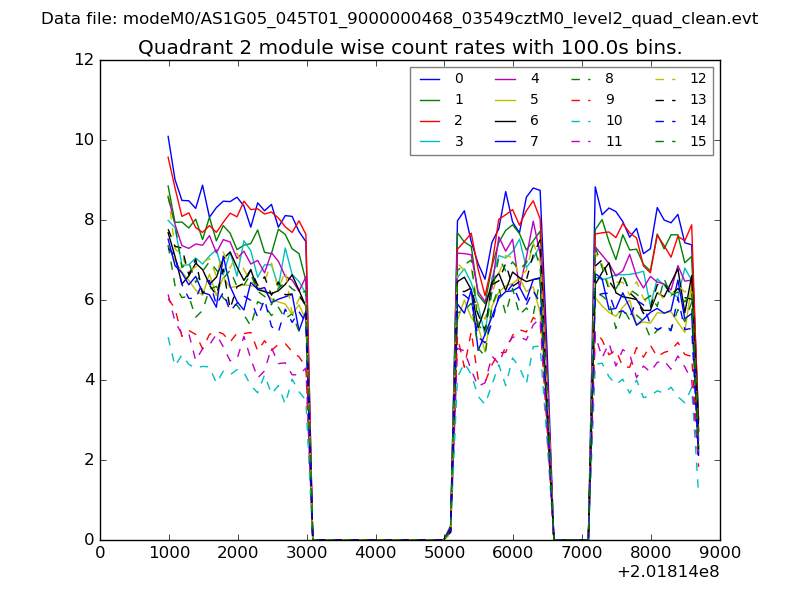
| Module-wise count rates for Quadrant B Data is divided into 100 sec bins |
 |
 |
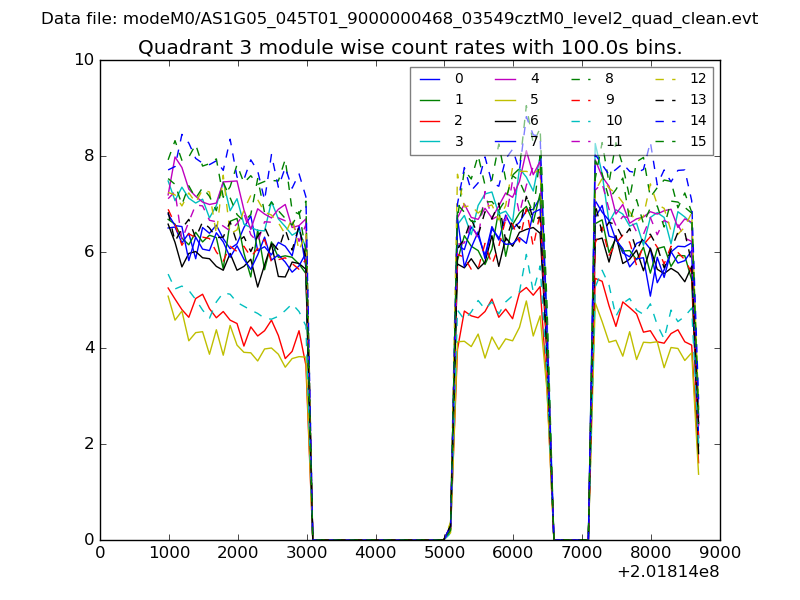
| Module-wise count rates for Quadrant C Data is divided into 100 sec bins |
 |
 |
| Module-wise count rates for Quadrant D Data is divided into 100 sec bins |
 |
 |
| Parameter | Plot |
|---|---|
| CZT HV Monitor | 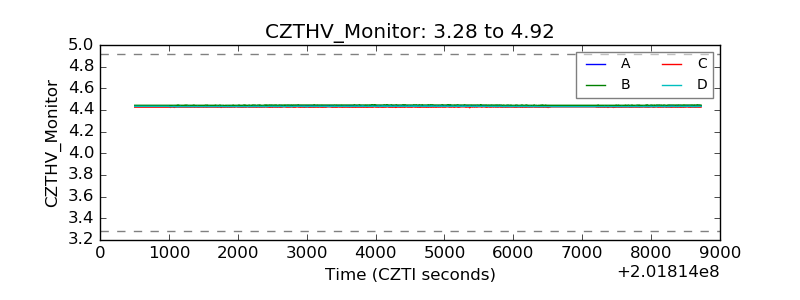 |
| D_VDD | 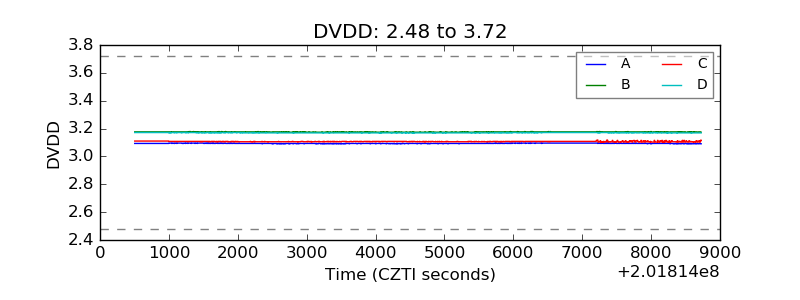 |
| Temperature 1 | 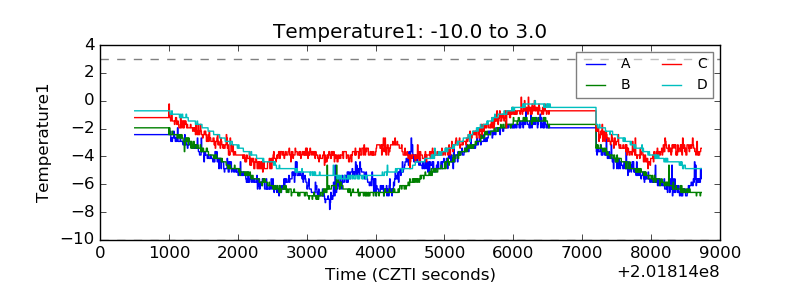 |
| Veto HV Monitor | 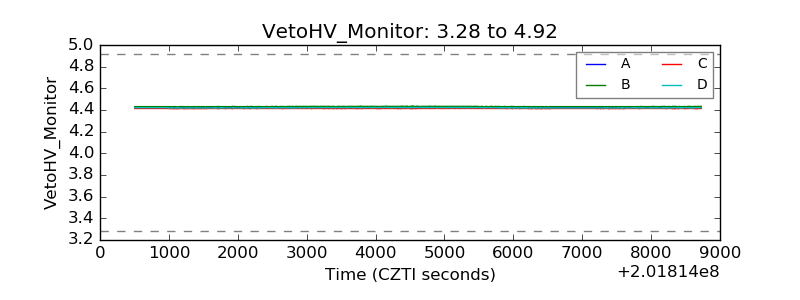 |
| Veto LLD | 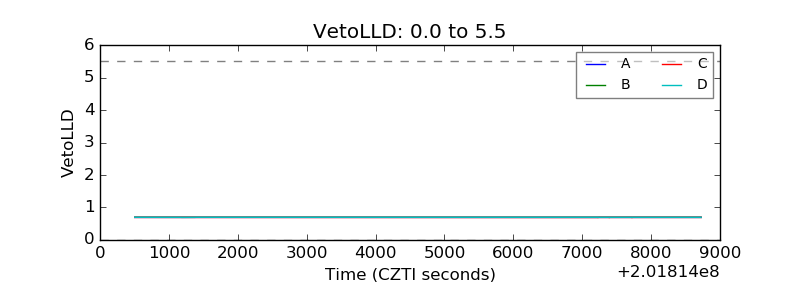 |
| Alpha Counter | 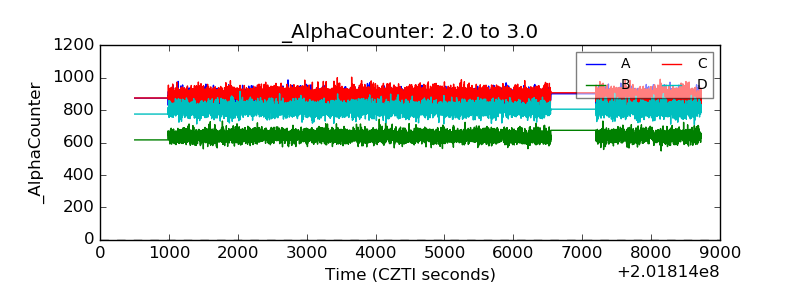 |
| _CPM_Rate | 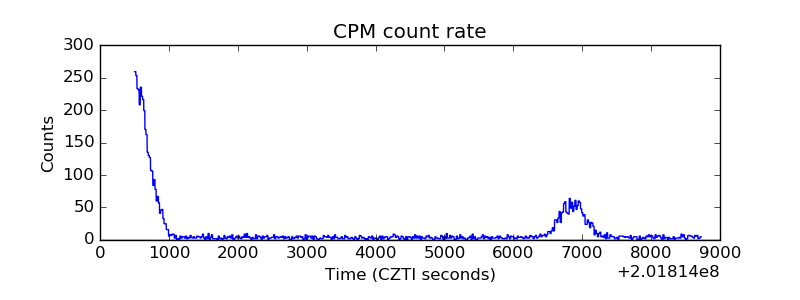 |
| CZT Counter | 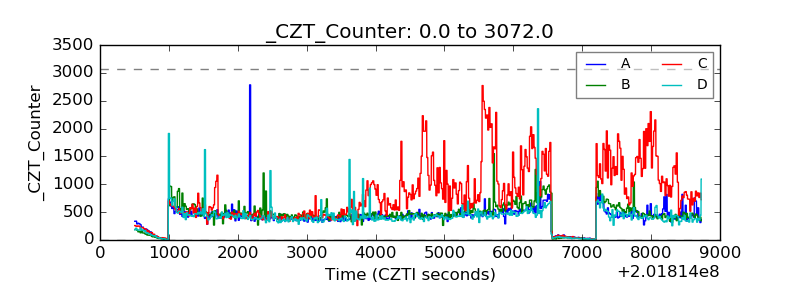 |
| +2.5 Volts monitor | 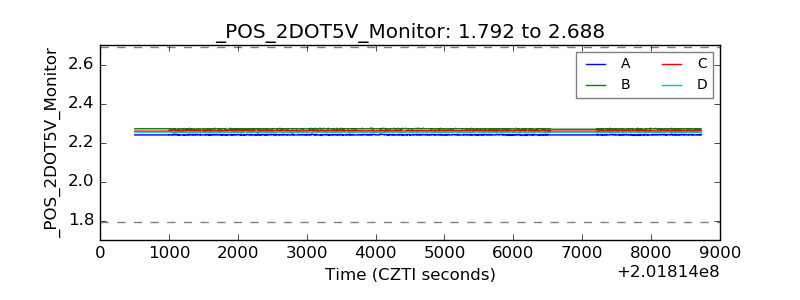 |
| +5 Volts monitor |  |
| _ROLL_ROT | 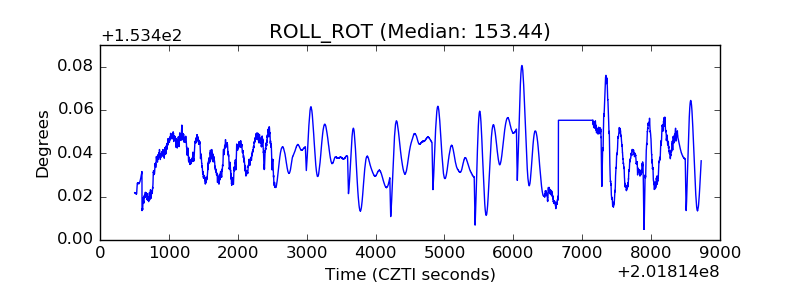 |
| _Roll_DEC | 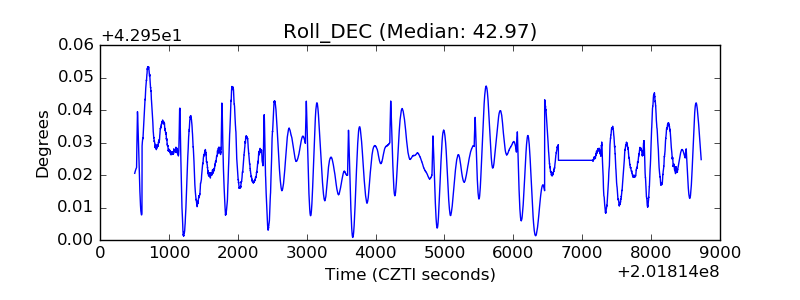 |
| _Roll_RA | 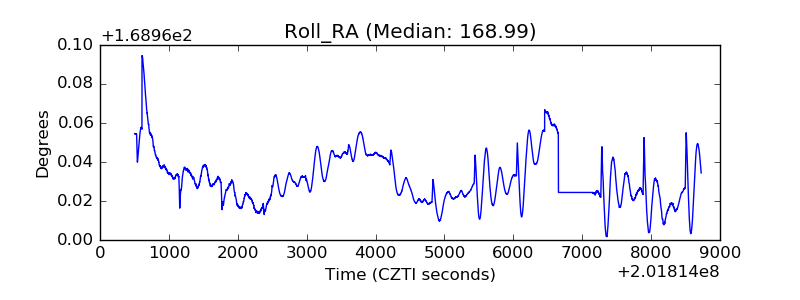 |
| Veto Counter | 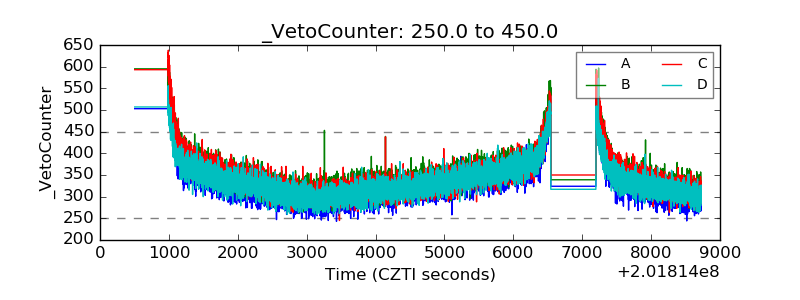 |