| Param | Original file | Final file |
|---|---|---|
| Filename | modeM0/AS1G05_045T01_9000000468_03550cztM0_level2.evt | modeM0/AS1G05_045T01_9000000468_03550cztM0_level2_quad_clean.evt |
| Size (bytes) | 592,104,960 | 88,879,680 |
| Size | 564.7 MB | 84.8 MB |
| Events in quadrant A | 3,554,899 | 548,424 |
| Events in quadrant B | 3,768,786 | 547,024 |
| Events in quadrant C | 6,768,874 | 531,204 |
| Events in quadrant D | 3,323,250 | 534,728 |
| Mode M0 | |||
|---|---|---|---|
| Quadrant | BADHDUFLAG | Total packets | Discarded packets |
| A | 0 | 16136 | 3 |
| B | 0 | 16650 | 2 |
| C | 0 | 25470 | 2 |
| D | 0 | 15869 | 2 |
| Mode M9 | |||
|---|---|---|---|
| Quadrant | BADHDUFLAG | Total packets | Discarded packets |
| A | 0 | 2 | 0 |
| B | 0 | 2 | 0 |
| C | 0 | 2 | 0 |
| D | 0 | 2 | 0 |
| Mode SS | |||
|---|---|---|---|
| Quadrant | BADHDUFLAG | Total packets | Discarded packets |
| A | 0 | 156 | 0 |
| B | 0 | 156 | 0 |
| C | 0 | 156 | 0 |
| D | 0 | 156 | 0 |
| Quadrant | Total seconds | Saturated seconds | Saturation percentage |
|---|---|---|---|
| A | 7618 | 68 | 0.892623% |
| B | 7618 | 141 | 1.850879% |
| C | 7618 | 276 | 3.622998% |
| D | 7619 | 32 | 0.420003% |
Noise dominated data is calculated using 1-second bins in cleaned event files. If a bin has >2000 counts, and if more than 50% of those come from <1% of pixels, then it is considered to be noise-dominated and hence unusable.
| Quadrant | # 1 sec bins | Bins with >0 counts | Bins with >2000 counts | High rate bins dominated by noise | Noise dominated (total time) | Noise dominated (detector-on time) | Marked lightcurve |
|---|---|---|---|---|---|---|---|
| A | 7788 | 7619 | 1 | 1 | 0.01% | 0.01% |  |
| B | 7788 | 7619 | 13 | 13 | 0.17% | 0.17% | 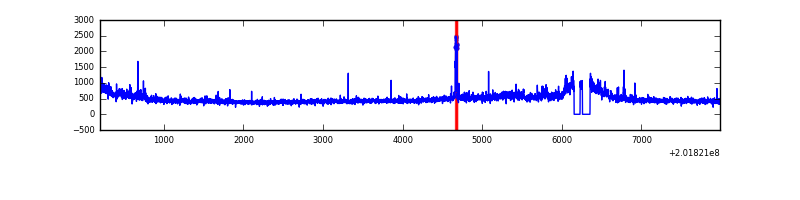 |
| C | 7788 | 7620 | 124 | 124 | 1.59% | 1.63% |  |
| D | 7789 | 7621 | 9 | 9 | 0.12% | 0.12% | 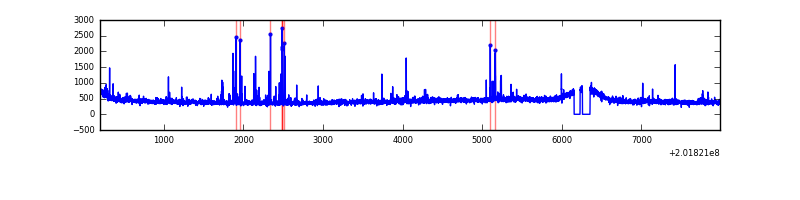 |
Top three noisy pixels from each quadrant. If the there are fewer than three noisy pixels in the level2.evt file, extra rows are filled as -1
| Pixel properties | Quadrant properties | ||||||
|---|---|---|---|---|---|---|---|
| Quadrant | DetID | PixID | Counts | Sigma | Mean | Median | Sigma |
| A | 3 | 1 | 90286 | 505.68 | 858 | 838 | 176.9 |
| A | 0 | 118 | 70286 | 392.61 | 858 | 838 | 176.9 |
| A | 0 | 50 | 53172 | 295.86 | 858 | 838 | 176.9 |
| B | 15 | 204 | 201947 | 1188.68 | 872 | 850 | 169.2 |
| B | 14 | 167 | 49216 | 285.89 | 872 | 850 | 169.2 |
| B | 15 | 54 | 47186 | 273.89 | 872 | 850 | 169.2 |
| C | 1 | 192 | 3337537 | 17101.12 | 837 | 839 | 195.1 |
| C | 1 | 16 | 117119 | 595.95 | 837 | 839 | 195.1 |
| C | 8 | 128 | 19517 | 95.73 | 837 | 839 | 195.1 |
| D | 13 | 223 | 52072 | 251.11 | 839 | 812 | 204.1 |
| D | 13 | 239 | 34902 | 167.0 | 839 | 812 | 204.1 |
| D | 2 | 206 | 21467 | 101.18 | 839 | 812 | 204.1 |
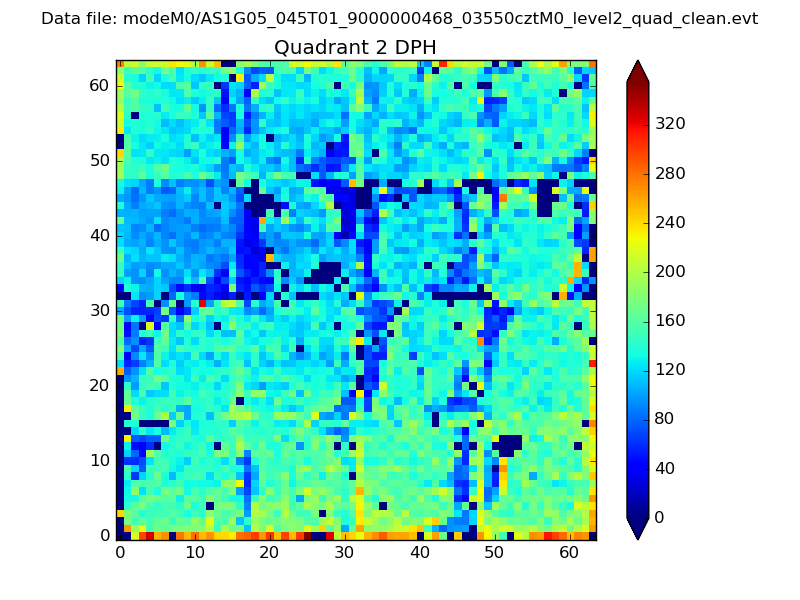
Histogram calculated using DETX and DETY for each event in the final _common_clean file
| Quadrant A | 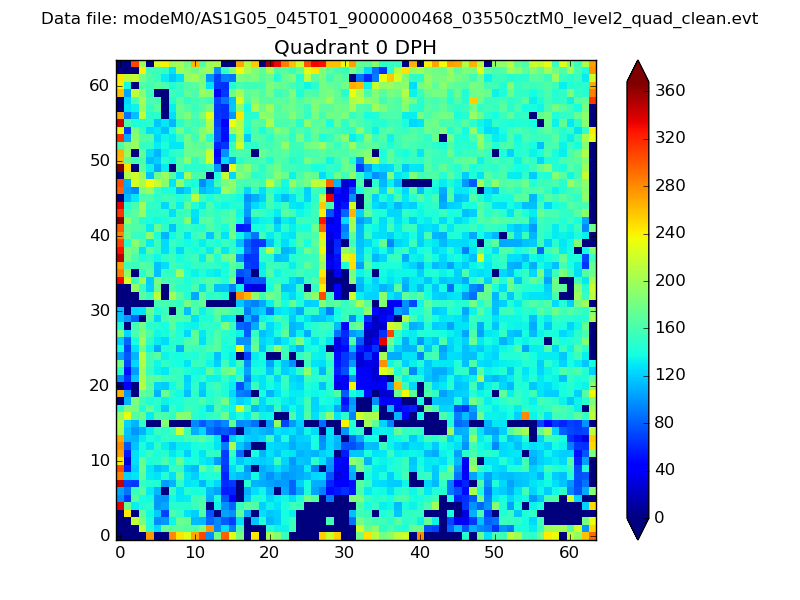 |
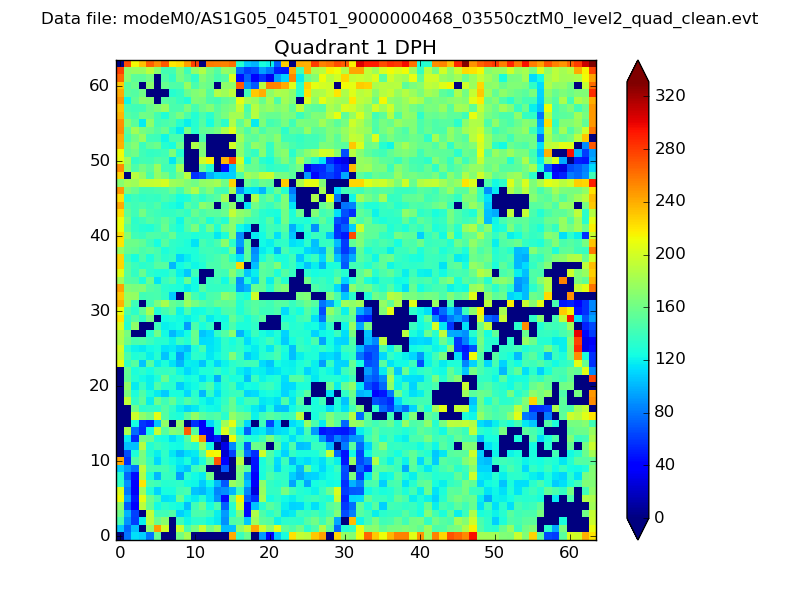 |
Quadrant B |
|---|---|---|---|
| Quadrant D | 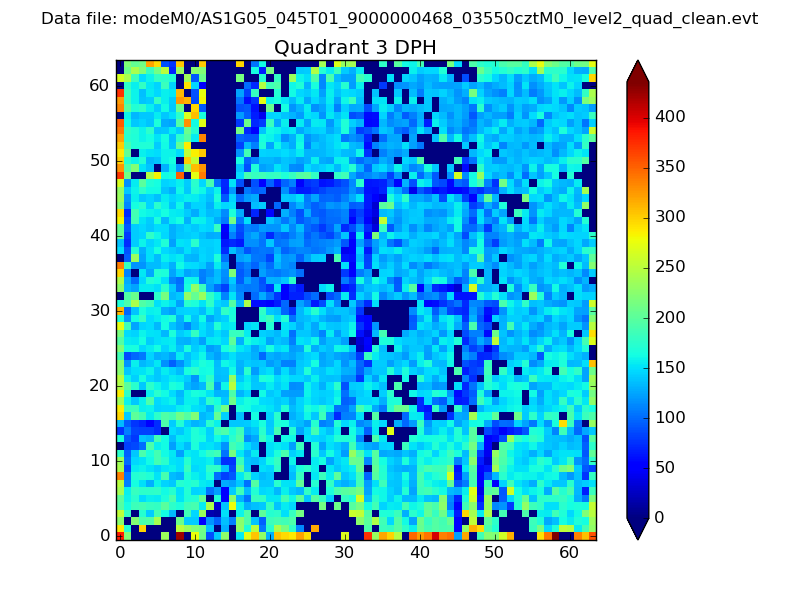 |
 |
Quadrant C |
| Plot type | Count rate plots | Images |
|---|---|---|
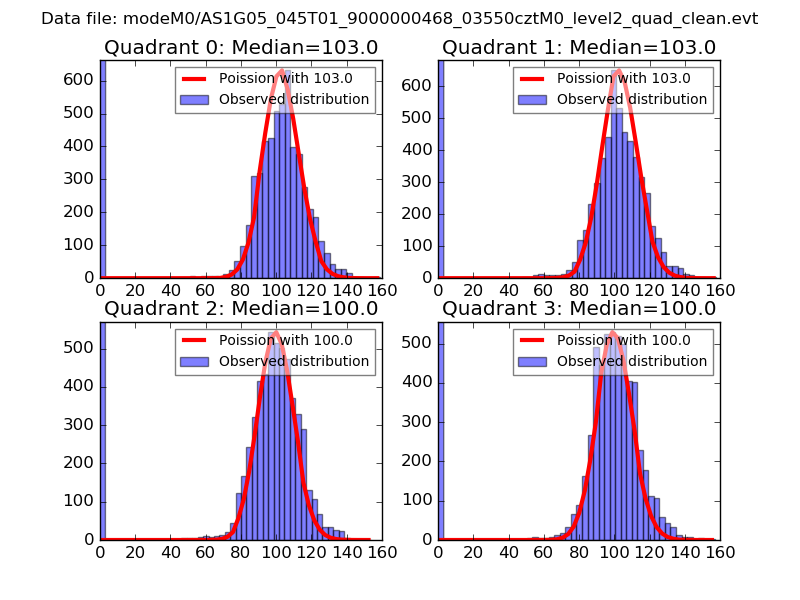
| Comparison with Poisson distribution Blue bars denote a histogram of data divided into 1 sec bins. Red curve is a Poisson curve with rate = median count rate of data. |
 |
 |
| Quadrant-wise count rates Data is divided into 100 sec bins |
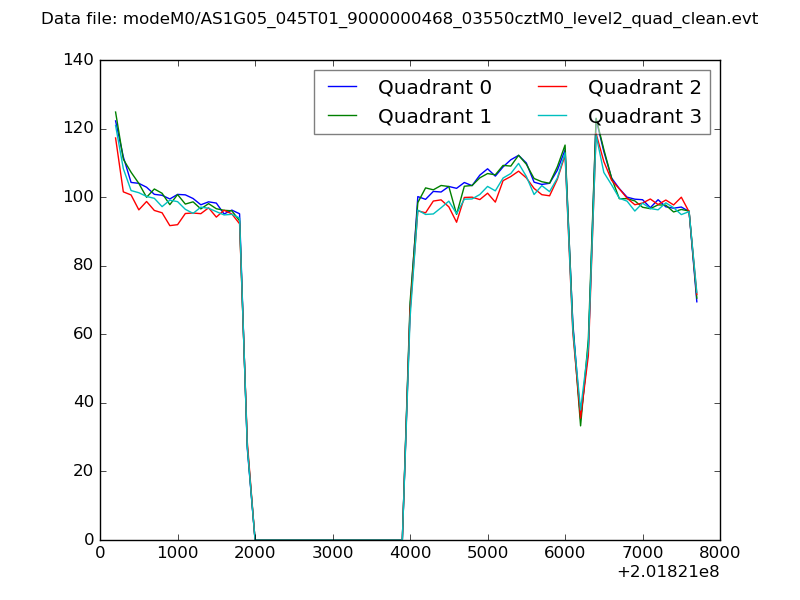 |
|
| Module-wise count rates for Quadrant A Data is divided into 100 sec bins |
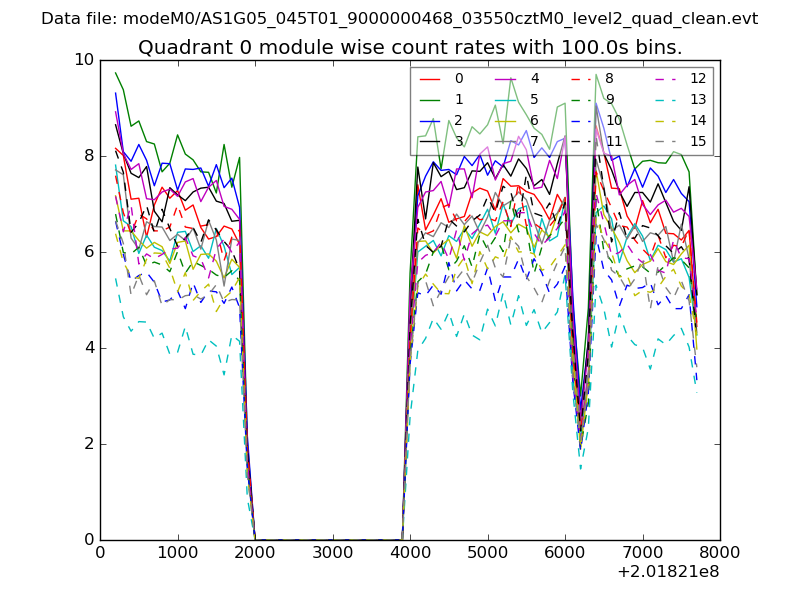 |
 |
| Module-wise count rates for Quadrant B Data is divided into 100 sec bins |
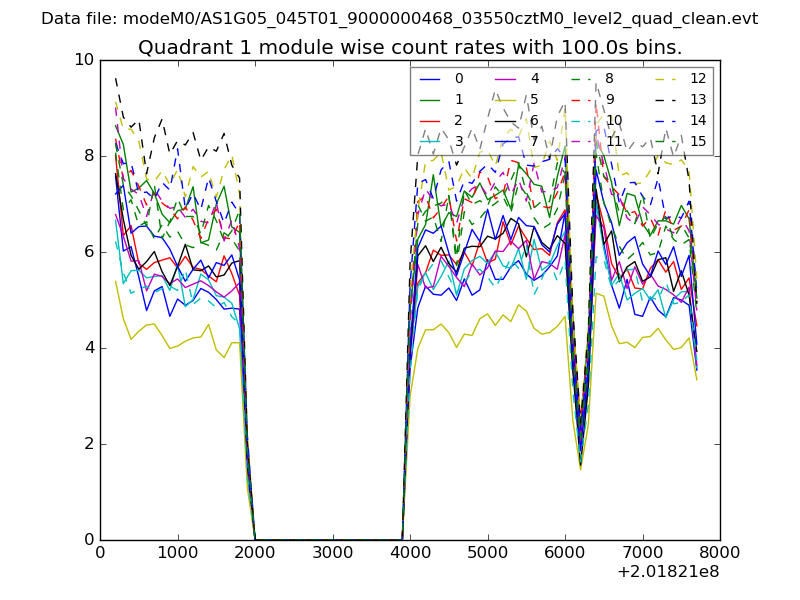 |
 |
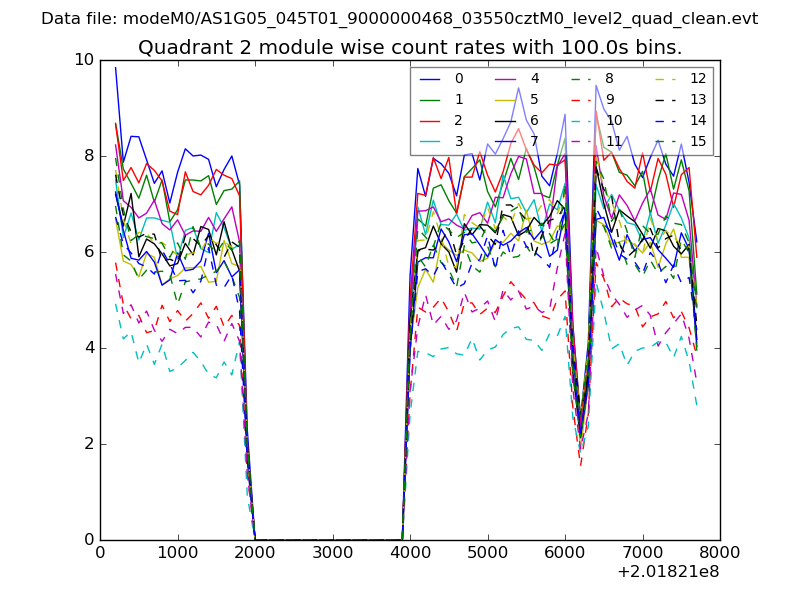
| Module-wise count rates for Quadrant C Data is divided into 100 sec bins |
 |
 |
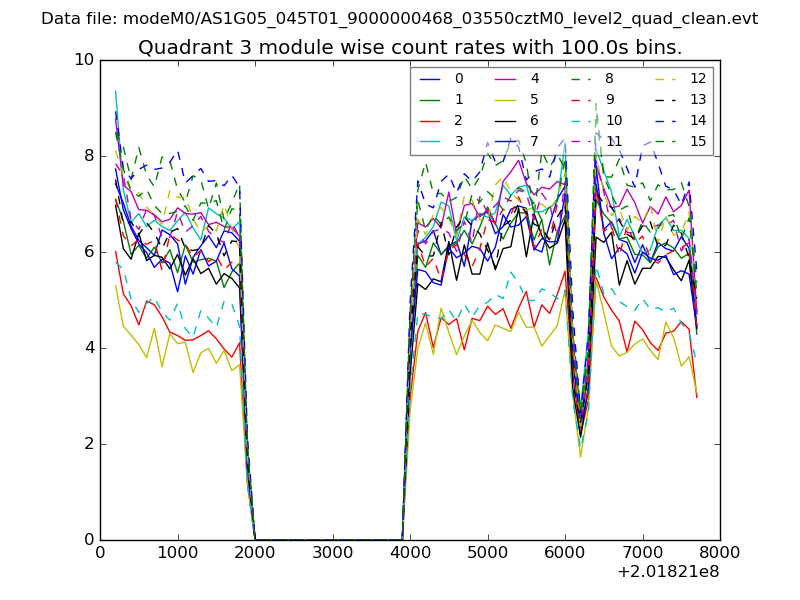
| Module-wise count rates for Quadrant D Data is divided into 100 sec bins |
 |
 |
| Parameter | Plot |
|---|---|
| CZT HV Monitor | 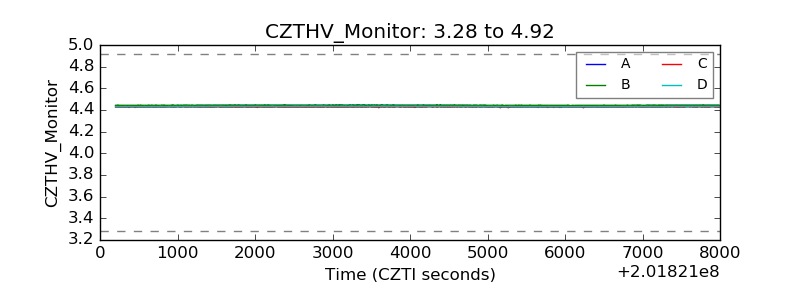 |
| D_VDD | 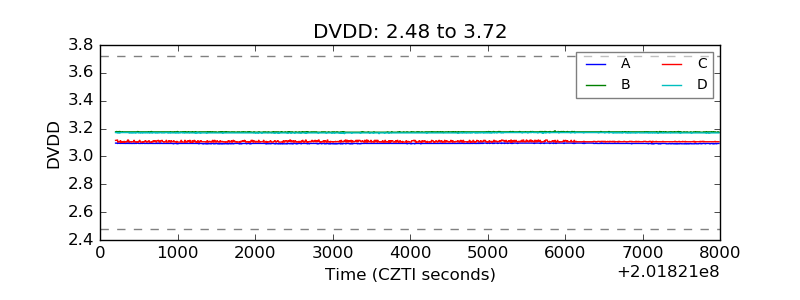 |
| Temperature 1 | 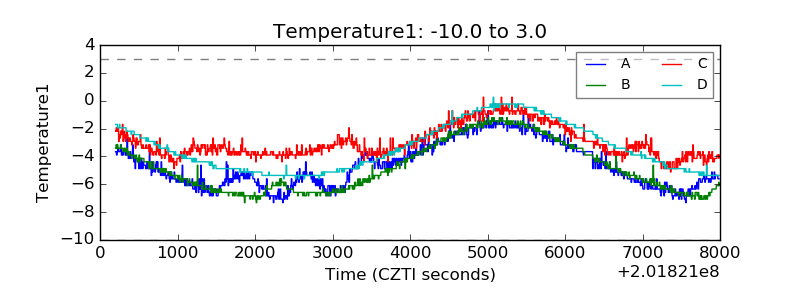 |
| Veto HV Monitor | 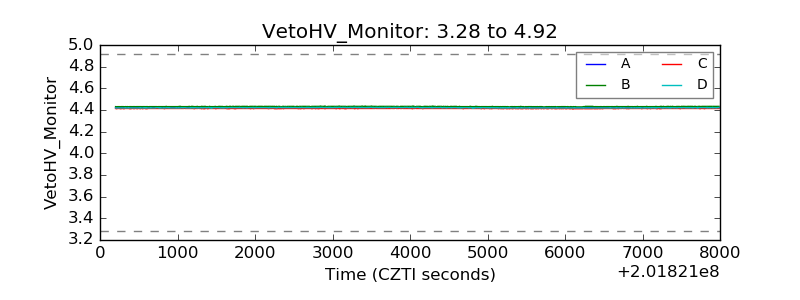 |
| Veto LLD | 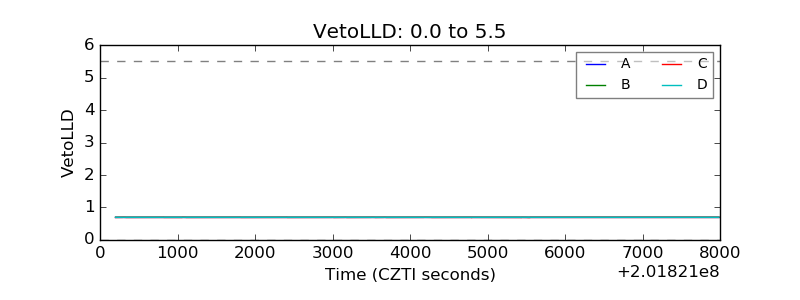 |
| Alpha Counter | 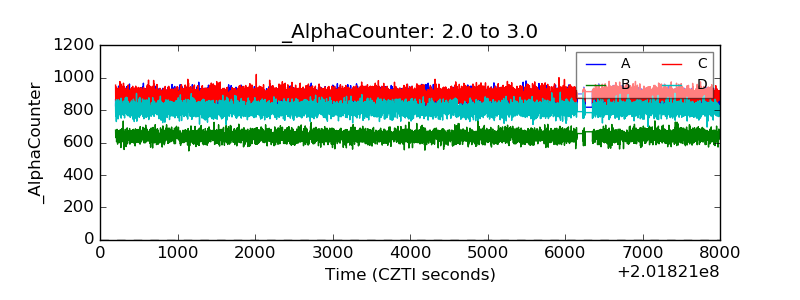 |
| _CPM_Rate | 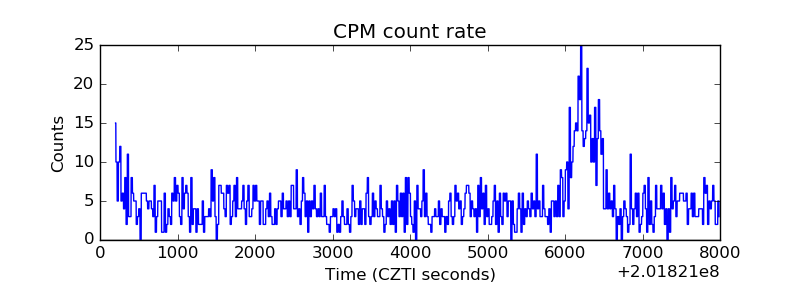 |
| CZT Counter | 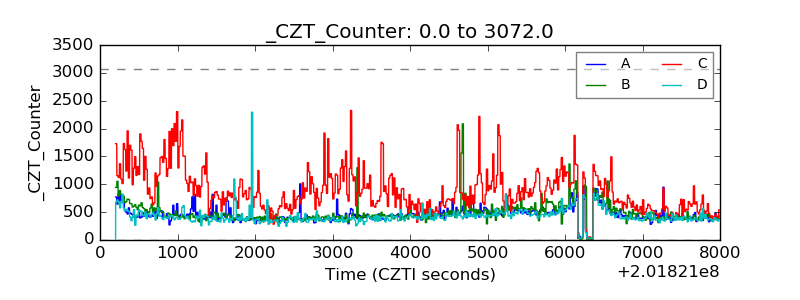 |
| +2.5 Volts monitor | 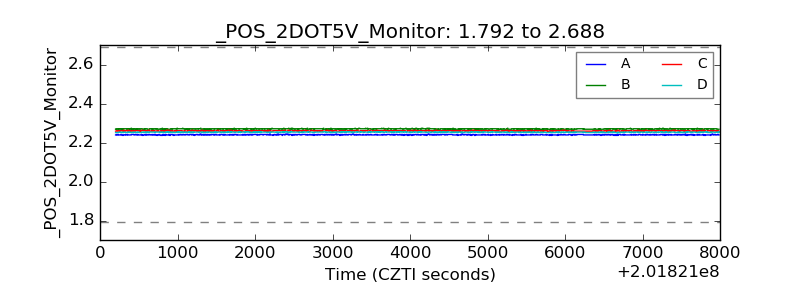 |
| +5 Volts monitor |  |
| _ROLL_ROT | 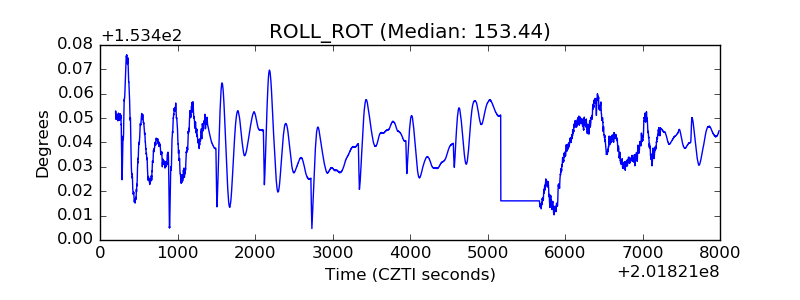 |
| _Roll_DEC | 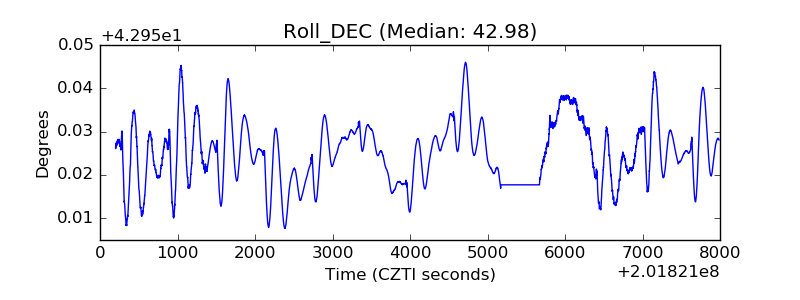 |
| _Roll_RA | 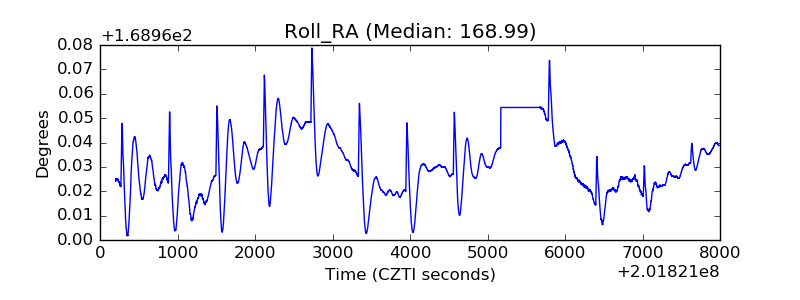 |
| Veto Counter | 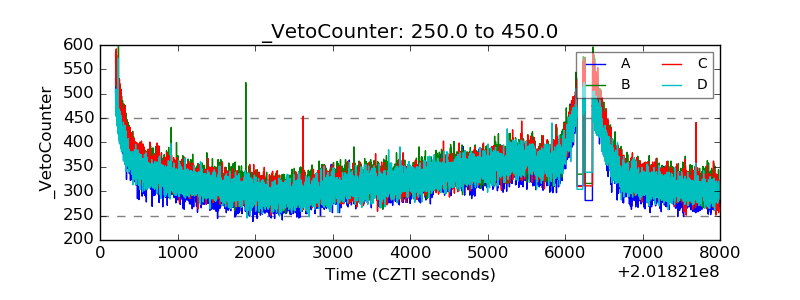 |