| Param | Original file | Final file |
|---|---|---|
| Filename | modeM0/AS1G05_045T01_9000000468_03551cztM0_level2.evt | modeM0/AS1G05_045T01_9000000468_03551cztM0_level2_quad_clean.evt |
| Size (bytes) | 767,905,920 | 94,320,000 |
| Size | 732.3 MB | 90.0 MB |
| Events in quadrant A | 4,025,813 | 585,422 |
| Events in quadrant B | 4,215,211 | 586,823 |
| Events in quadrant C | 10,689,935 | 521,185 |
| Events in quadrant D | 3,752,976 | 574,592 |
| Mode M0 | |||
|---|---|---|---|
| Quadrant | BADHDUFLAG | Total packets | Discarded packets |
| A | 0 | 18149 | 3 |
| B | 0 | 18342 | 2 |
| C | 0 | 37527 | 2 |
| D | 0 | 17751 | 2 |
| Mode M9 | |||
|---|---|---|---|
| Quadrant | BADHDUFLAG | Total packets | Discarded packets |
| A | 0 | 3 | 0 |
| B | 0 | 3 | 0 |
| C | 0 | 3 | 0 |
| D | 0 | 3 | 0 |
| Mode SS | |||
|---|---|---|---|
| Quadrant | BADHDUFLAG | Total packets | Discarded packets |
| A | 0 | 174 | 0 |
| B | 0 | 174 | 0 |
| C | 0 | 174 | 0 |
| D | 0 | 174 | 0 |
| Quadrant | Total seconds | Saturated seconds | Saturation percentage |
|---|---|---|---|
| A | 8459 | 172 | 2.033337% |
| B | 8459 | 242 | 2.860858% |
| C | 8459 | 1922 | 22.721362% |
| D | 8459 | 58 | 0.685660% |
Noise dominated data is calculated using 1-second bins in cleaned event files. If a bin has >2000 counts, and if more than 50% of those come from <1% of pixels, then it is considered to be noise-dominated and hence unusable.
| Quadrant | # 1 sec bins | Bins with >0 counts | Bins with >2000 counts | High rate bins dominated by noise | Noise dominated (total time) | Noise dominated (detector-on time) | Marked lightcurve |
|---|---|---|---|---|---|---|---|
| A | 8664 | 8461 | 2 | 2 | 0.02% | 0.02% | 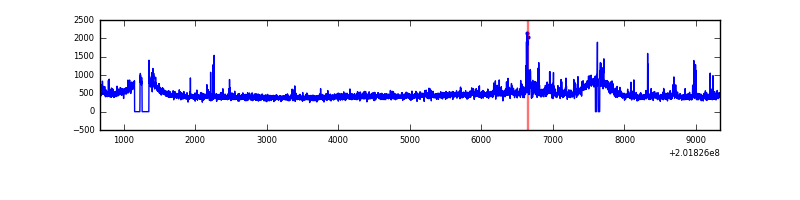 |
| B | 8664 | 8461 | 2 | 2 | 0.02% | 0.02% | 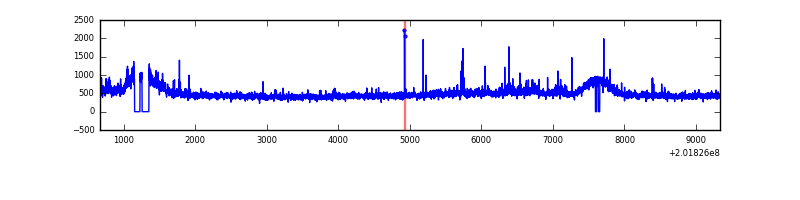 |
| C | 8664 | 8461 | 1509 | 1509 | 17.42% | 17.83% | 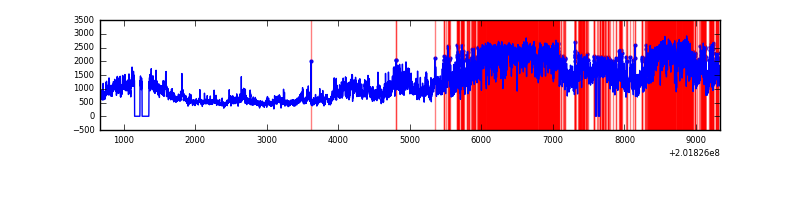 |
| D | 8664 | 8463 | 8 | 8 | 0.09% | 0.09% | 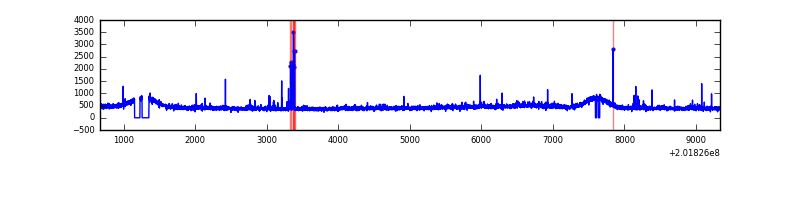 |
Top three noisy pixels from each quadrant. If the there are fewer than three noisy pixels in the level2.evt file, extra rows are filled as -1
| Pixel properties | Quadrant properties | ||||||
|---|---|---|---|---|---|---|---|
| Quadrant | DetID | PixID | Counts | Sigma | Mean | Median | Sigma |
| A | 0 | 118 | 119992 | 584.04 | 979 | 953 | 203.8 |
| A | 3 | 1 | 62025 | 299.64 | 979 | 953 | 203.8 |
| A | 0 | 50 | 48134 | 231.48 | 979 | 953 | 203.8 |
| B | 15 | 204 | 142607 | 731.36 | 996 | 969 | 193.7 |
| B | 14 | 167 | 77448 | 394.91 | 996 | 969 | 193.7 |
| B | 4 | 81 | 30826 | 154.17 | 996 | 969 | 193.7 |
| C | 1 | 192 | 7093768 | 33838.6 | 904 | 906 | 209.6 |
| C | 1 | 16 | 42352 | 197.73 | 904 | 906 | 209.6 |
| C | 13 | 61 | 7730 | 32.55 | 904 | 906 | 209.6 |
| D | 13 | 239 | 54654 | 232.21 | 958 | 928 | 231.4 |
| D | 8 | 195 | 40108 | 169.34 | 958 | 928 | 231.4 |
| D | 13 | 223 | 19710 | 81.18 | 958 | 928 | 231.4 |
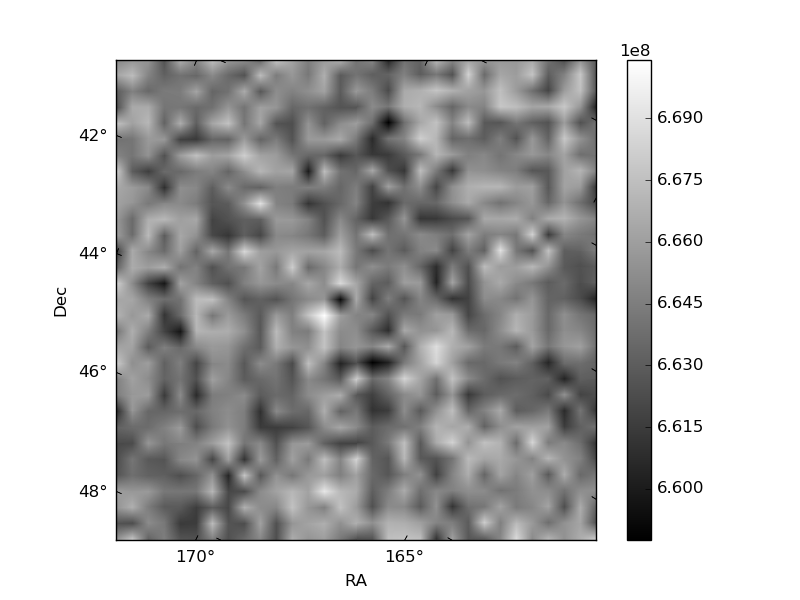
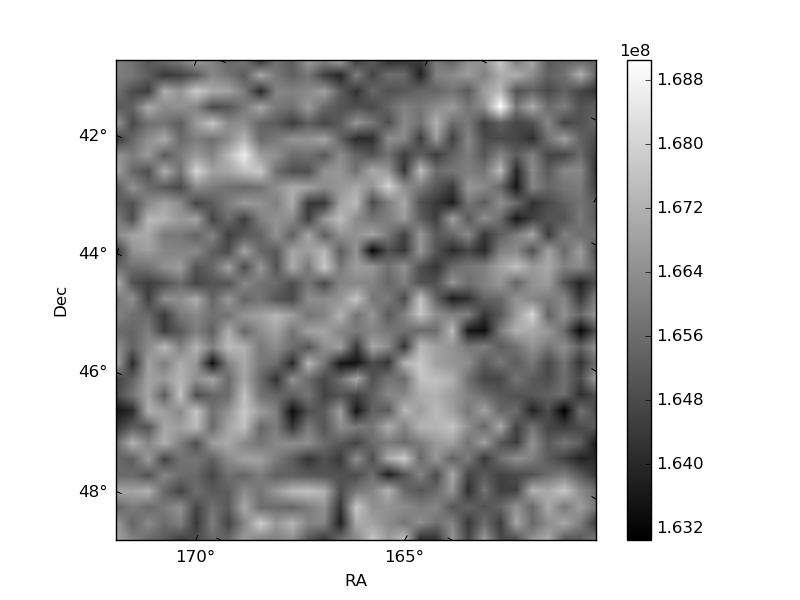
Histogram calculated using DETX and DETY for each event in the final _common_clean file
| Quadrant A |  |
 |
Quadrant B |
|---|---|---|---|
| Quadrant D |  |
 |
Quadrant C |
| Plot type | Count rate plots | Images |
|---|---|---|
| Comparison with Poisson distribution Blue bars denote a histogram of data divided into 1 sec bins. Red curve is a Poisson curve with rate = median count rate of data. |
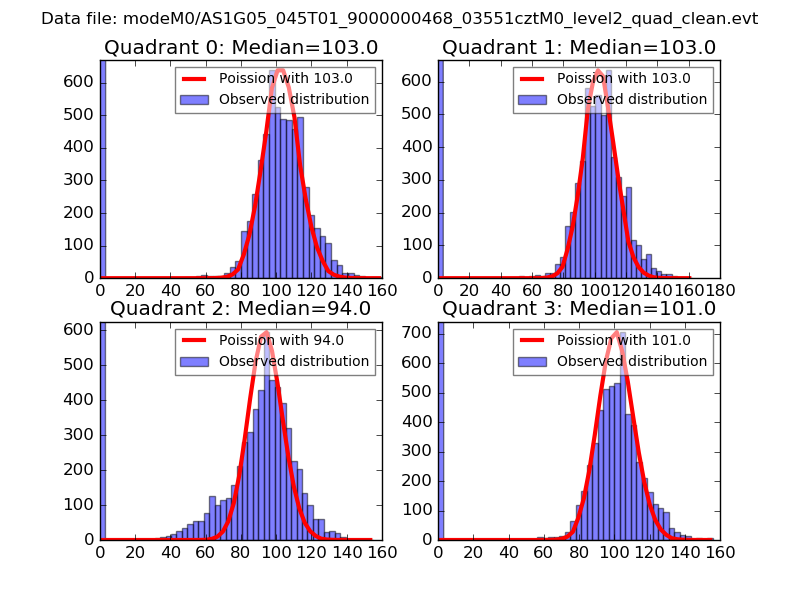 |
 |
| Quadrant-wise count rates Data is divided into 100 sec bins |
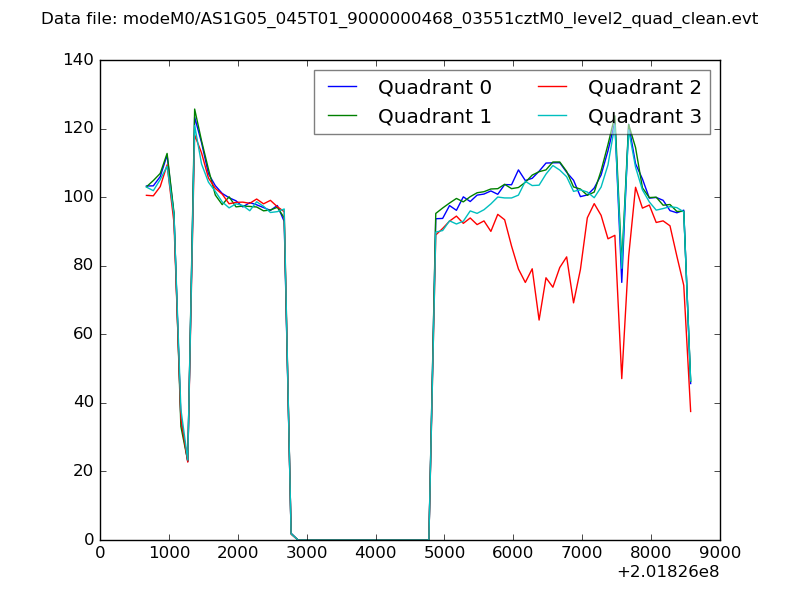 |
|
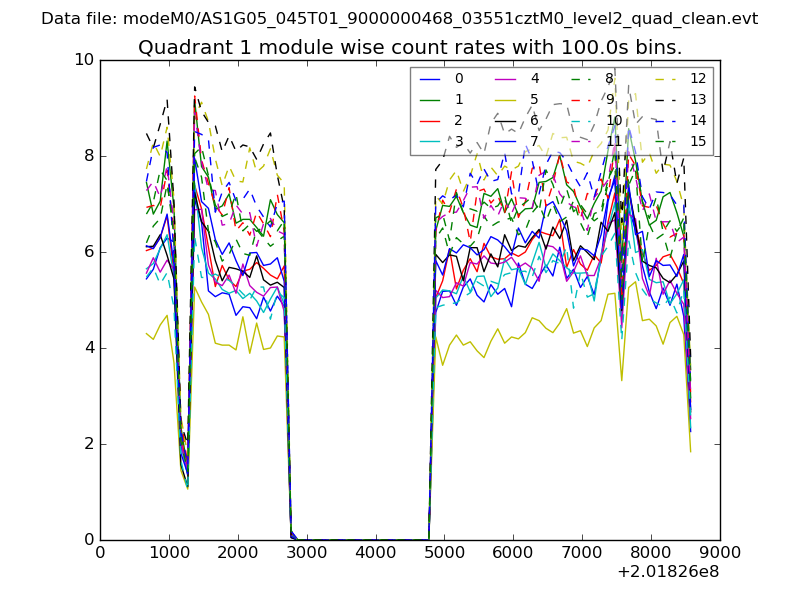
| Module-wise count rates for Quadrant A Data is divided into 100 sec bins |
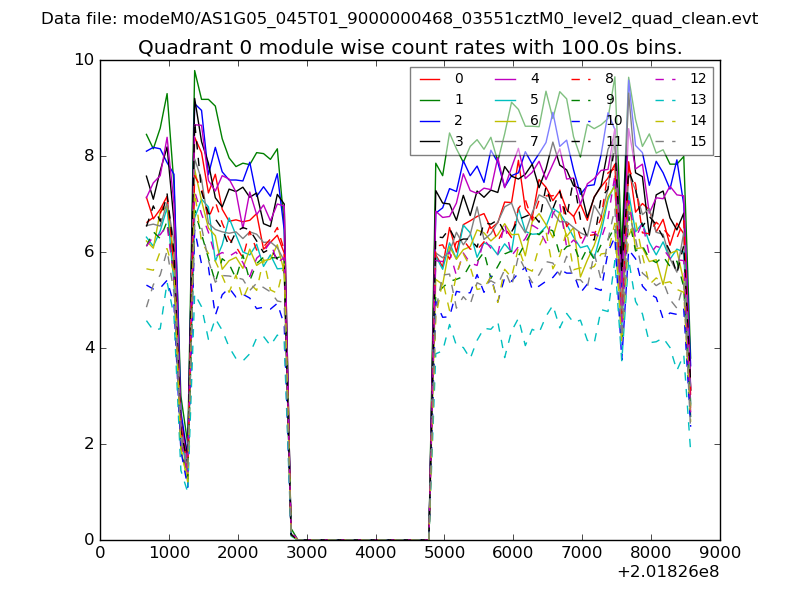 |
 |
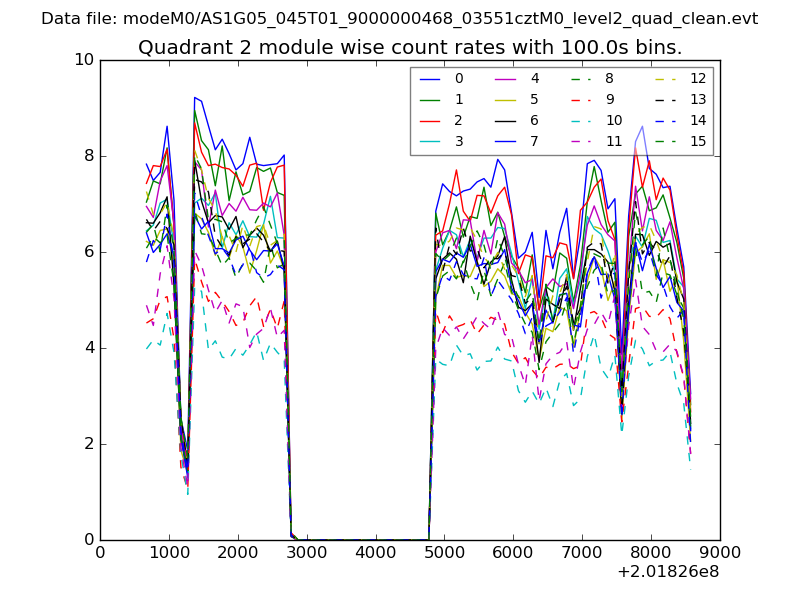
| Module-wise count rates for Quadrant B Data is divided into 100 sec bins |
 |
 |
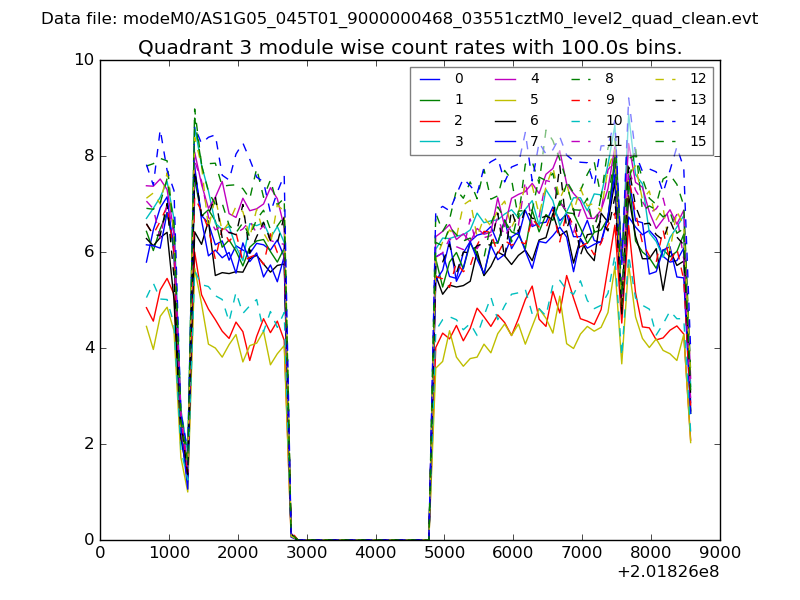
| Module-wise count rates for Quadrant C Data is divided into 100 sec bins |
 |
 |
| Module-wise count rates for Quadrant D Data is divided into 100 sec bins |
 |
 |
| Parameter | Plot |
|---|---|
| CZT HV Monitor | 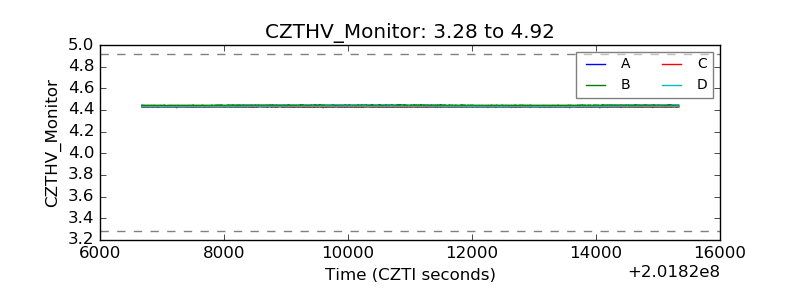 |
| D_VDD | 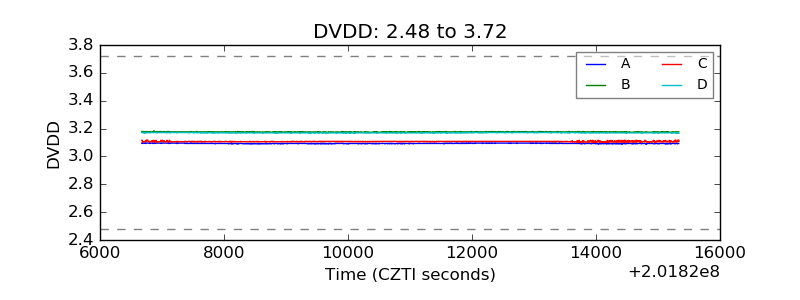 |
| Temperature 1 | 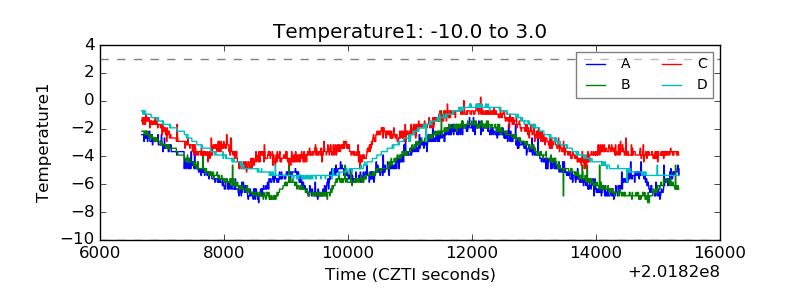 |
| Veto HV Monitor | 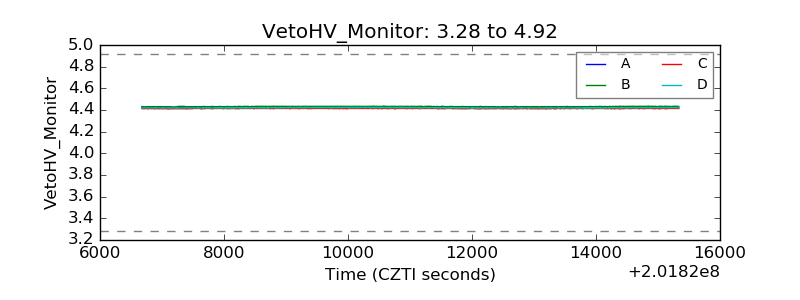 |
| Veto LLD | 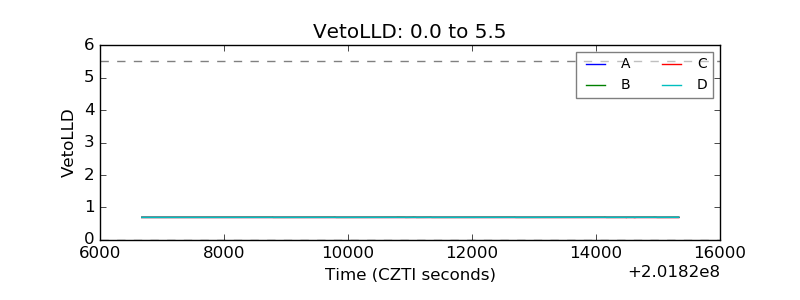 |
| Alpha Counter | 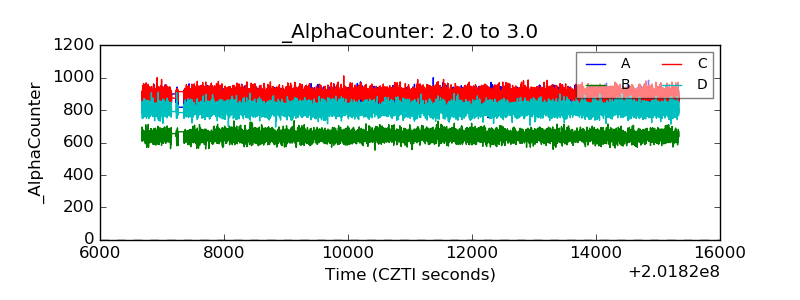 |
| _CPM_Rate | 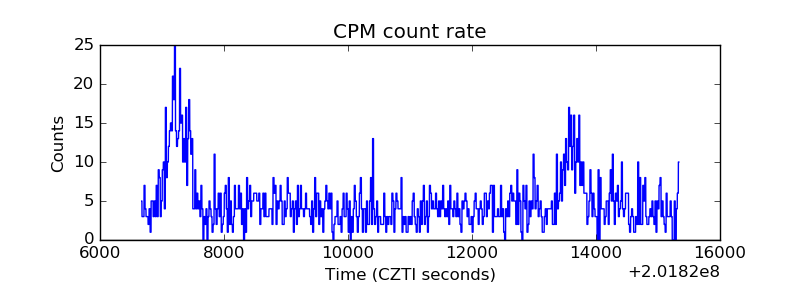 |
| CZT Counter |  |
| +2.5 Volts monitor |  |
| +5 Volts monitor |  |
| _ROLL_ROT | 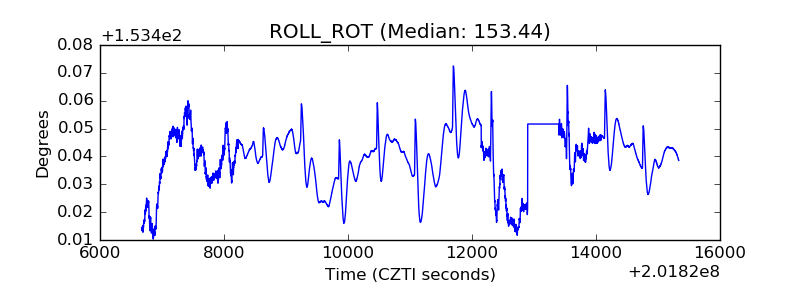 |
| _Roll_DEC | 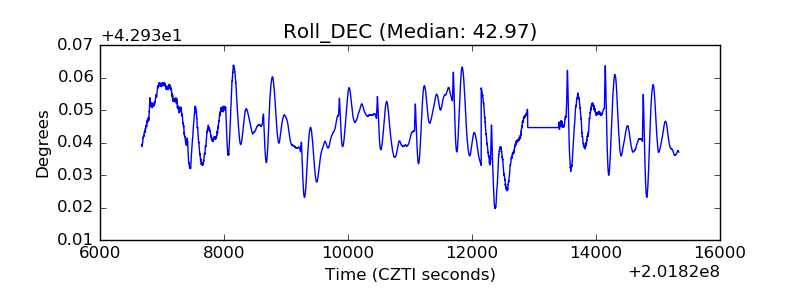 |
| _Roll_RA | 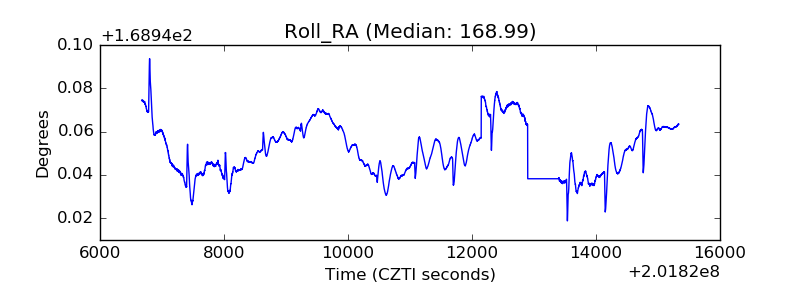 |
| Veto Counter | 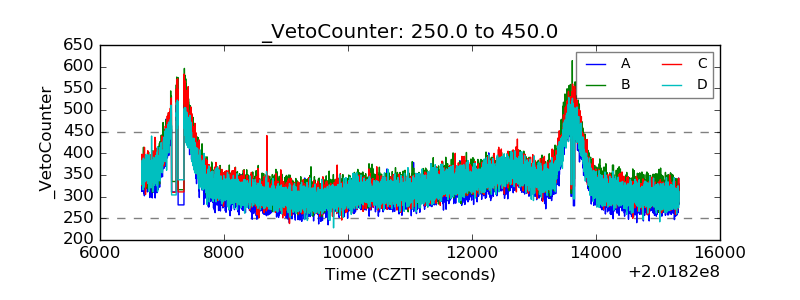 |