| Param | Original file | Final file |
|---|---|---|
| Filename | modeM0/AS1G05_045T01_9000000468_03554cztM0_level2.evt | modeM0/AS1G05_045T01_9000000468_03554cztM0_level2_quad_clean.evt |
| Size (bytes) | 1,645,041,600 | 143,377,920 |
| Size | 1.5 GB | 136.7 MB |
| Events in quadrant A | 6,742,532 | 894,434 |
| Events in quadrant B | 7,513,637 | 891,948 |
| Events in quadrant C | 28,128,179 | 677,169 |
| Events in quadrant D | 6,454,577 | 870,458 |
| Mode M0 | |||
|---|---|---|---|
| Quadrant | BADHDUFLAG | Total packets | Discarded packets |
| A | 0 | 30275 | 30 |
| B | 0 | 31649 | 33 |
| C | 0 | 93770 | 172 |
| D | 0 | 30220 | 34 |
| Mode M9 | |||
|---|---|---|---|
| Quadrant | BADHDUFLAG | Total packets | Discarded packets |
| A | 0 | 14 | 0 |
| B | 0 | 14 | 0 |
| C | 0 | 14 | 0 |
| D | 0 | 14 | 0 |
| Mode SS | |||
|---|---|---|---|
| Quadrant | BADHDUFLAG | Total packets | Discarded packets |
| A | 0 | 298 | 0 |
| B | 0 | 298 | 2 |
| C | 0 | 298 | 0 |
| D | 0 | 298 | 0 |
| Quadrant | Total seconds | Saturated seconds | Saturation percentage |
|---|---|---|---|
| A | 14566 | 241 | 1.654538% |
| B | 14564 | 266 | 1.826421% |
| C | 14543 | 8098 | 55.683147% |
| D | 14565 | 186 | 1.277034% |
Noise dominated data is calculated using 1-second bins in cleaned event files. If a bin has >2000 counts, and if more than 50% of those come from <1% of pixels, then it is considered to be noise-dominated and hence unusable.
| Quadrant | # 1 sec bins | Bins with >0 counts | Bins with >2000 counts | High rate bins dominated by noise | Noise dominated (total time) | Noise dominated (detector-on time) | Marked lightcurve |
|---|---|---|---|---|---|---|---|
| A | 16044 | 14578 | 1 | 1 | 0.01% | 0.01% | 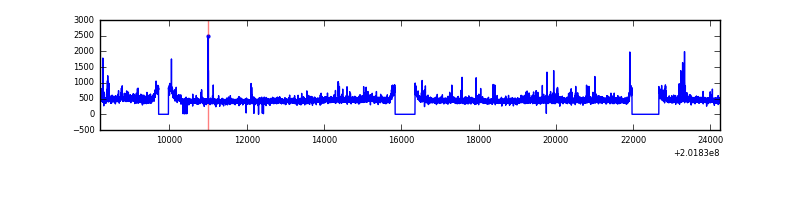 |
| B | 16044 | 14579 | 9 | 9 | 0.06% | 0.06% | 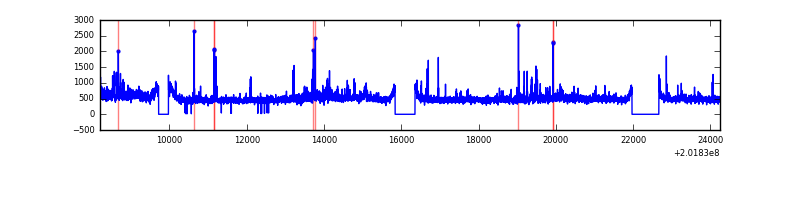 |
| C | 16044 | 14576 | 8005 | 8005 | 49.89% | 54.92% | 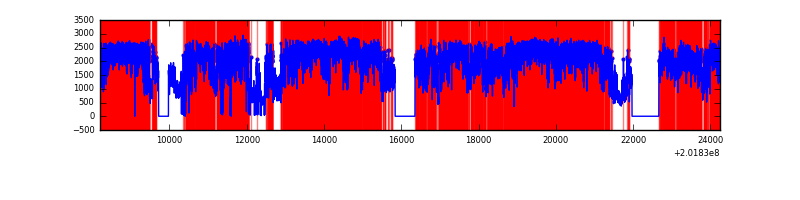 |
| D | 16044 | 14579 | 35 | 35 | 0.22% | 0.24% | 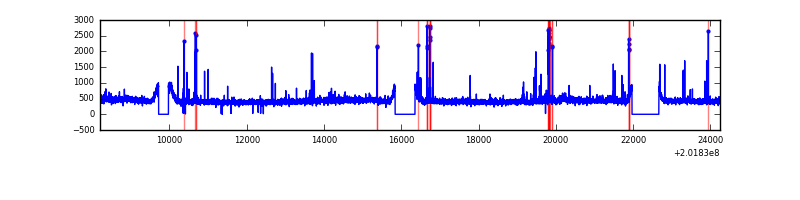 |
Top three noisy pixels from each quadrant. If the there are fewer than three noisy pixels in the level2.evt file, extra rows are filled as -1
| Pixel properties | Quadrant properties | ||||||
|---|---|---|---|---|---|---|---|
| Quadrant | DetID | PixID | Counts | Sigma | Mean | Median | Sigma |
| A | 3 | 1 | 122781 | 357.09 | 1668 | 1628 | 339.3 |
| A | 0 | 50 | 93875 | 271.89 | 1668 | 1628 | 339.3 |
| A | 0 | 118 | 77546 | 223.76 | 1668 | 1628 | 339.3 |
| B | 15 | 204 | 527554 | 1597.62 | 1693 | 1652 | 329.2 |
| B | 14 | 167 | 155805 | 468.3 | 1693 | 1652 | 329.2 |
| B | 0 | 228 | 52812 | 155.42 | 1693 | 1652 | 329.2 |
| C | 1 | 192 | 22360278 | 68690.11 | 1402 | 1408 | 325.5 |
| C | 2 | 53 | 160756 | 489.54 | 1402 | 1408 | 325.5 |
| C | 1 | 16 | 96437 | 291.94 | 1402 | 1408 | 325.5 |
| D | 7 | 39 | 55762 | 137.67 | 1624 | 1571 | 393.6 |
| D | 13 | 223 | 50669 | 124.73 | 1624 | 1571 | 393.6 |
| D | 13 | 239 | 48680 | 119.68 | 1624 | 1571 | 393.6 |
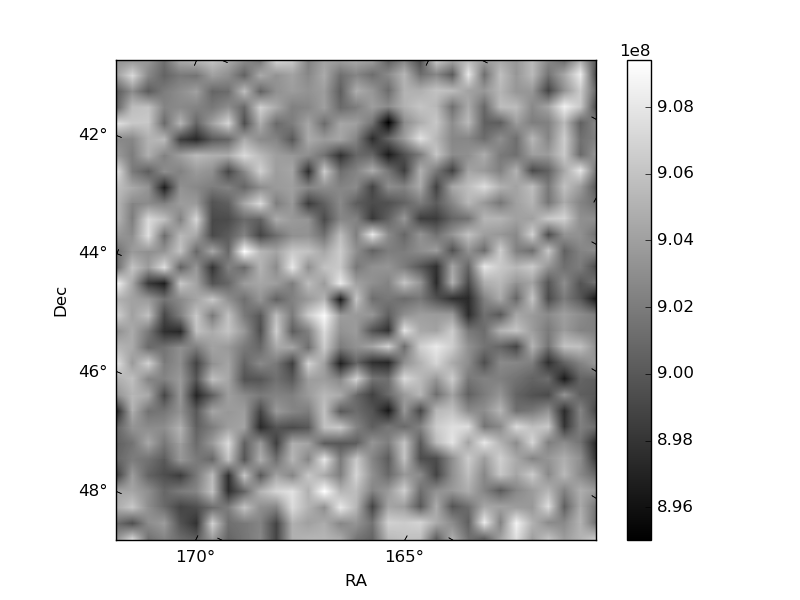
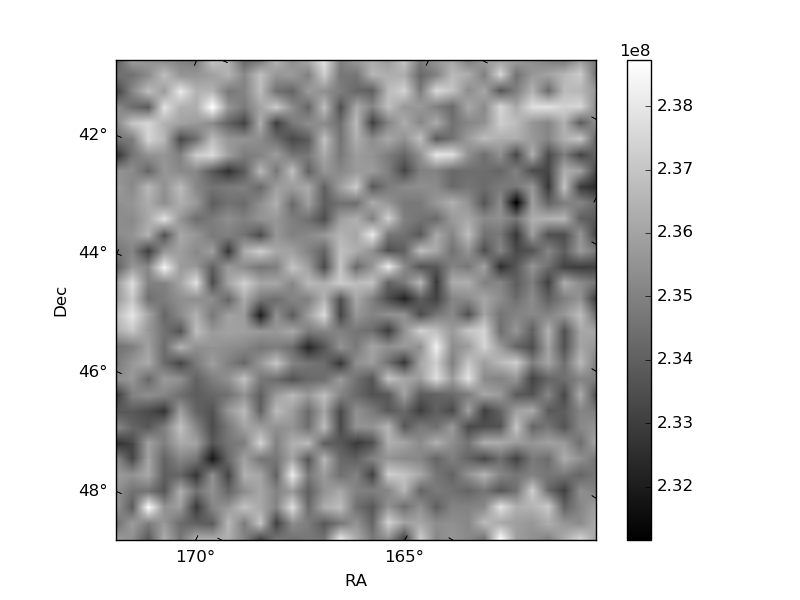
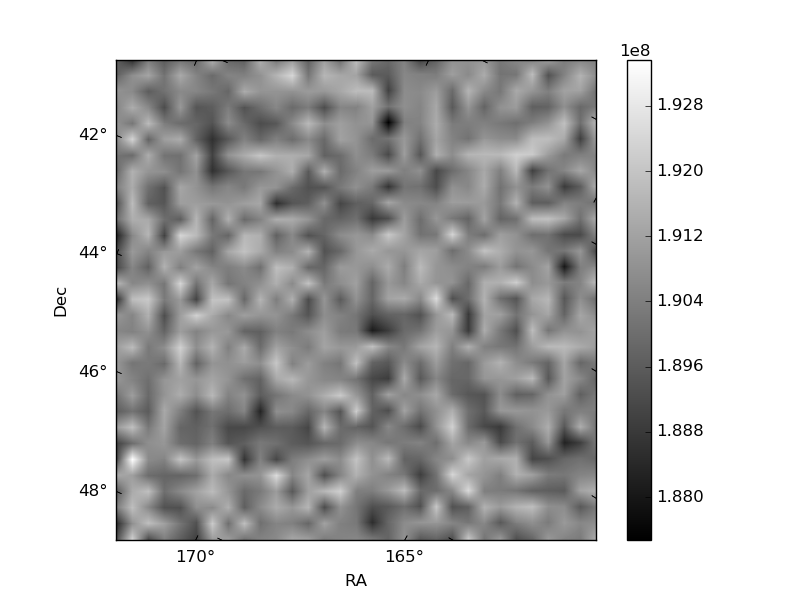
Histogram calculated using DETX and DETY for each event in the final _common_clean file
| Quadrant A | 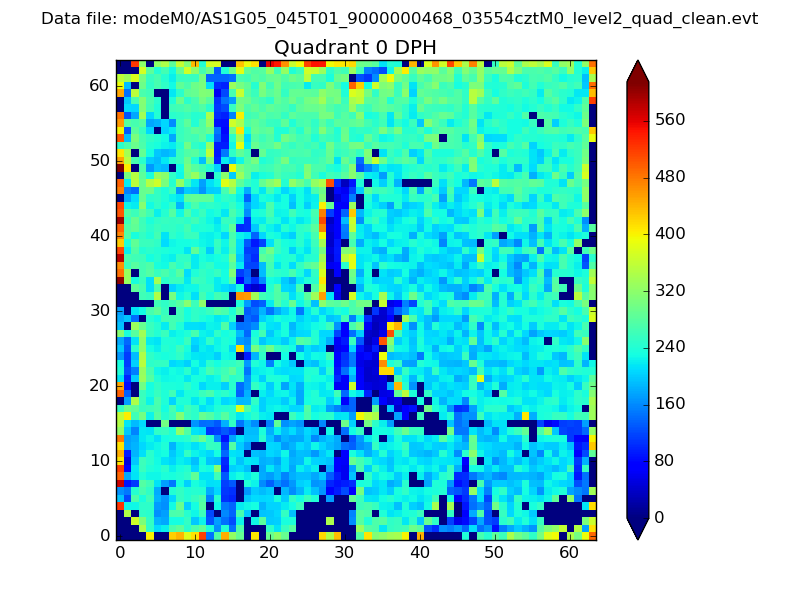 |
 |
Quadrant B |
|---|---|---|---|
| Quadrant D | 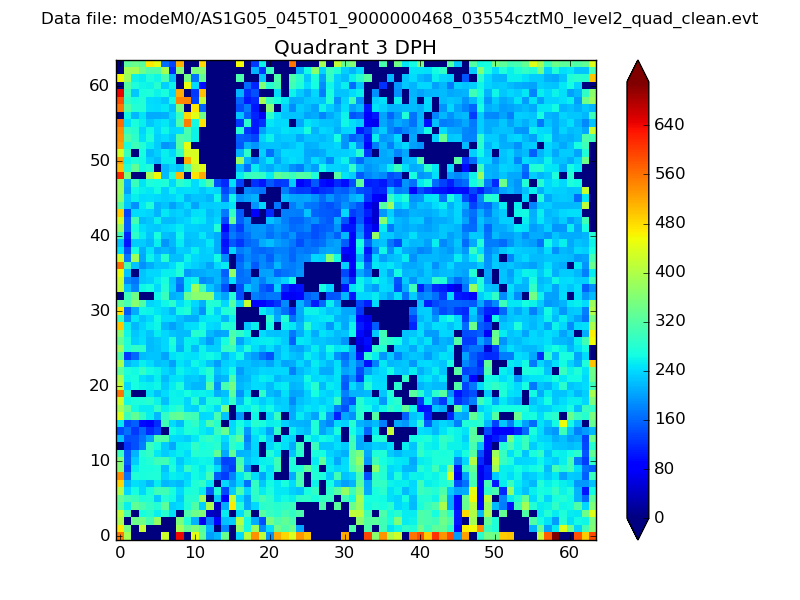 |
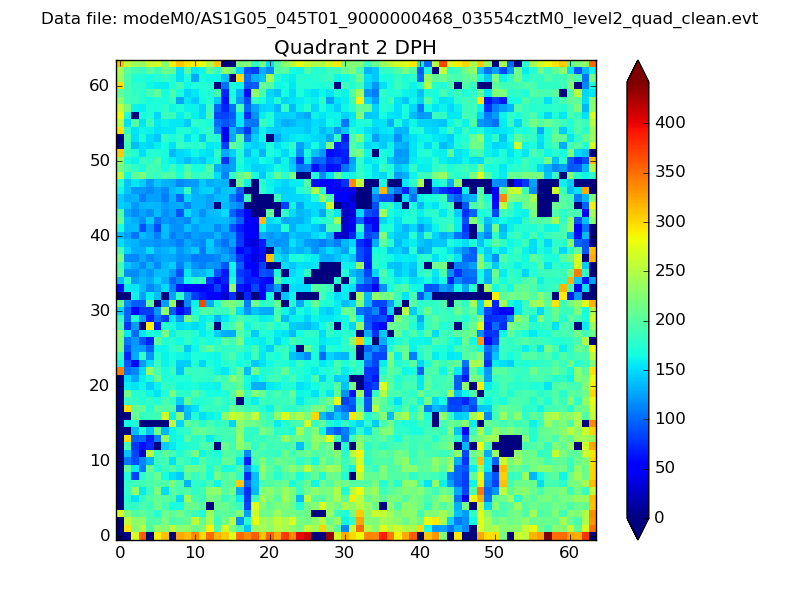 |
Quadrant C |
| Plot type | Count rate plots | Images |
|---|---|---|
| Comparison with Poisson distribution Blue bars denote a histogram of data divided into 1 sec bins. Red curve is a Poisson curve with rate = median count rate of data. |
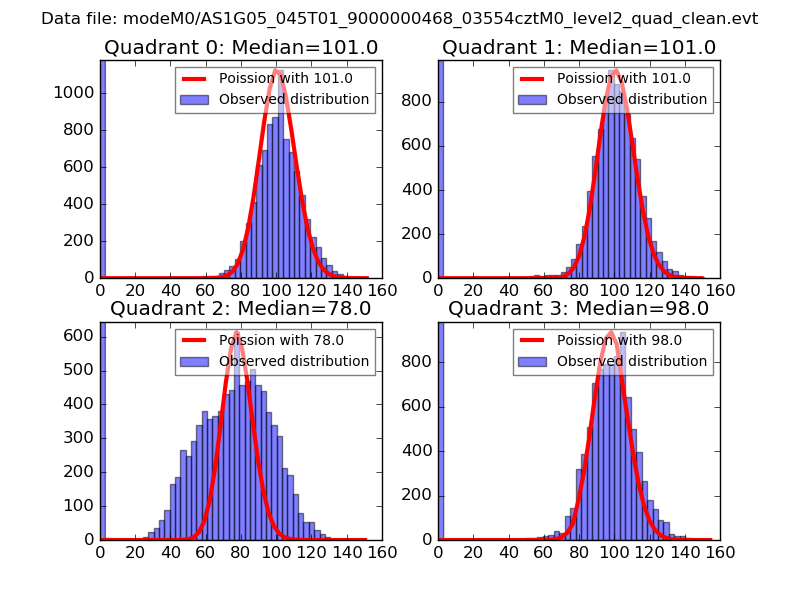 |
 |
| Quadrant-wise count rates Data is divided into 100 sec bins |
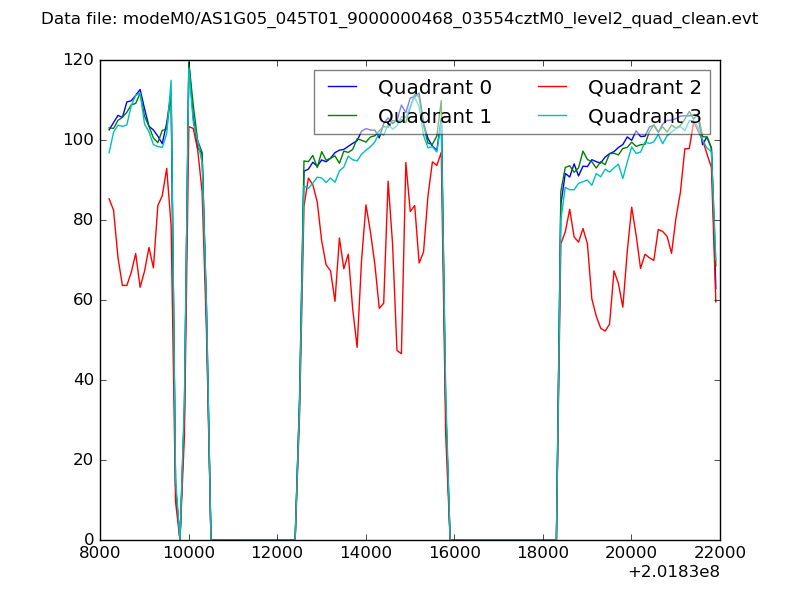 |
|
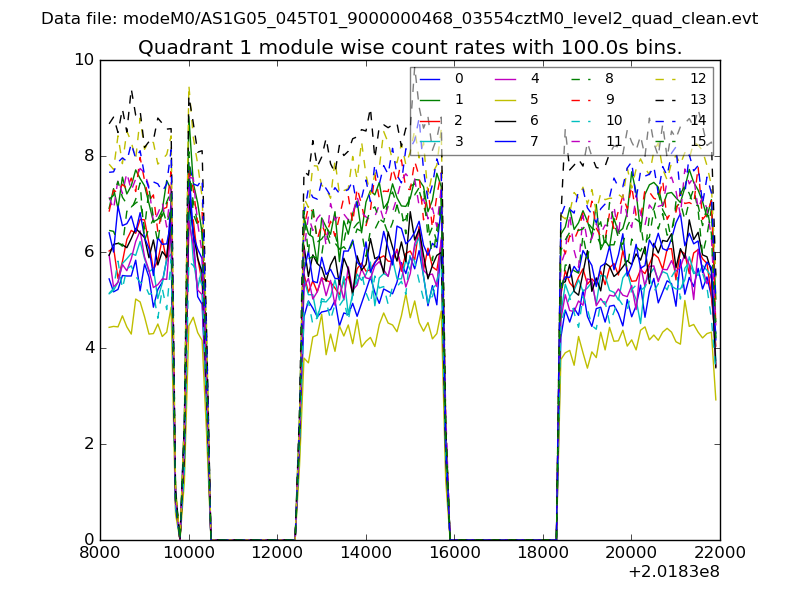
| Module-wise count rates for Quadrant A Data is divided into 100 sec bins |
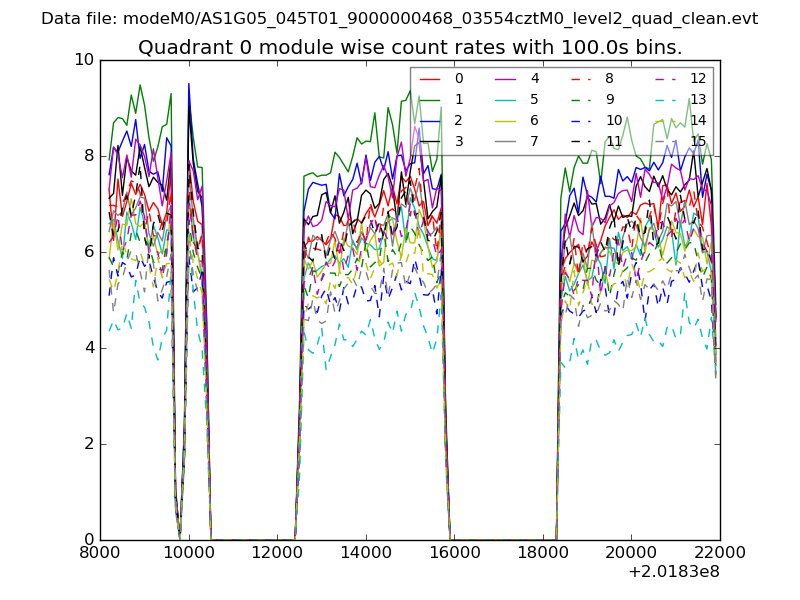 |
 |
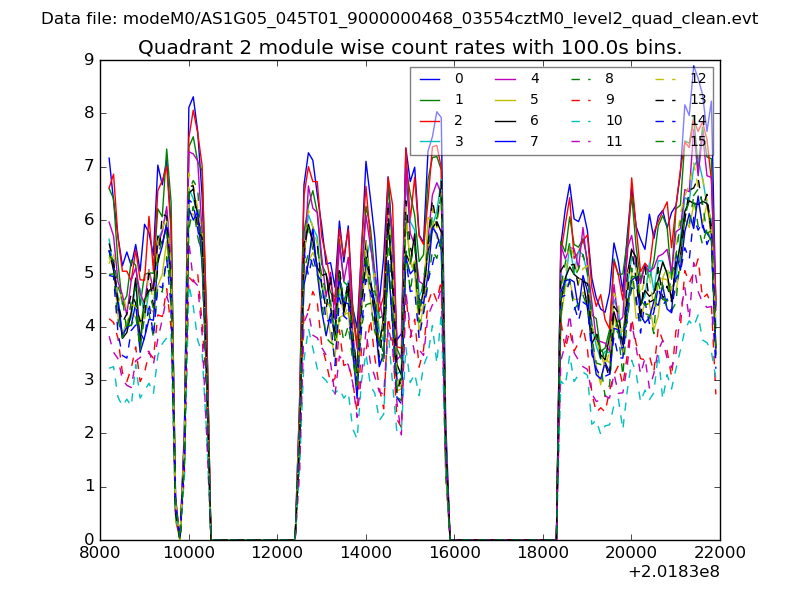
| Module-wise count rates for Quadrant B Data is divided into 100 sec bins |
 |
 |
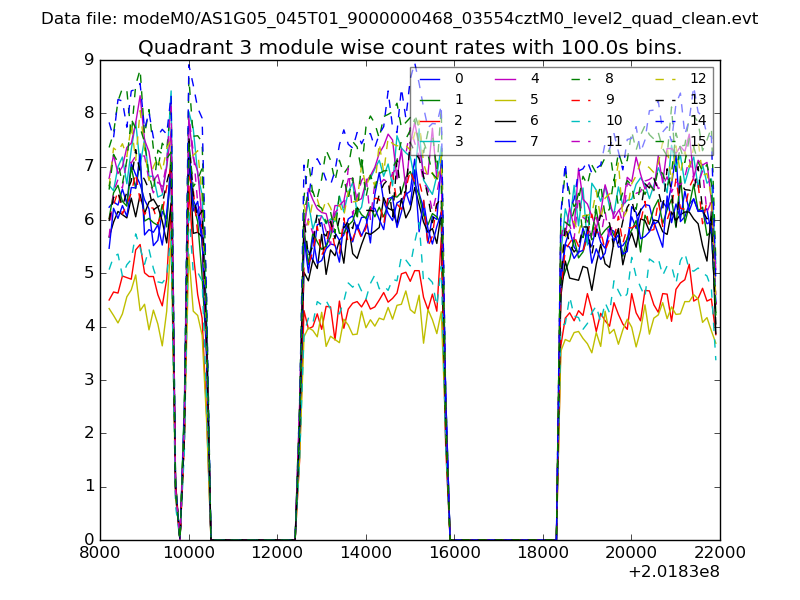
| Module-wise count rates for Quadrant C Data is divided into 100 sec bins |
 |
 |
| Module-wise count rates for Quadrant D Data is divided into 100 sec bins |
 |
 |
| Parameter | Plot |
|---|---|
| CZT HV Monitor | 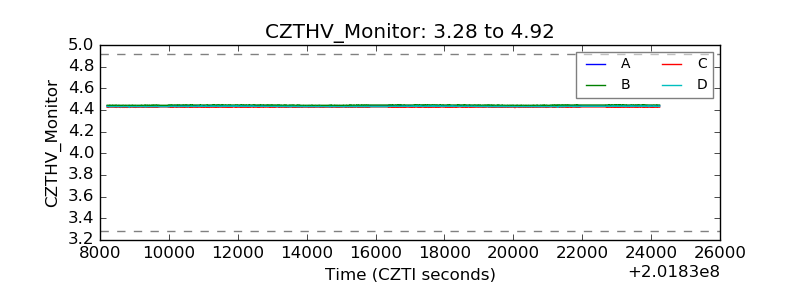 |
| D_VDD | 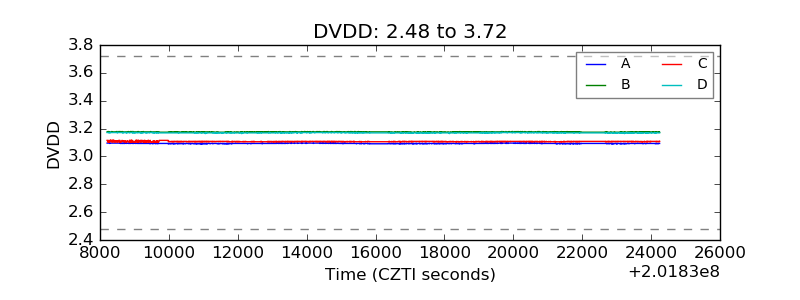 |
| Temperature 1 | 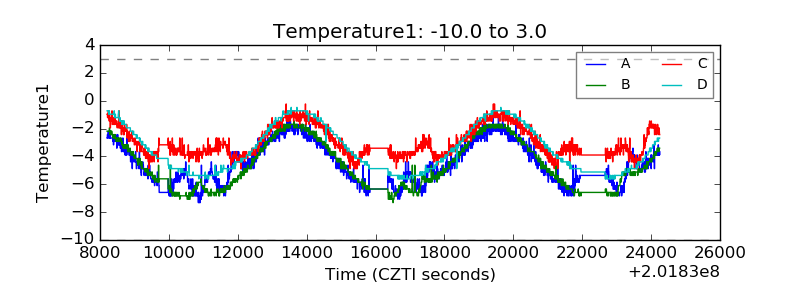 |
| Veto HV Monitor | 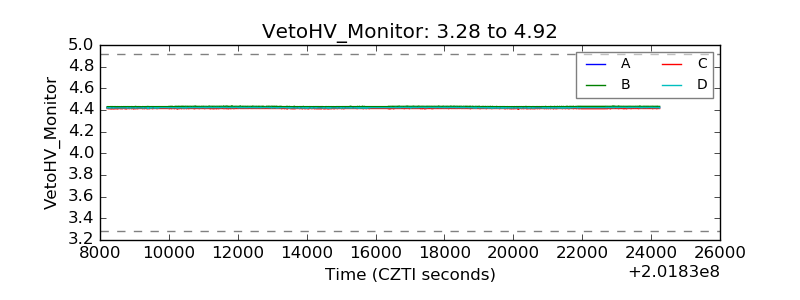 |
| Veto LLD | 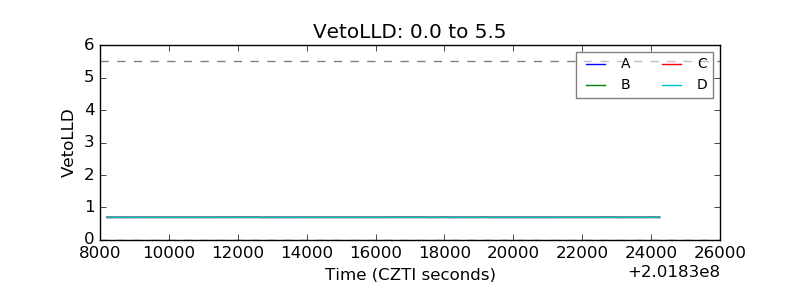 |
| Alpha Counter | 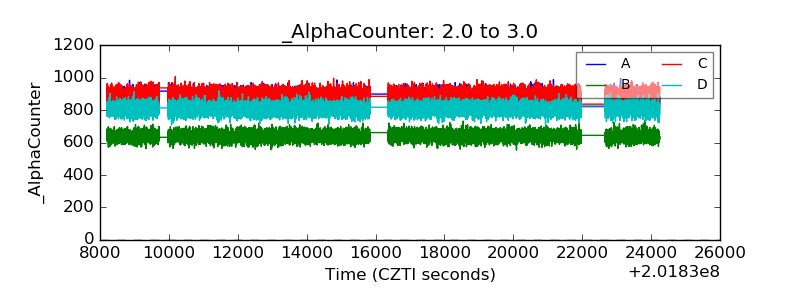 |
| _CPM_Rate | 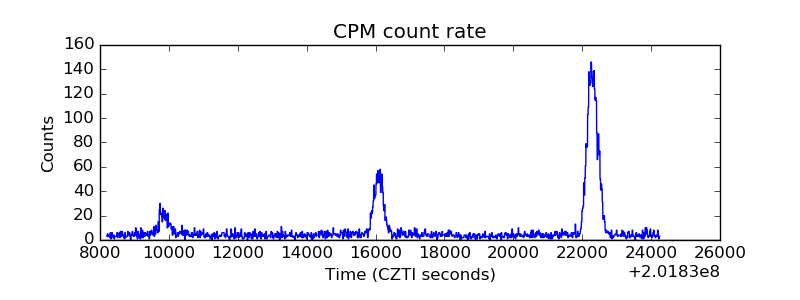 |
| CZT Counter | 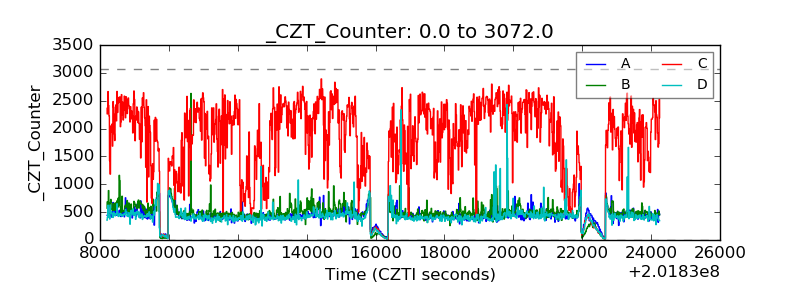 |
| +2.5 Volts monitor |  |
| +5 Volts monitor |  |
| _ROLL_ROT | 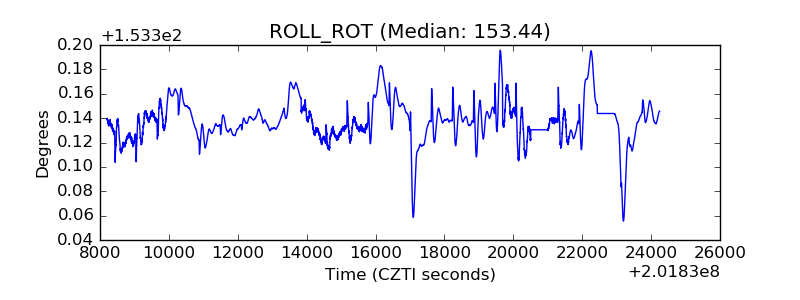 |
| _Roll_DEC | 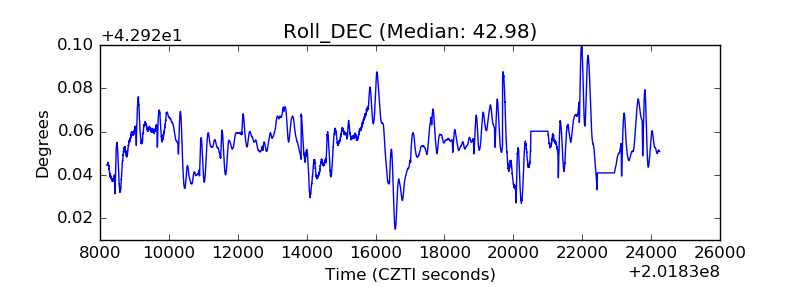 |
| _Roll_RA | 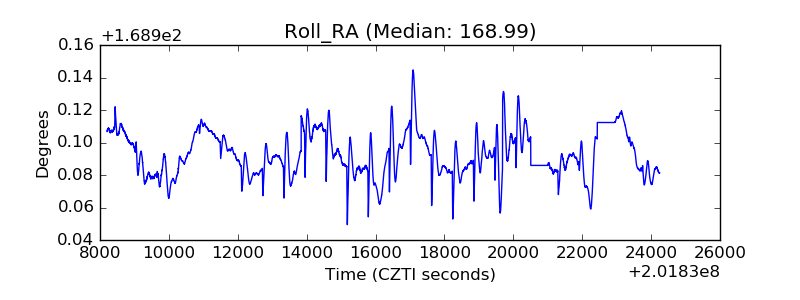 |
| Veto Counter | 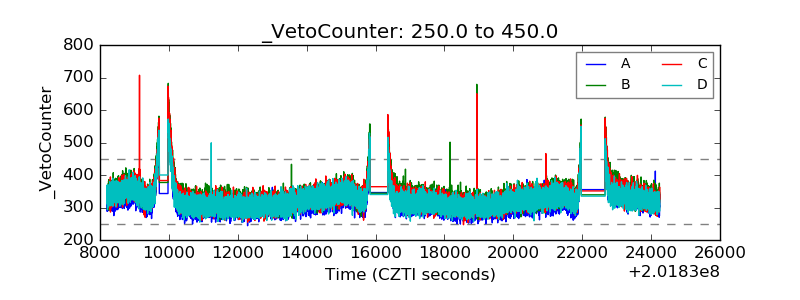 |