| Param | Original file | Final file |
|---|---|---|
| Filename | modeM0/AS1G05_045T01_9000000468_03555cztM0_level2.evt | modeM0/AS1G05_045T01_9000000468_03555cztM0_level2_quad_clean.evt |
| Size (bytes) | 575,766,720 | 67,527,360 |
| Size | 549.1 MB | 64.4 MB |
| Events in quadrant A | 3,027,292 | 405,829 |
| Events in quadrant B | 3,392,730 | 403,367 |
| Events in quadrant C | 7,645,468 | 378,630 |
| Events in quadrant D | 2,917,562 | 389,855 |
| Mode M0 | |||
|---|---|---|---|
| Quadrant | BADHDUFLAG | Total packets | Discarded packets |
| A | 0 | 13723 | 2 |
| B | 0 | 14246 | 1 |
| C | 0 | 27333 | 1 |
| D | 0 | 13807 | 1 |
| Mode M9 | |||
|---|---|---|---|
| Quadrant | BADHDUFLAG | Total packets | Discarded packets |
| A | 0 | 8 | 0 |
| B | 0 | 8 | 0 |
| C | 0 | 8 | 0 |
| D | 0 | 8 | 0 |
| Mode SS | |||
|---|---|---|---|
| Quadrant | BADHDUFLAG | Total packets | Discarded packets |
| A | 0 | 136 | 0 |
| B | 0 | 136 | 0 |
| C | 0 | 136 | 0 |
| D | 0 | 136 | 0 |
| Quadrant | Total seconds | Saturated seconds | Saturation percentage |
|---|---|---|---|
| A | 6692 | 116 | 1.733413% |
| B | 6692 | 125 | 1.867902% |
| C | 6692 | 1317 | 19.680215% |
| D | 6692 | 93 | 1.389719% |
Noise dominated data is calculated using 1-second bins in cleaned event files. If a bin has >2000 counts, and if more than 50% of those come from <1% of pixels, then it is considered to be noise-dominated and hence unusable.
| Quadrant | # 1 sec bins | Bins with >0 counts | Bins with >2000 counts | High rate bins dominated by noise | Noise dominated (total time) | Noise dominated (detector-on time) | Marked lightcurve |
|---|---|---|---|---|---|---|---|
| A | 7507 | 6692 | 0 | 0 | 0.00% | 0.00% | 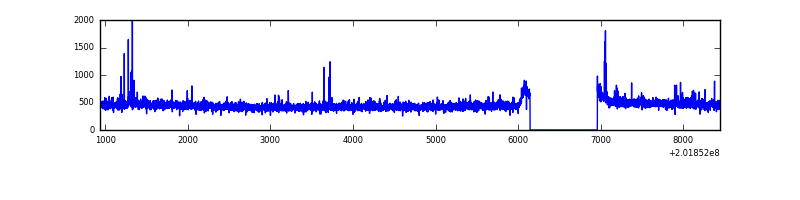 |
| B | 7507 | 6692 | 14 | 14 | 0.19% | 0.21% | 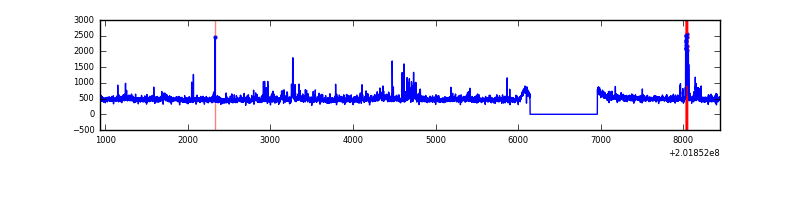 |
| C | 7507 | 6692 | 1325 | 1325 | 17.65% | 19.80% | 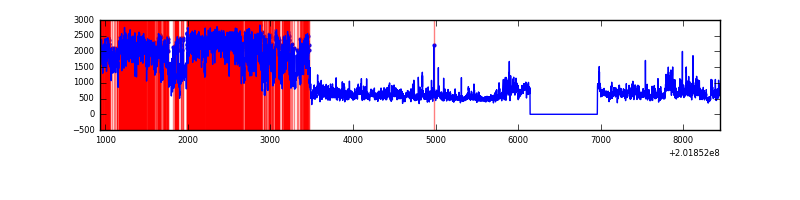 |
| D | 7507 | 6692 | 7 | 7 | 0.09% | 0.10% | 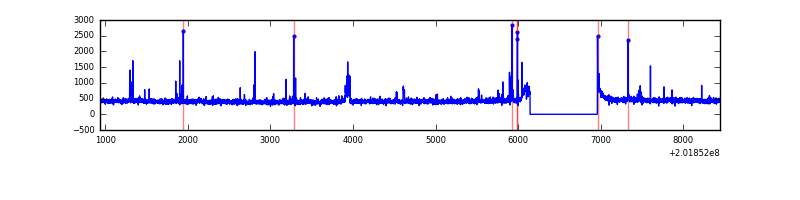 |
Top three noisy pixels from each quadrant. If the there are fewer than three noisy pixels in the level2.evt file, extra rows are filled as -1
| Pixel properties | Quadrant properties | ||||||
|---|---|---|---|---|---|---|---|
| Quadrant | DetID | PixID | Counts | Sigma | Mean | Median | Sigma |
| A | 0 | 50 | 35630 | 221.83 | 767 | 750 | 157.2 |
| A | 0 | 118 | 15633 | 94.65 | 767 | 750 | 157.2 |
| A | 7 | 16 | 9889 | 58.12 | 767 | 750 | 157.2 |
| B | 15 | 204 | 140274 | 927.88 | 776 | 757 | 150.4 |
| B | 4 | 81 | 109821 | 725.35 | 776 | 757 | 150.4 |
| B | 0 | 182 | 47667 | 311.98 | 776 | 757 | 150.4 |
| C | 1 | 192 | 4778609 | 28303.32 | 718 | 721 | 168.8 |
| C | 2 | 53 | 20685 | 118.26 | 718 | 721 | 168.8 |
| C | 1 | 16 | 13859 | 77.83 | 718 | 721 | 168.8 |
| D | 13 | 223 | 29811 | 163.72 | 738 | 716 | 177.7 |
| D | 4 | 95 | 19736 | 107.02 | 738 | 716 | 177.7 |
| D | 7 | 223 | 18862 | 102.11 | 738 | 716 | 177.7 |
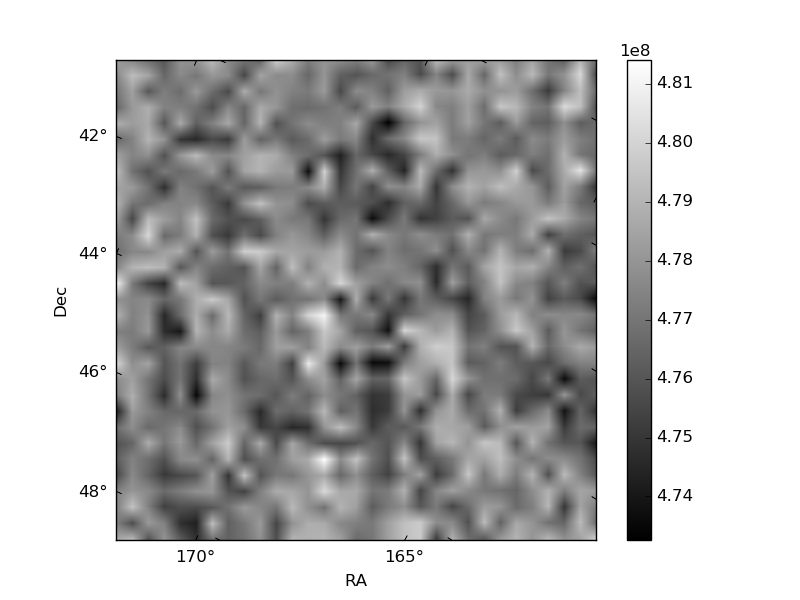
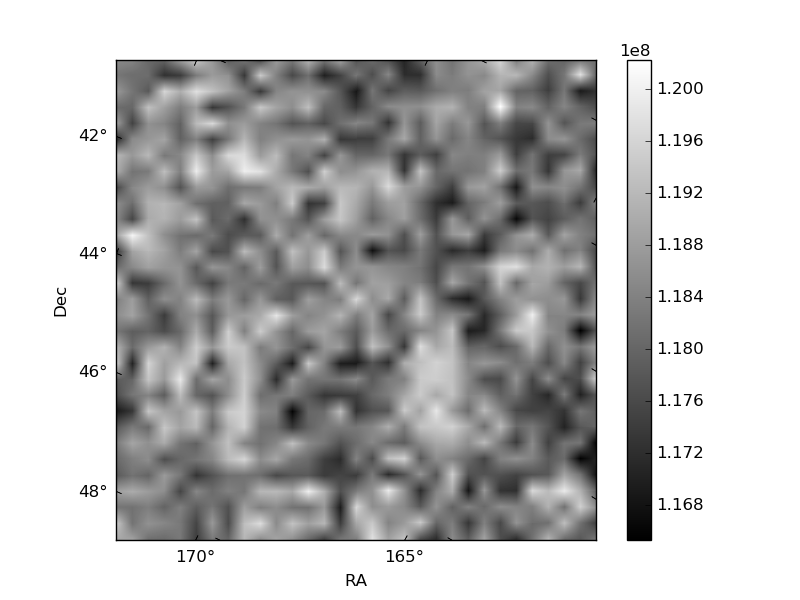
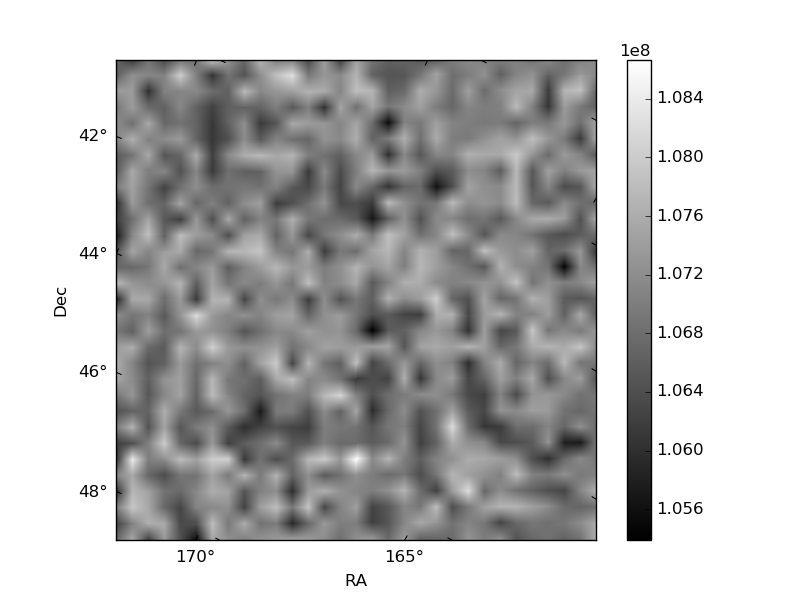
Histogram calculated using DETX and DETY for each event in the final _common_clean file
| Quadrant A |  |
 |
Quadrant B |
|---|---|---|---|
| Quadrant D |  |
 |
Quadrant C |
| Plot type | Count rate plots | Images |
|---|---|---|
| Comparison with Poisson distribution Blue bars denote a histogram of data divided into 1 sec bins. Red curve is a Poisson curve with rate = median count rate of data. |
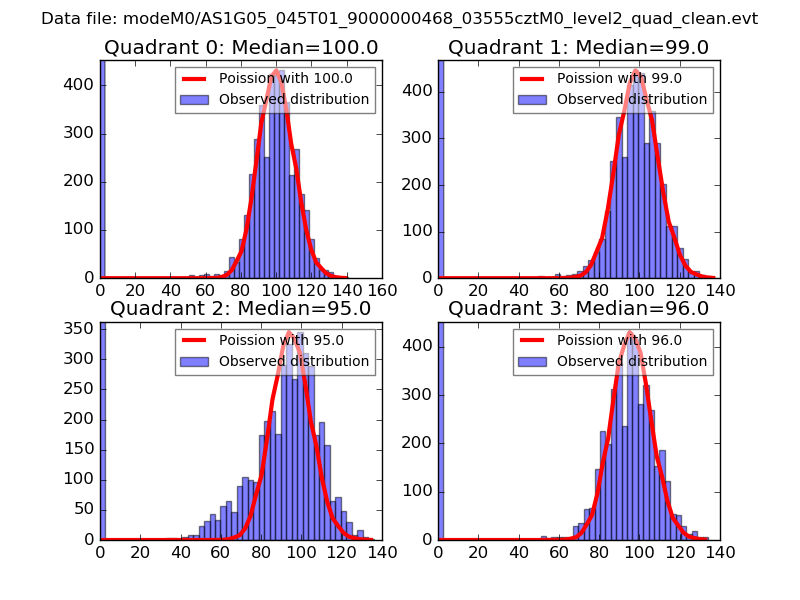 |
 |
| Quadrant-wise count rates Data is divided into 100 sec bins |
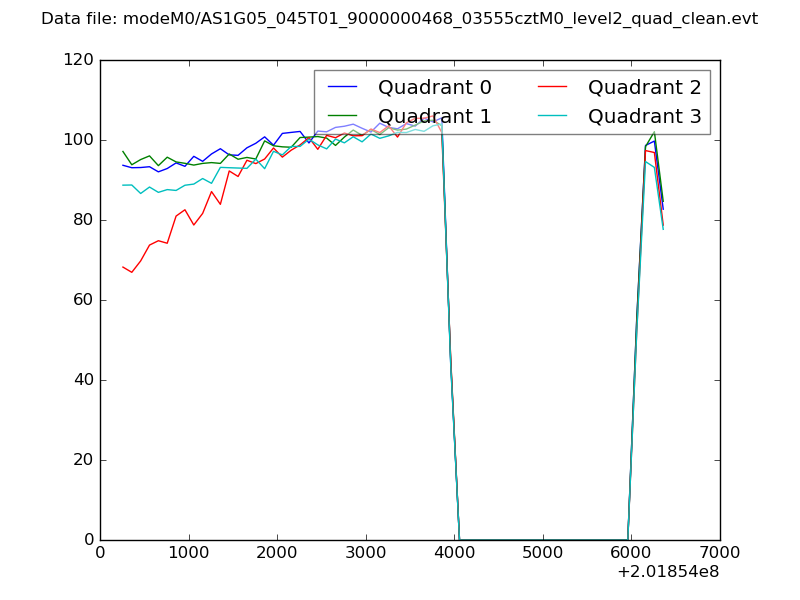 |
|
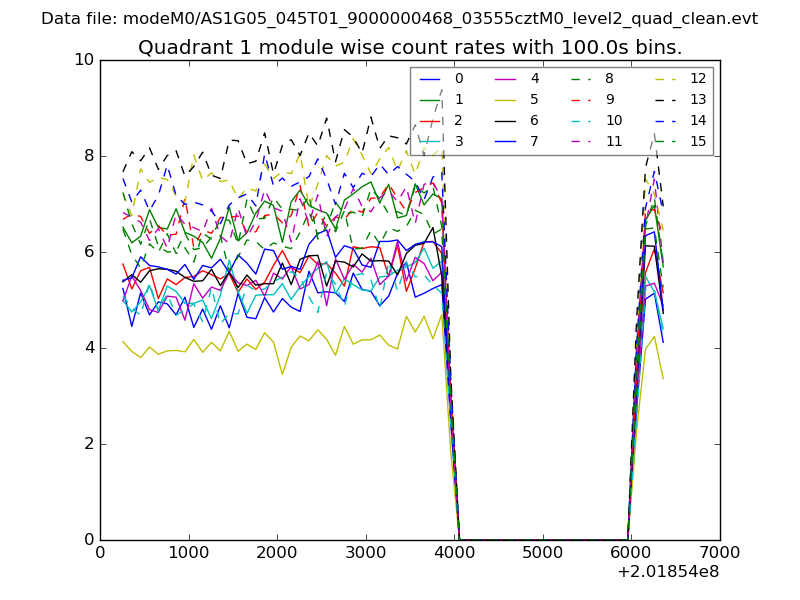
| Module-wise count rates for Quadrant A Data is divided into 100 sec bins |
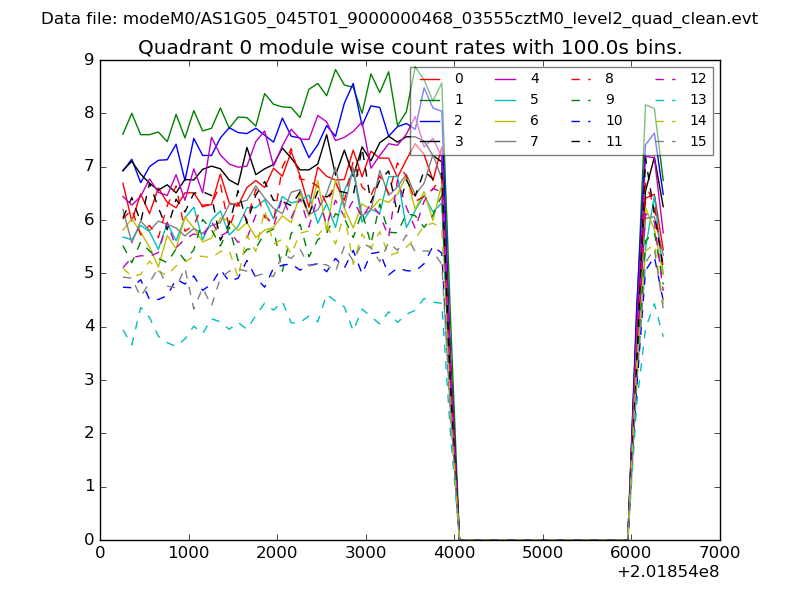 |
 |
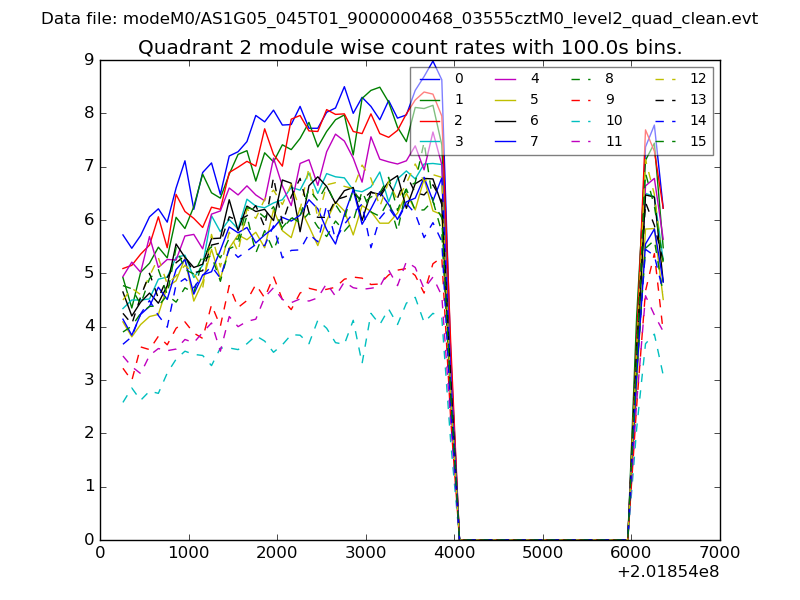
| Module-wise count rates for Quadrant B Data is divided into 100 sec bins |
 |
 |
| Module-wise count rates for Quadrant C Data is divided into 100 sec bins |
 |
 |
| Module-wise count rates for Quadrant D Data is divided into 100 sec bins |
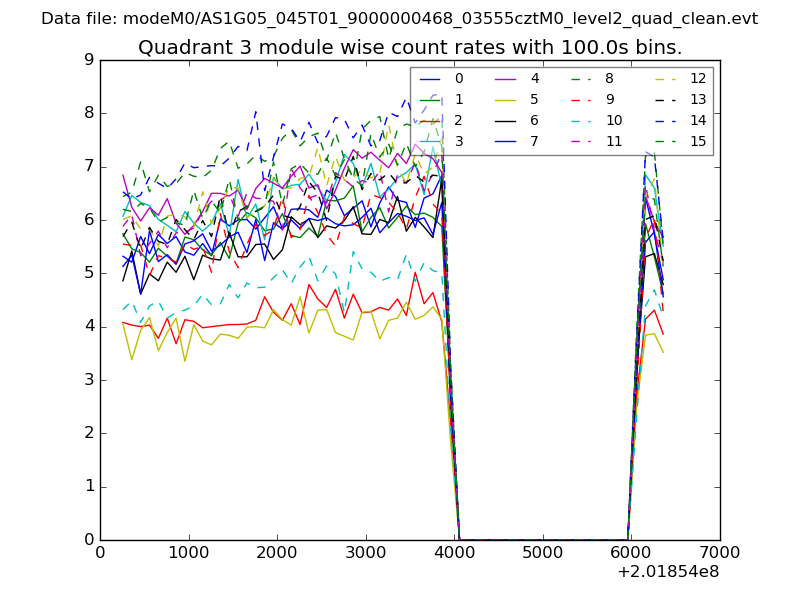 |
 |
| Parameter | Plot |
|---|---|
| CZT HV Monitor | 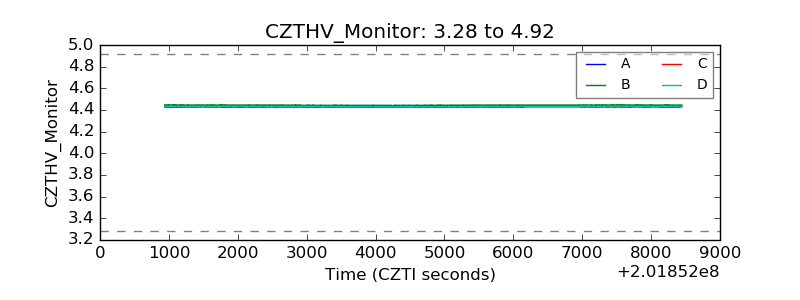 |
| D_VDD | 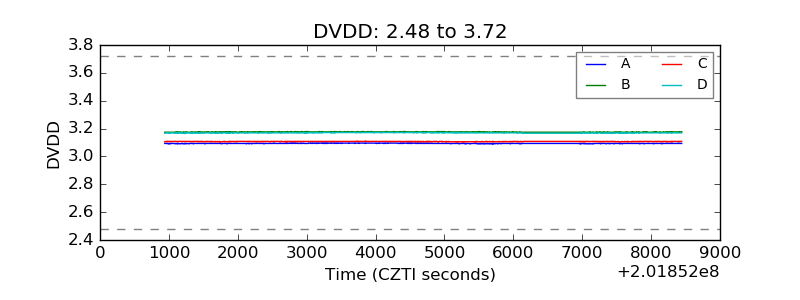 |
| Temperature 1 | 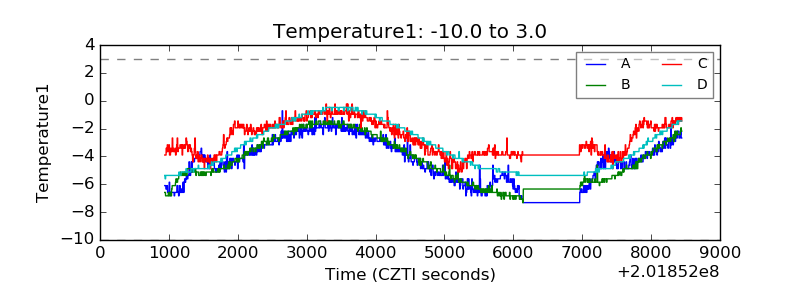 |
| Veto HV Monitor | 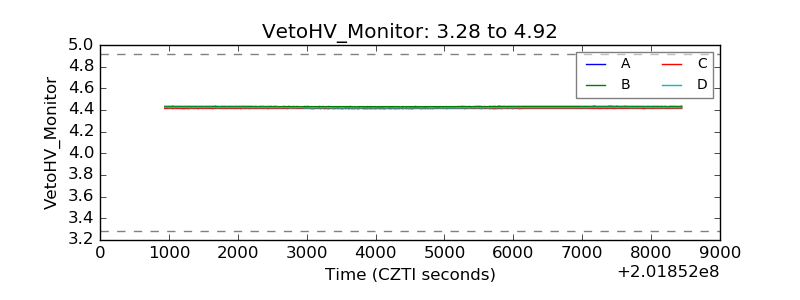 |
| Veto LLD | 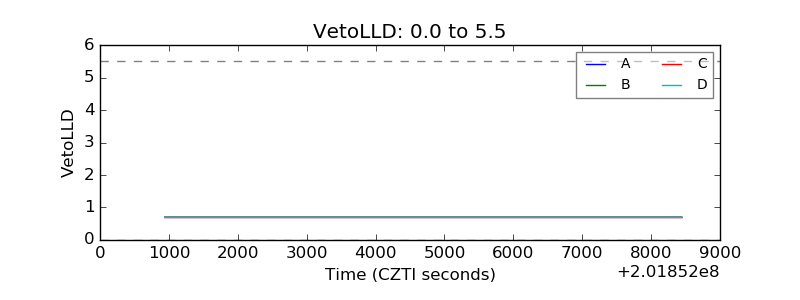 |
| Alpha Counter | 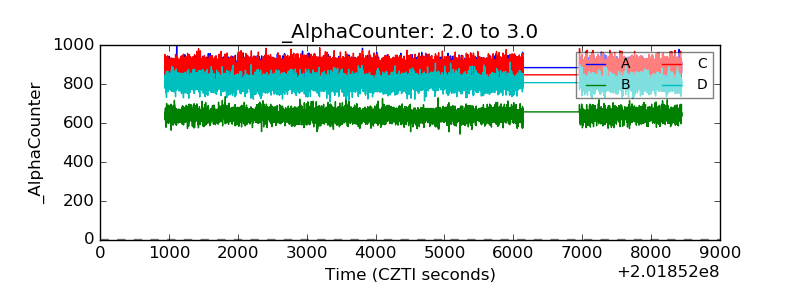 |
| _CPM_Rate | 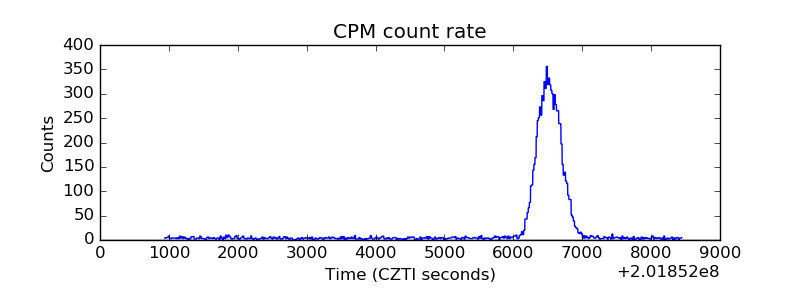 |
| CZT Counter |  |
| +2.5 Volts monitor |  |
| +5 Volts monitor |  |
| _ROLL_ROT | 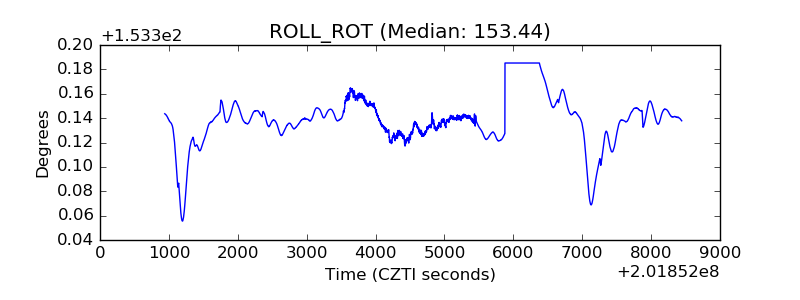 |
| _Roll_DEC | 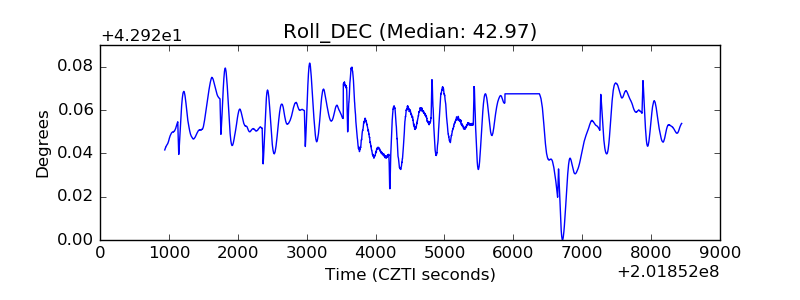 |
| _Roll_RA | 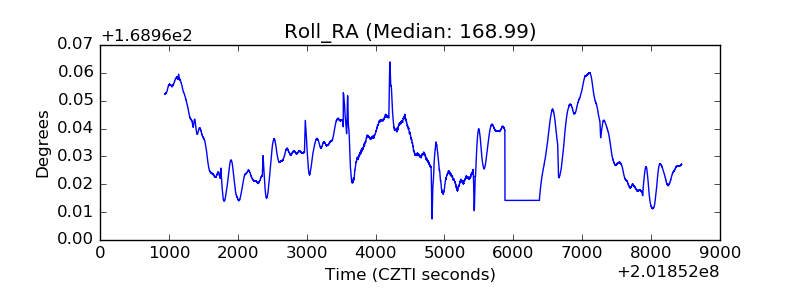 |
| Veto Counter | 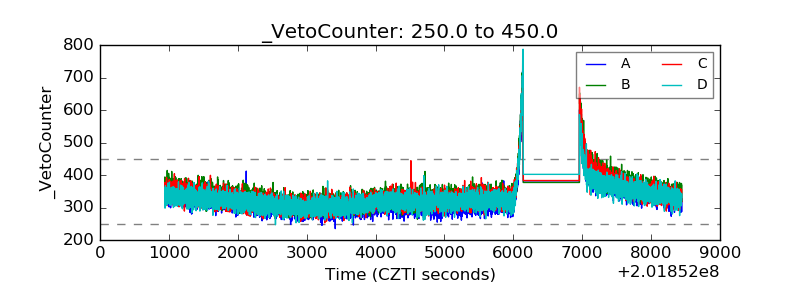 |