| Param | Original file | Final file |
|---|---|---|
| Filename | modeM0/AS1G05_045T01_9000000468_03556cztM0_level2.evt | modeM0/AS1G05_045T01_9000000468_03556cztM0_level2_quad_clean.evt |
| Size (bytes) | 461,148,480 | 76,279,680 |
| Size | 439.8 MB | 72.7 MB |
| Events in quadrant A | 3,246,388 | 466,726 |
| Events in quadrant B | 3,653,840 | 465,259 |
| Events in quadrant C | 3,503,137 | 451,437 |
| Events in quadrant D | 3,096,729 | 448,911 |
| Mode M0 | |||
|---|---|---|---|
| Quadrant | BADHDUFLAG | Total packets | Discarded packets |
| A | 0 | 14311 | 3 |
| B | 0 | 15128 | 2 |
| C | 0 | 15446 | 2 |
| D | 0 | 14271 | 2 |
| Mode M9 | |||
|---|---|---|---|
| Quadrant | BADHDUFLAG | Total packets | Discarded packets |
| A | 0 | 15 | 0 |
| B | 0 | 15 | 0 |
| C | 0 | 15 | 0 |
| D | 0 | 16 | 0 |
| Mode SS | |||
|---|---|---|---|
| Quadrant | BADHDUFLAG | Total packets | Discarded packets |
| A | 0 | 140 | 0 |
| B | 0 | 140 | 0 |
| C | 0 | 140 | 0 |
| D | 0 | 140 | 0 |
| Quadrant | Total seconds | Saturated seconds | Saturation percentage |
|---|---|---|---|
| A | 6870 | 115 | 1.673945% |
| B | 6870 | 144 | 2.096070% |
| C | 6792 | 84 | 1.236749% |
| D | 6870 | 101 | 1.470160% |
Noise dominated data is calculated using 1-second bins in cleaned event files. If a bin has >2000 counts, and if more than 50% of those come from <1% of pixels, then it is considered to be noise-dominated and hence unusable.
| Quadrant | # 1 sec bins | Bins with >0 counts | Bins with >2000 counts | High rate bins dominated by noise | Noise dominated (total time) | Noise dominated (detector-on time) | Marked lightcurve |
|---|---|---|---|---|---|---|---|
| A | 7880 | 6870 | 11 | 11 | 0.14% | 0.16% | 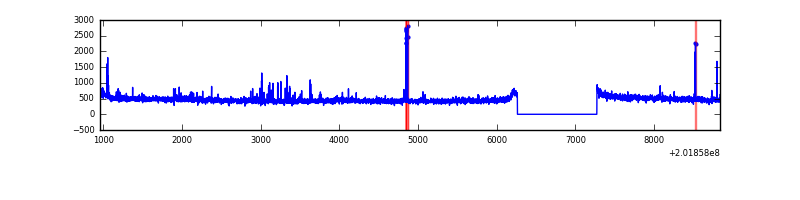 |
| B | 7880 | 6870 | 28 | 28 | 0.36% | 0.41% | 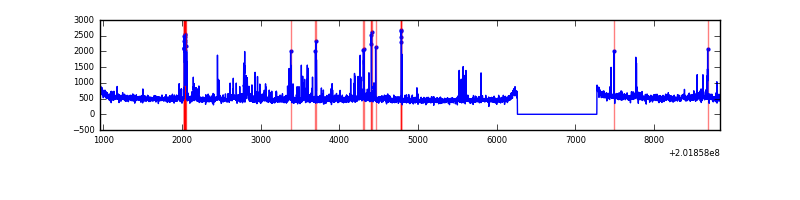 |
| C | 7880 | 6793 | 10 | 10 | 0.13% | 0.15% | 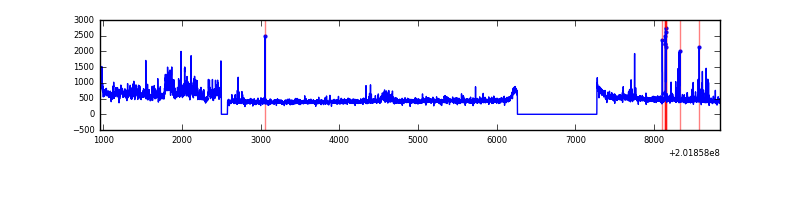 |
| D | 7880 | 6870 | 30 | 30 | 0.38% | 0.44% | 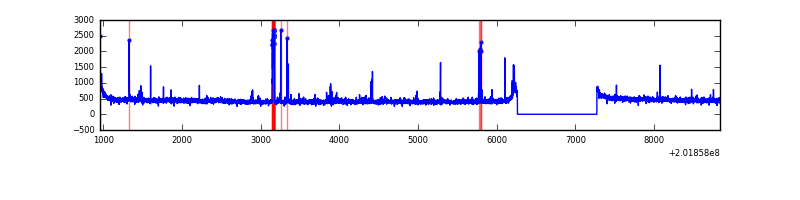 |
Top three noisy pixels from each quadrant. If the there are fewer than three noisy pixels in the level2.evt file, extra rows are filled as -1
| Pixel properties | Quadrant properties | ||||||
|---|---|---|---|---|---|---|---|
| Quadrant | DetID | PixID | Counts | Sigma | Mean | Median | Sigma |
| A | 0 | 118 | 48973 | 290.97 | 805 | 786 | 165.6 |
| A | 3 | 1 | 34716 | 204.88 | 805 | 786 | 165.6 |
| A | 15 | 174 | 24515 | 143.28 | 805 | 786 | 165.6 |
| B | 4 | 81 | 215661 | 1348.59 | 809 | 788 | 159.3 |
| B | 15 | 204 | 129329 | 806.75 | 809 | 788 | 159.3 |
| B | 14 | 167 | 35836 | 219.97 | 809 | 788 | 159.3 |
| C | 1 | 192 | 337955 | 1871.99 | 767 | 768 | 180.1 |
| C | 15 | 208 | 93903 | 517.07 | 767 | 768 | 180.1 |
| C | 2 | 53 | 38681 | 210.49 | 767 | 768 | 180.1 |
| D | 13 | 223 | 86943 | 460.8 | 775 | 752 | 187.0 |
| D | 5 | 233 | 20268 | 104.34 | 775 | 752 | 187.0 |
| D | 13 | 239 | 14433 | 73.14 | 775 | 752 | 187.0 |
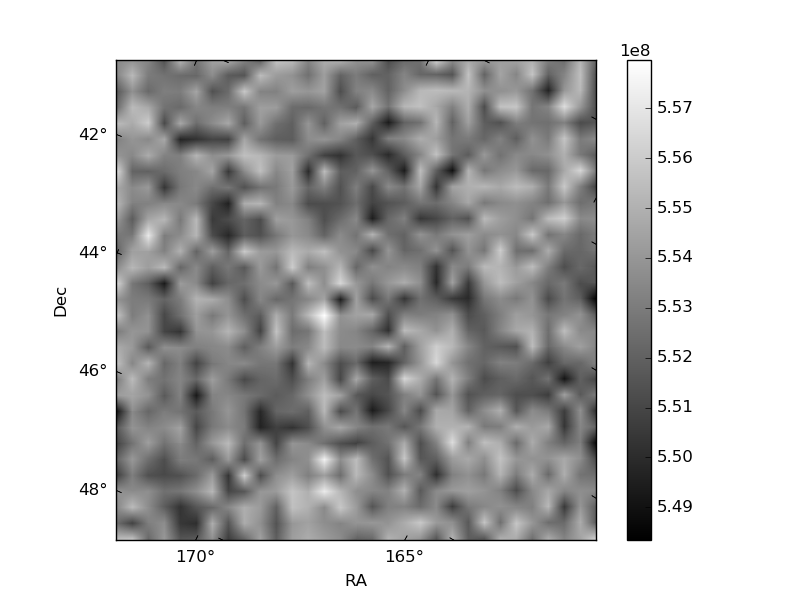
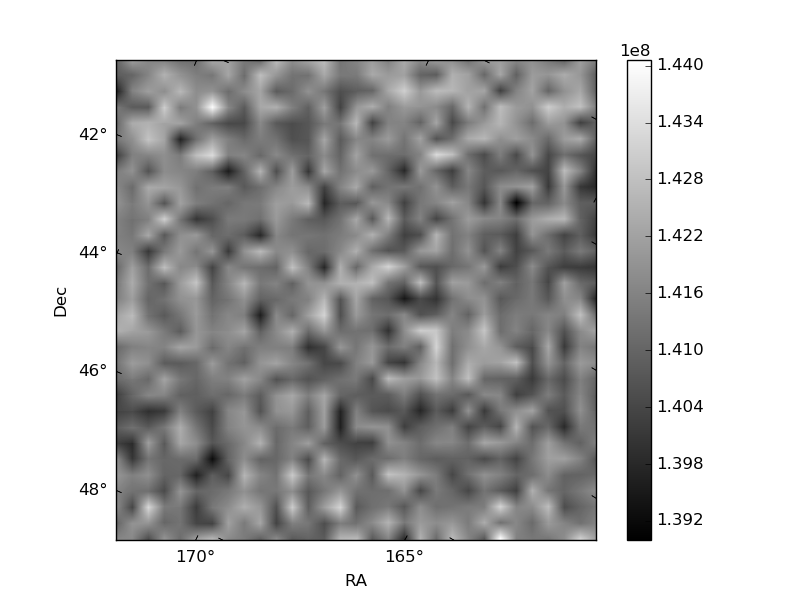
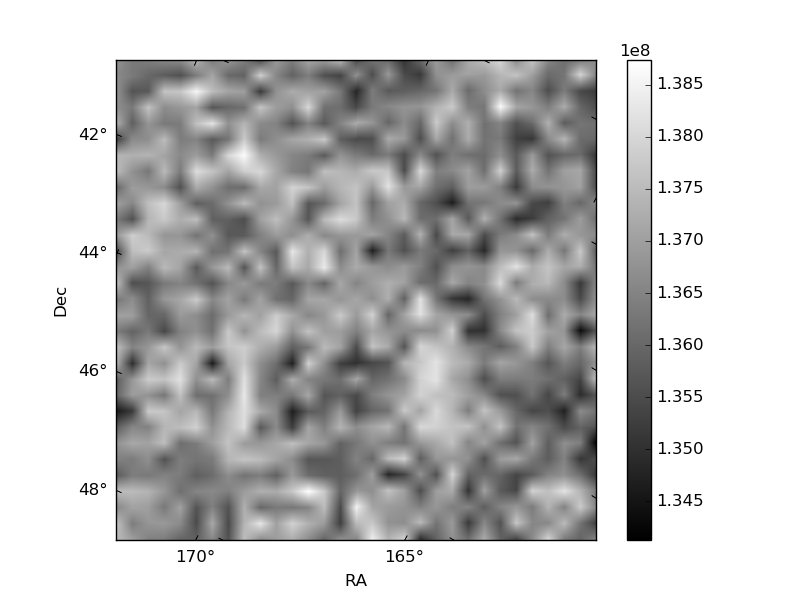
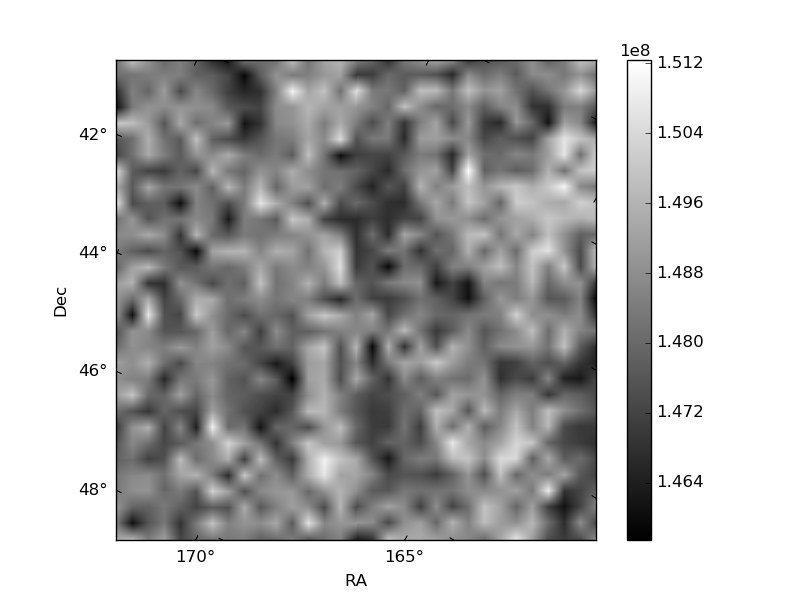
Histogram calculated using DETX and DETY for each event in the final _common_clean file
| Quadrant A | 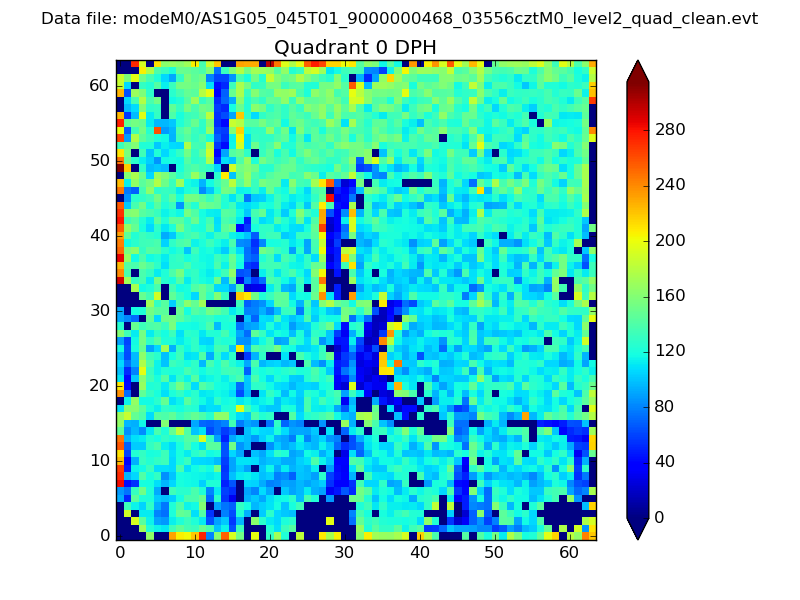 |
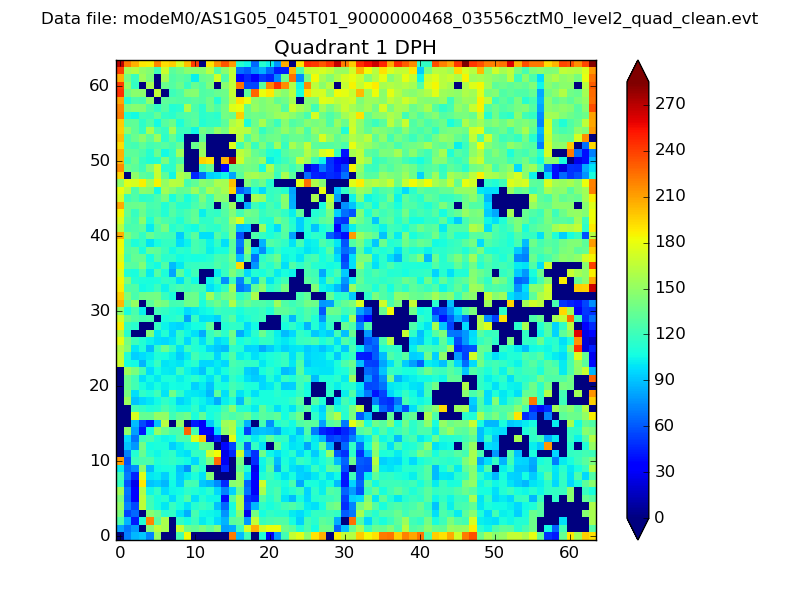 |
Quadrant B |
|---|---|---|---|
| Quadrant D | 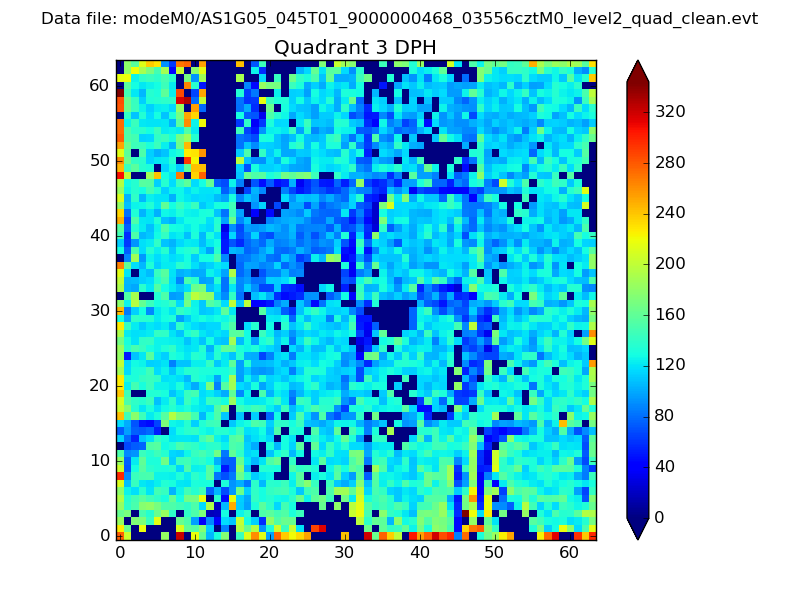 |
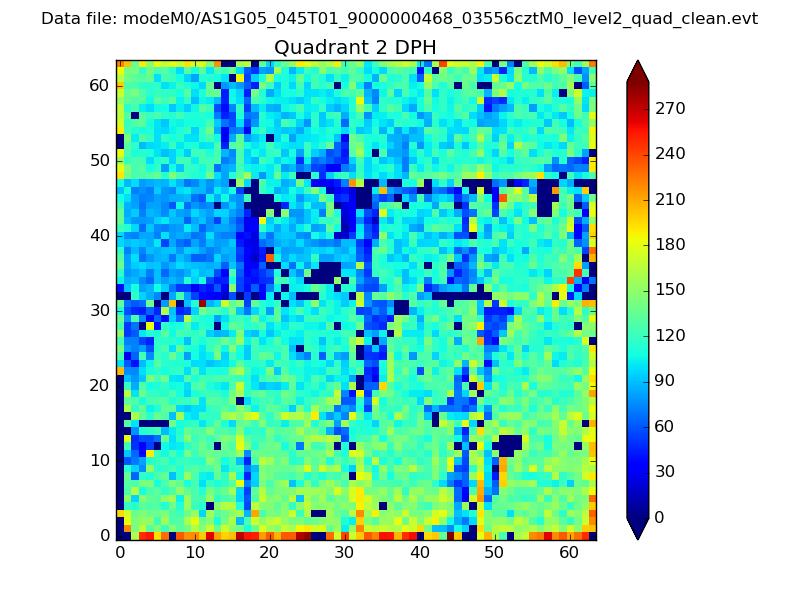 |
Quadrant C |
| Plot type | Count rate plots | Images |
|---|---|---|
| Comparison with Poisson distribution Blue bars denote a histogram of data divided into 1 sec bins. Red curve is a Poisson curve with rate = median count rate of data. |
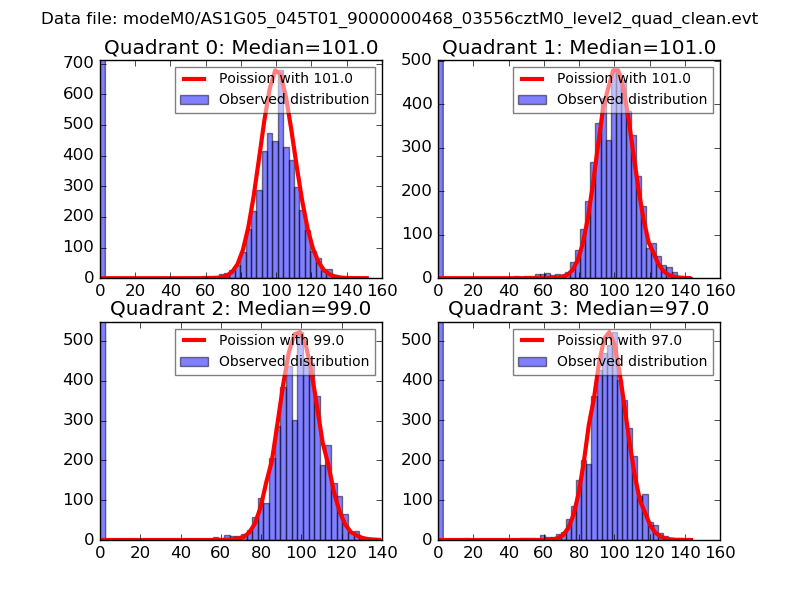 |
 |
| Quadrant-wise count rates Data is divided into 100 sec bins |
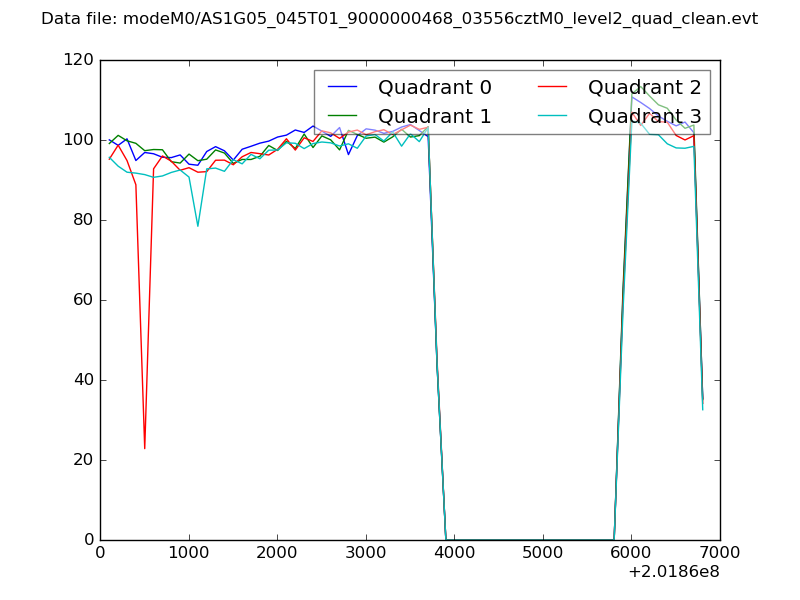 |
|
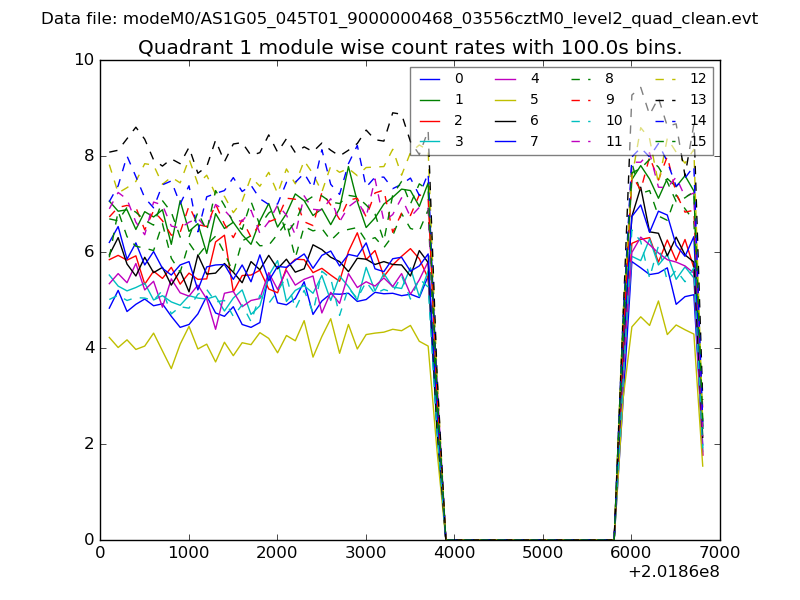
| Module-wise count rates for Quadrant A Data is divided into 100 sec bins |
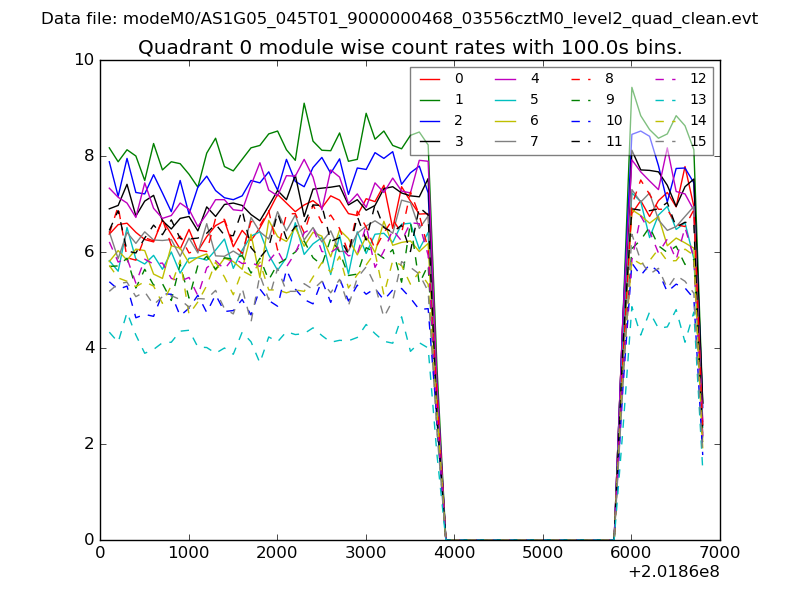 |
 |
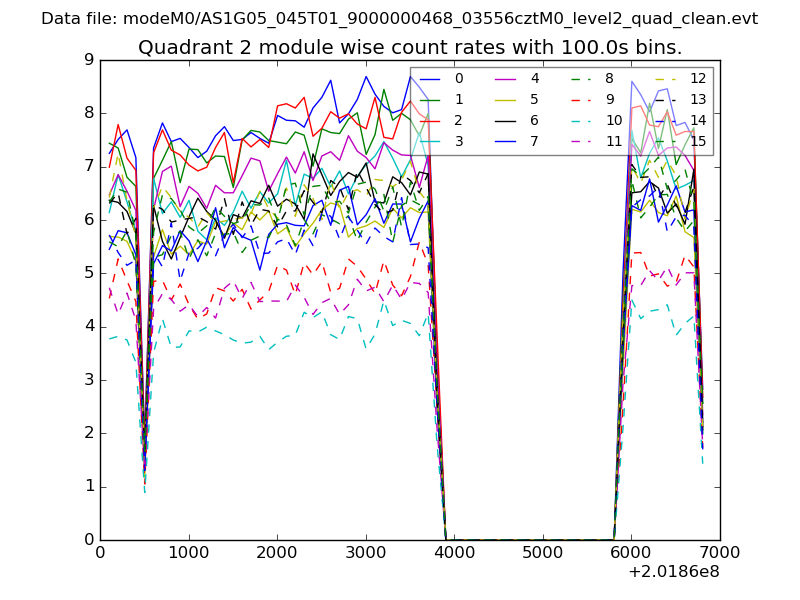
| Module-wise count rates for Quadrant B Data is divided into 100 sec bins |
 |
 |
| Module-wise count rates for Quadrant C Data is divided into 100 sec bins |
 |
 |
| Module-wise count rates for Quadrant D Data is divided into 100 sec bins |
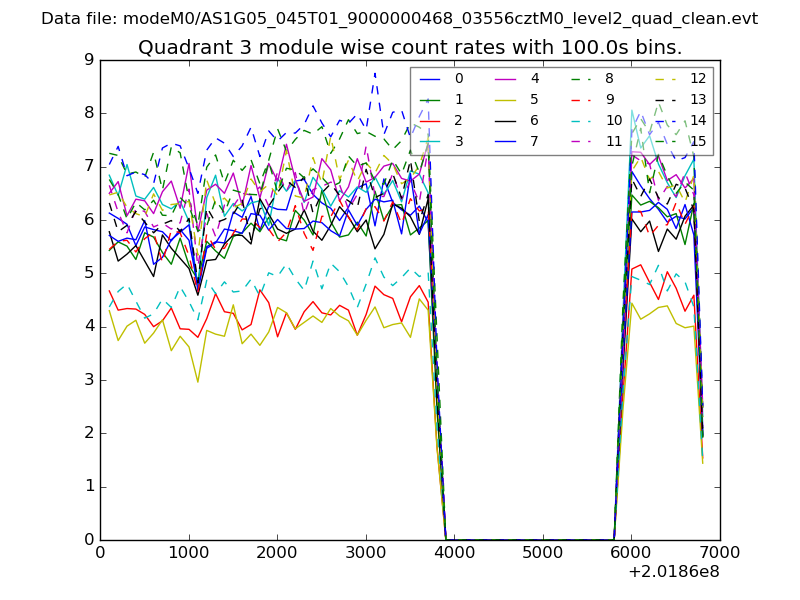 |
 |
| Parameter | Plot |
|---|---|
| CZT HV Monitor | 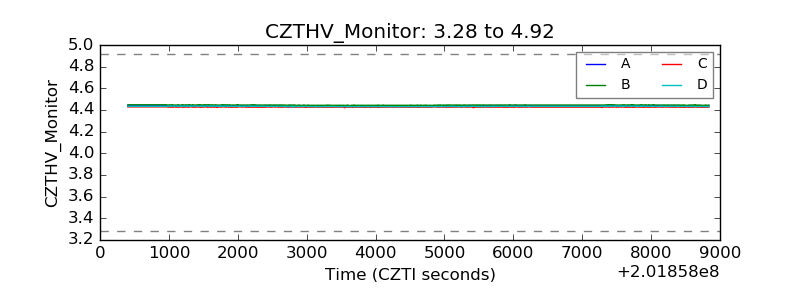 |
| D_VDD | 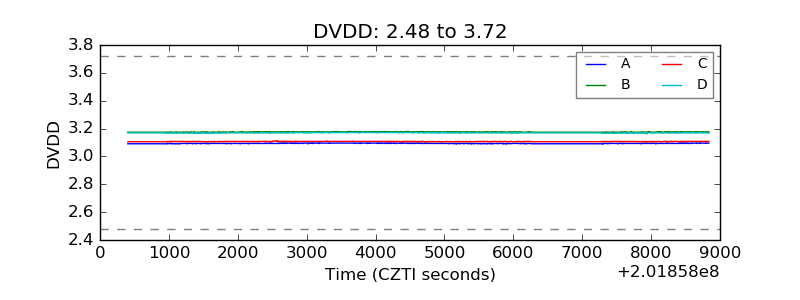 |
| Temperature 1 | 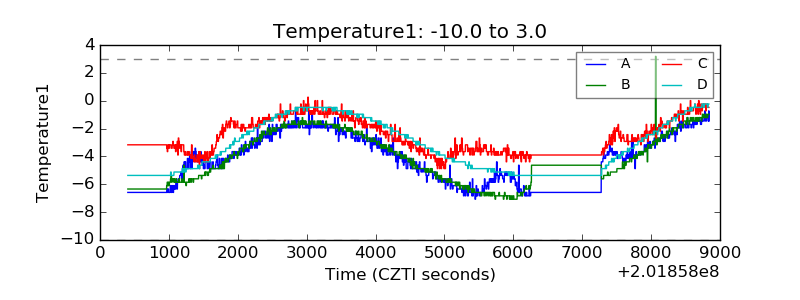 |
| Veto HV Monitor |  |
| Veto LLD | 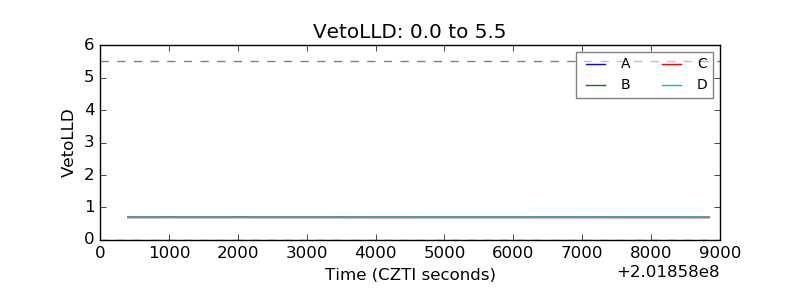 |
| Alpha Counter | 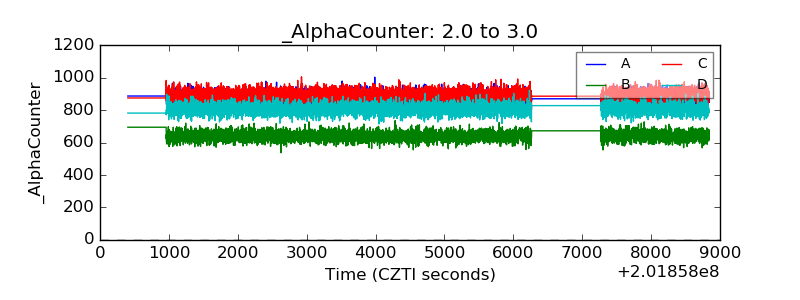 |
| _CPM_Rate | 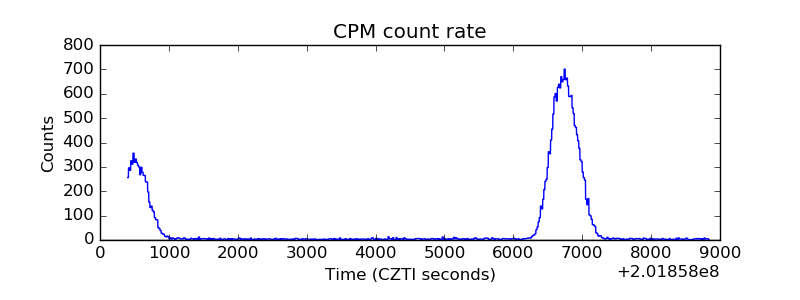 |
| CZT Counter | 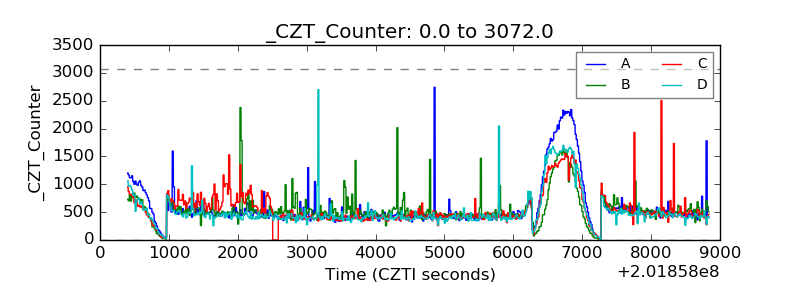 |
| +2.5 Volts monitor |  |
| +5 Volts monitor | 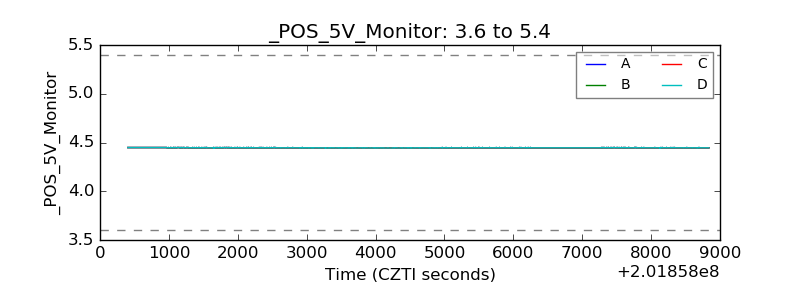 |
| _ROLL_ROT | 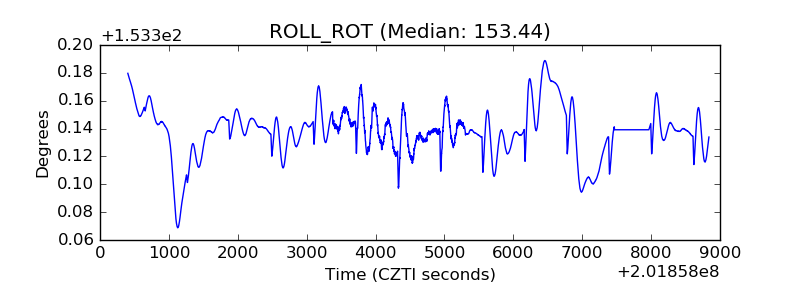 |
| _Roll_DEC | 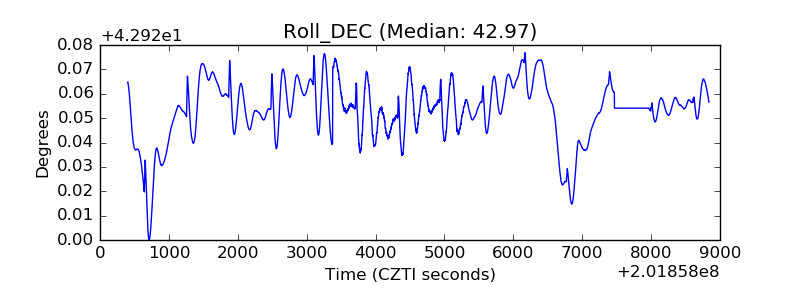 |
| _Roll_RA | 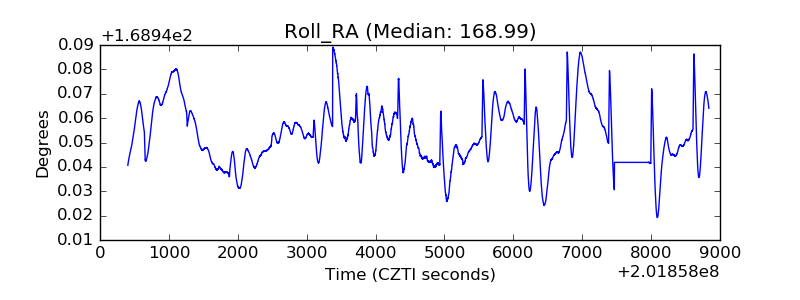 |
| Veto Counter |  |