| Param | Original file | Final file |
|---|---|---|
| Filename | modeM0/AS1G05_045T01_9000000468_03558cztM0_level2.evt | modeM0/AS1G05_045T01_9000000468_03558cztM0_level2_quad_clean.evt |
| Size (bytes) | 423,115,200 | 84,781,440 |
| Size | 403.5 MB | 80.9 MB |
| Events in quadrant A | 3,042,804 | 544,172 |
| Events in quadrant B | 3,273,986 | 544,167 |
| Events in quadrant C | 3,256,927 | 531,402 |
| Events in quadrant D | 2,825,550 | 521,717 |
| Mode M0 | |||
|---|---|---|---|
| Quadrant | BADHDUFLAG | Total packets | Discarded packets |
| A | 0 | 13174 | 2 |
| B | 0 | 13460 | 1 |
| C | 0 | 13873 | 1 |
| D | 0 | 12758 | 1 |
| Mode M9 | |||
|---|---|---|---|
| Quadrant | BADHDUFLAG | Total packets | Discarded packets |
| A | 0 | 11 | 0 |
| B | 0 | 11 | 0 |
| C | 0 | 11 | 0 |
| D | 0 | 11 | 0 |
| Mode SS | |||
|---|---|---|---|
| Quadrant | BADHDUFLAG | Total packets | Discarded packets |
| A | 0 | 124 | 0 |
| B | 0 | 124 | 0 |
| C | 0 | 124 | 0 |
| D | 0 | 124 | 0 |
| Quadrant | Total seconds | Saturated seconds | Saturation percentage |
|---|---|---|---|
| A | 6099 | 158 | 2.590589% |
| B | 6099 | 101 | 1.656009% |
| C | 6099 | 112 | 1.836367% |
| D | 6099 | 85 | 1.393671% |
Noise dominated data is calculated using 1-second bins in cleaned event files. If a bin has >2000 counts, and if more than 50% of those come from <1% of pixels, then it is considered to be noise-dominated and hence unusable.
| Quadrant | # 1 sec bins | Bins with >0 counts | Bins with >2000 counts | High rate bins dominated by noise | Noise dominated (total time) | Noise dominated (detector-on time) | Marked lightcurve |
|---|---|---|---|---|---|---|---|
| A | 7199 | 6099 | 52 | 52 | 0.72% | 0.85% | 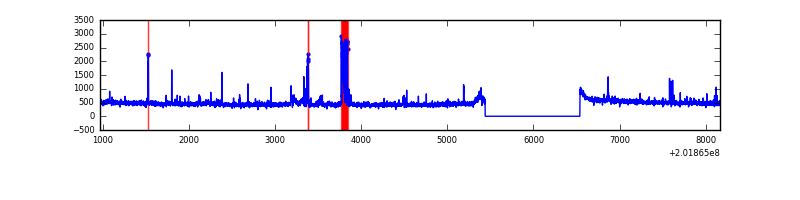 |
| B | 7199 | 6099 | 10 | 10 | 0.14% | 0.16% | 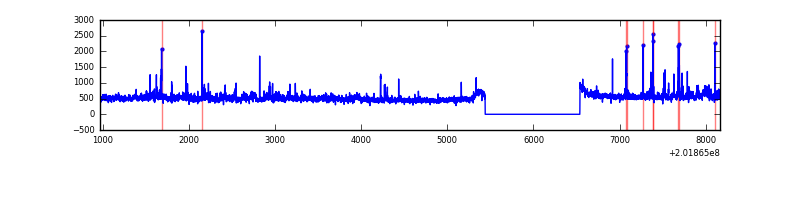 |
| C | 7199 | 6099 | 36 | 36 | 0.50% | 0.59% | 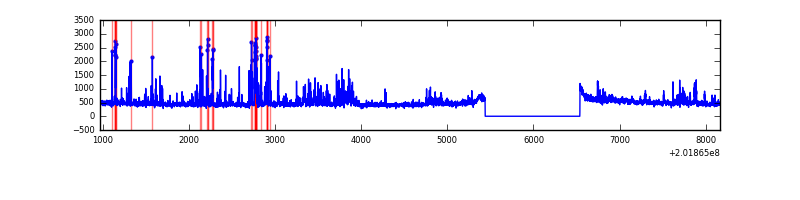 |
| D | 7199 | 6099 | 12 | 12 | 0.17% | 0.20% | 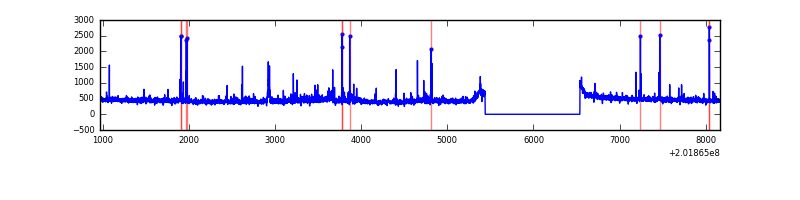 |
Top three noisy pixels from each quadrant. If the there are fewer than three noisy pixels in the level2.evt file, extra rows are filled as -1
| Pixel properties | Quadrant properties | ||||||
|---|---|---|---|---|---|---|---|
| Quadrant | DetID | PixID | Counts | Sigma | Mean | Median | Sigma |
| A | 0 | 118 | 147484 | 1000.47 | 717 | 699 | 146.7 |
| A | 12 | 113 | 40286 | 269.82 | 717 | 699 | 146.7 |
| A | 3 | 1 | 28370 | 188.6 | 717 | 699 | 146.7 |
| B | 15 | 204 | 217095 | 1565.23 | 720 | 702 | 138.3 |
| B | 14 | 167 | 55759 | 398.24 | 720 | 702 | 138.3 |
| B | 4 | 81 | 52740 | 376.4 | 720 | 702 | 138.3 |
| C | 15 | 208 | 523961 | 3248.41 | 691 | 693 | 161.1 |
| C | 1 | 16 | 14431 | 85.28 | 691 | 693 | 161.1 |
| C | 2 | 53 | 11594 | 67.67 | 691 | 693 | 161.1 |
| D | 5 | 233 | 58209 | 340.55 | 697 | 676 | 168.9 |
| D | 13 | 223 | 41756 | 243.16 | 697 | 676 | 168.9 |
| D | 2 | 37 | 31648 | 183.33 | 697 | 676 | 168.9 |
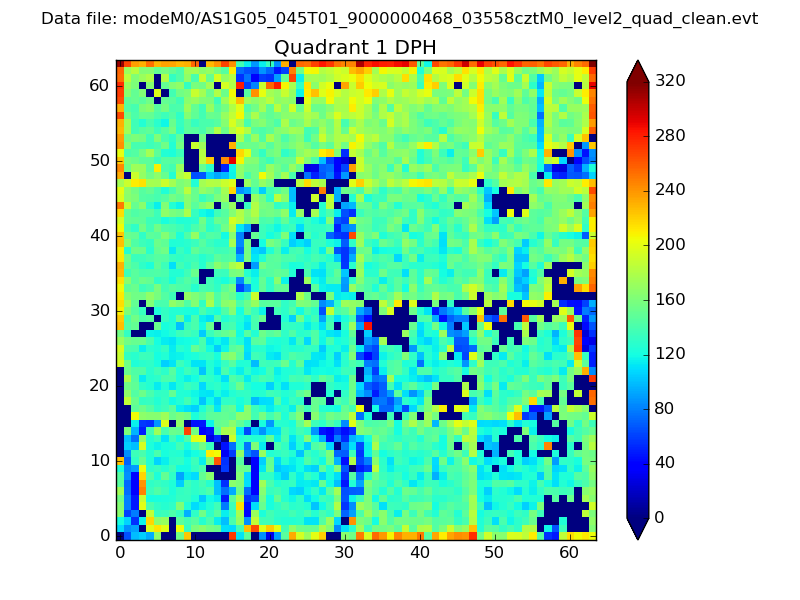
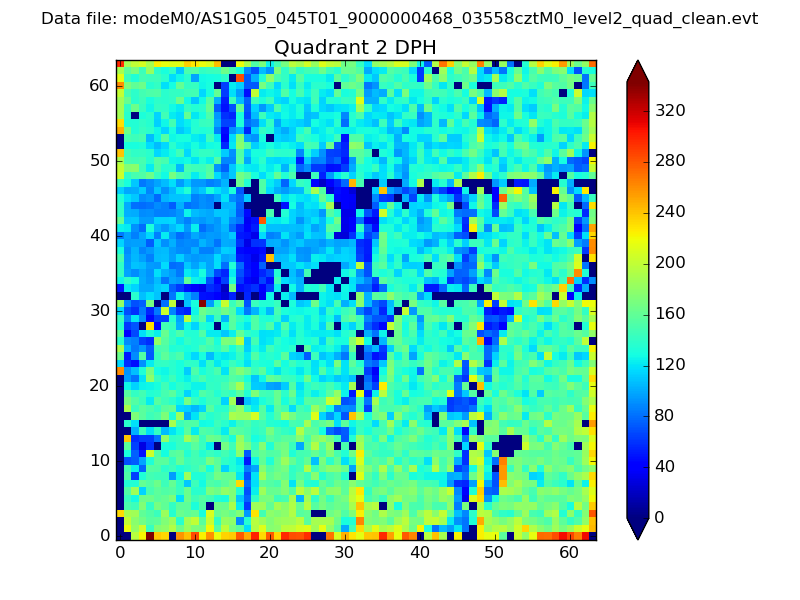
Histogram calculated using DETX and DETY for each event in the final _common_clean file
| Quadrant A |  |
 |
Quadrant B |
|---|---|---|---|
| Quadrant D |  |
 |
Quadrant C |
| Plot type | Count rate plots | Images |
|---|---|---|
| Comparison with Poisson distribution Blue bars denote a histogram of data divided into 1 sec bins. Red curve is a Poisson curve with rate = median count rate of data. |
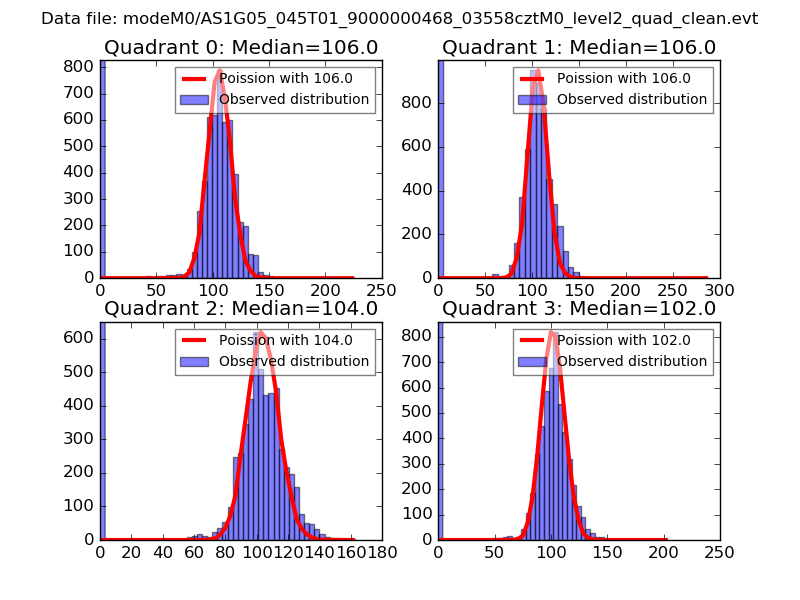 |
 |
| Quadrant-wise count rates Data is divided into 100 sec bins |
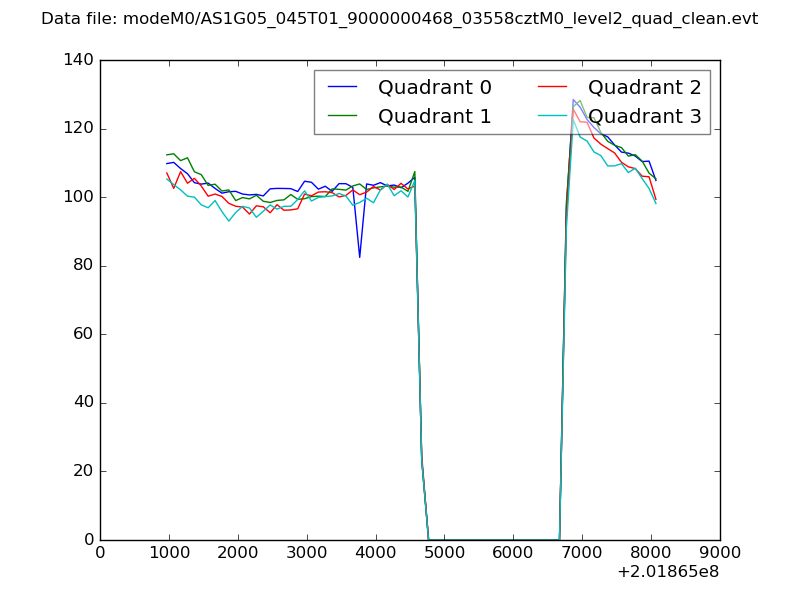 |
|
| Module-wise count rates for Quadrant A Data is divided into 100 sec bins |
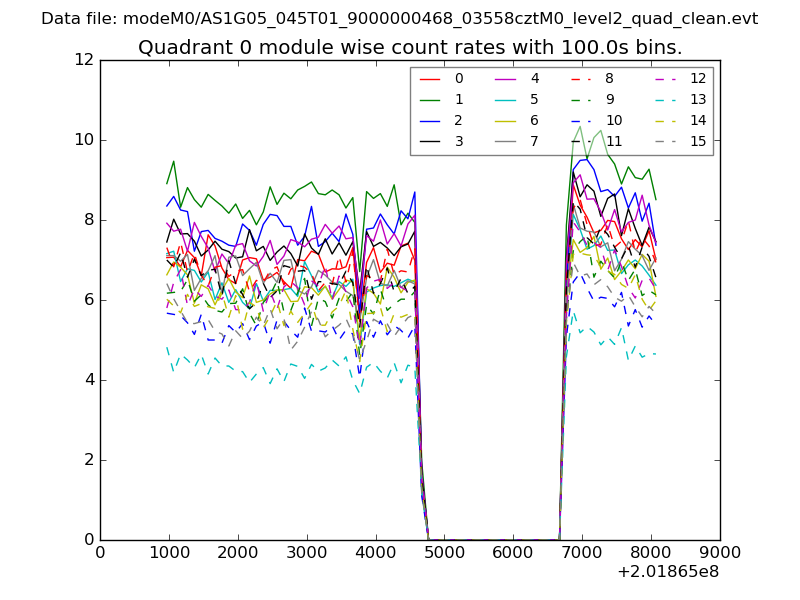 |
 |
| Module-wise count rates for Quadrant B Data is divided into 100 sec bins |
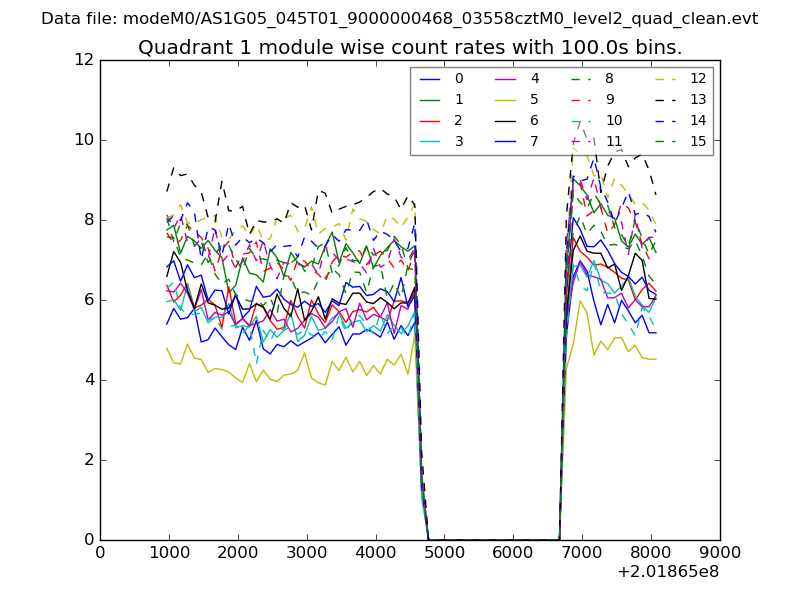 |
 |
| Module-wise count rates for Quadrant C Data is divided into 100 sec bins |
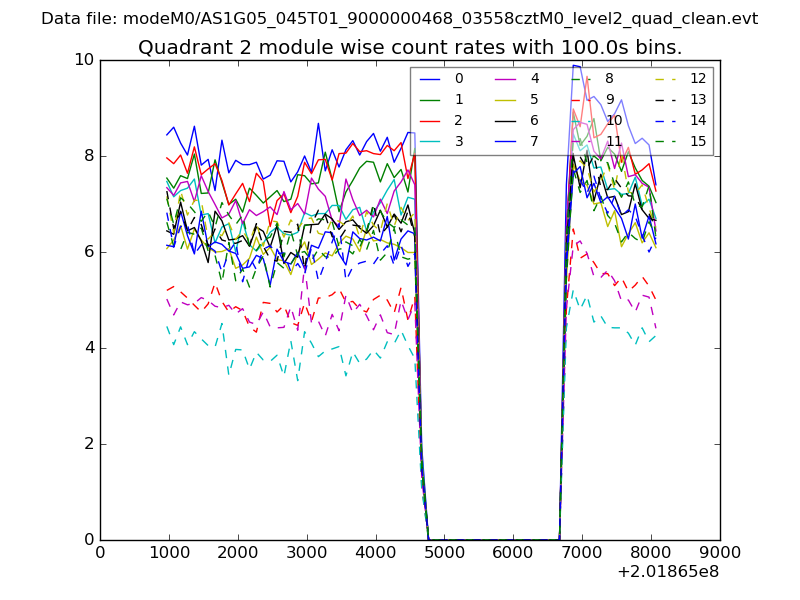 |
 |
| Module-wise count rates for Quadrant D Data is divided into 100 sec bins |
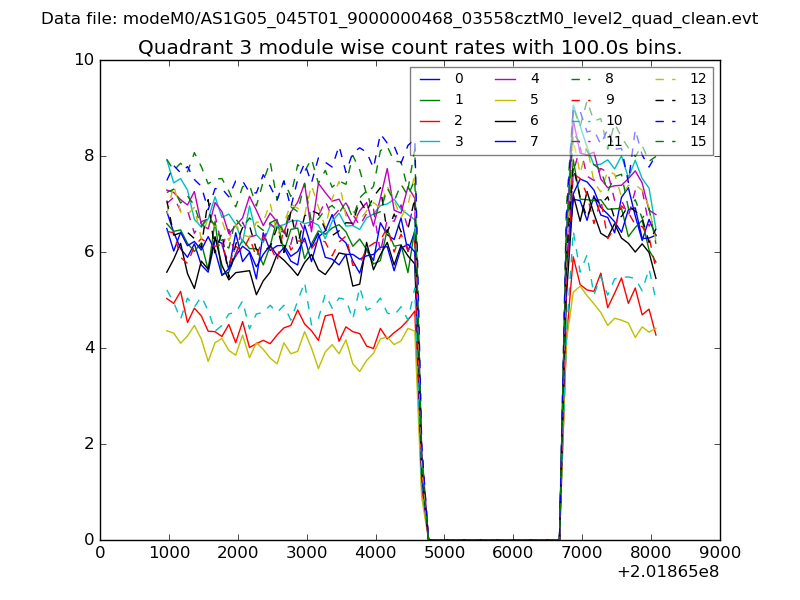 |
 |
| Parameter | Plot |
|---|---|
| CZT HV Monitor | 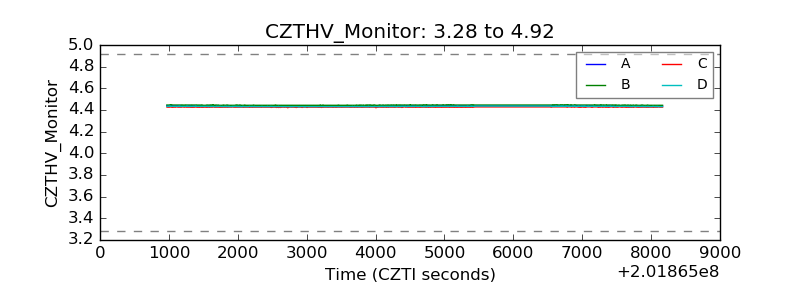 |
| D_VDD | 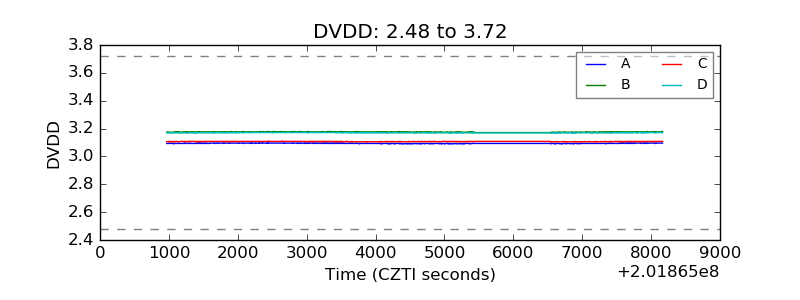 |
| Temperature 1 | 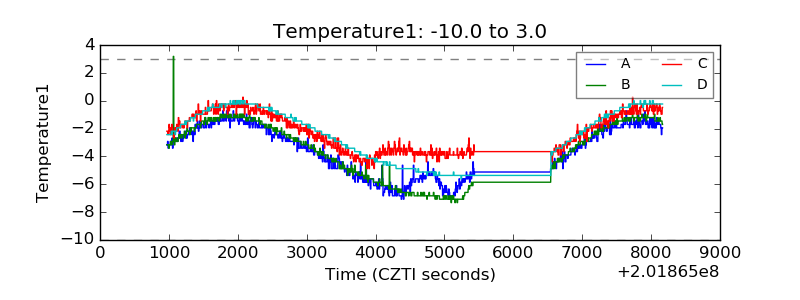 |
| Veto HV Monitor | 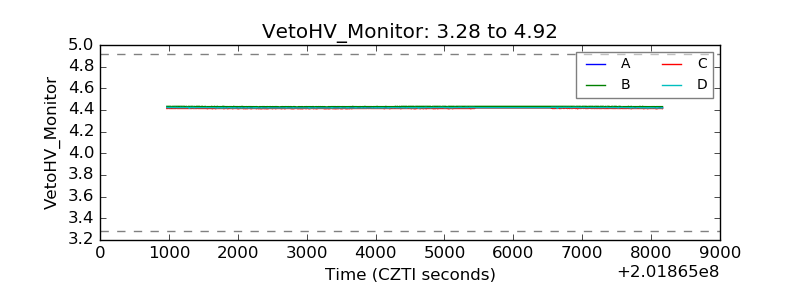 |
| Veto LLD | 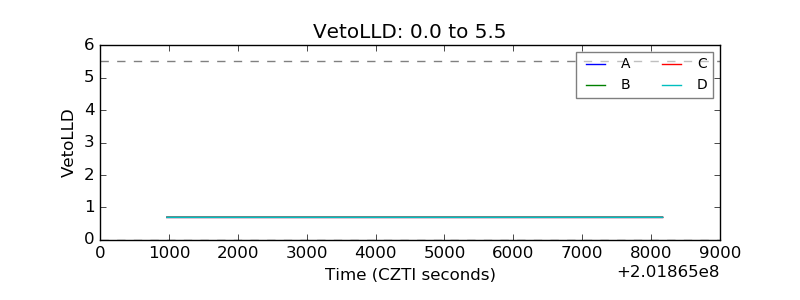 |
| Alpha Counter | 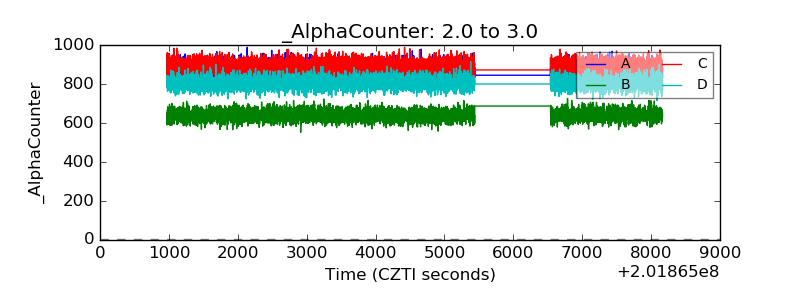 |
| _CPM_Rate | 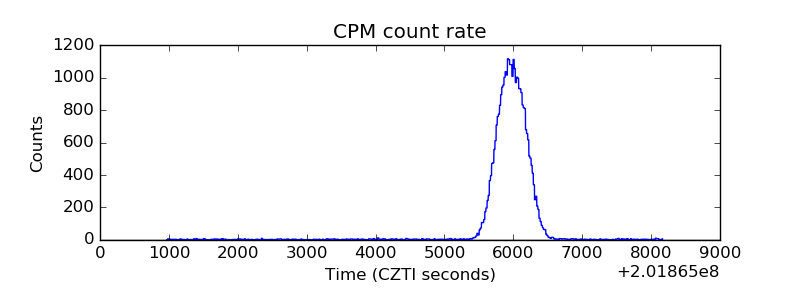 |
| CZT Counter | 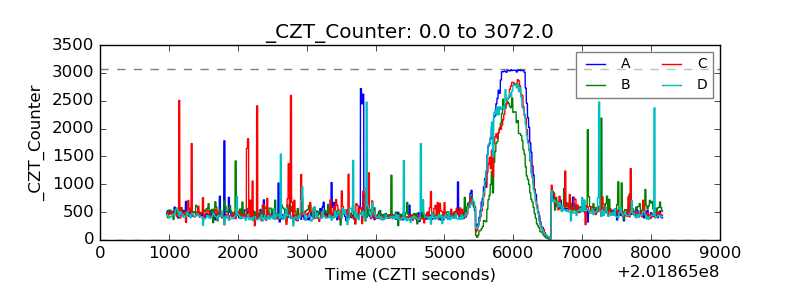 |
| +2.5 Volts monitor |  |
| +5 Volts monitor |  |
| _ROLL_ROT | 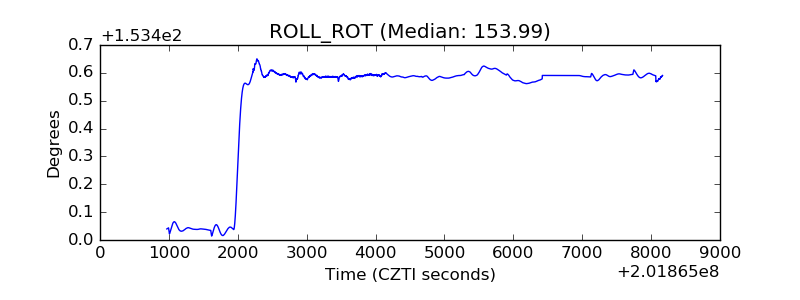 |
| _Roll_DEC | 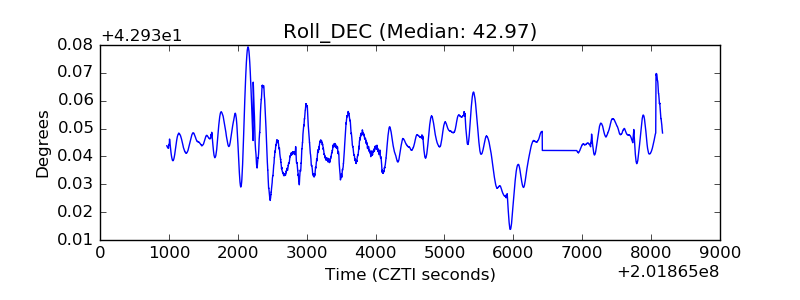 |
| _Roll_RA | 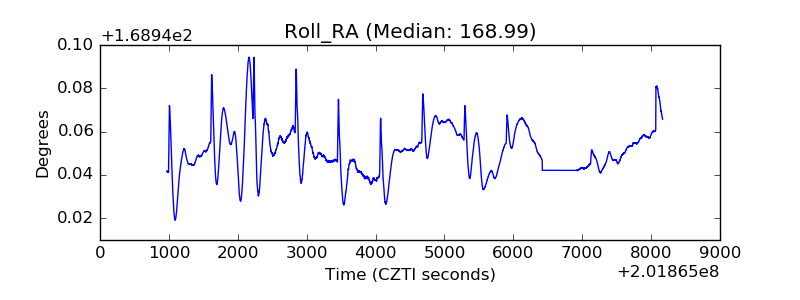 |
| Veto Counter | 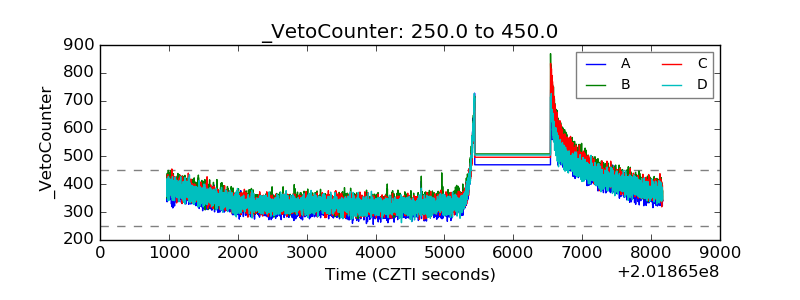 |