| Param | Original file | Final file |
|---|---|---|
| Filename | modeM0/AS1G05_045T01_9000000468_03559cztM0_level2.evt | modeM0/AS1G05_045T01_9000000468_03559cztM0_level2_quad_clean.evt |
| Size (bytes) | 453,306,240 | 91,120,320 |
| Size | 432.3 MB | 86.9 MB |
| Events in quadrant A | 2,966,624 | 595,020 |
| Events in quadrant B | 3,665,956 | 590,055 |
| Events in quadrant C | 3,565,802 | 572,957 |
| Events in quadrant D | 3,106,310 | 566,274 |
| Mode M0 | |||
|---|---|---|---|
| Quadrant | BADHDUFLAG | Total packets | Discarded packets |
| A | 0 | 12993 | 2 |
| B | 0 | 14987 | 1 |
| C | 0 | 14792 | 1 |
| D | 0 | 13622 | 1 |
| Mode M9 | |||
|---|---|---|---|
| Quadrant | BADHDUFLAG | Total packets | Discarded packets |
| A | 0 | 13 | 0 |
| B | 0 | 13 | 0 |
| C | 0 | 13 | 0 |
| D | 0 | 13 | 0 |
| Mode SS | |||
|---|---|---|---|
| Quadrant | BADHDUFLAG | Total packets | Discarded packets |
| A | 0 | 124 | 0 |
| B | 0 | 124 | 0 |
| C | 0 | 124 | 0 |
| D | 0 | 124 | 0 |
| Quadrant | Total seconds | Saturated seconds | Saturation percentage |
|---|---|---|---|
| A | 6244 | 87 | 1.393338% |
| B | 6244 | 105 | 1.681614% |
| C | 6244 | 189 | 3.026906% |
| D | 6244 | 142 | 2.274183% |
Noise dominated data is calculated using 1-second bins in cleaned event files. If a bin has >2000 counts, and if more than 50% of those come from <1% of pixels, then it is considered to be noise-dominated and hence unusable.
| Quadrant | # 1 sec bins | Bins with >0 counts | Bins with >2000 counts | High rate bins dominated by noise | Noise dominated (total time) | Noise dominated (detector-on time) | Marked lightcurve |
|---|---|---|---|---|---|---|---|
| A | 7454 | 6244 | 0 | 0 | 0.00% | 0.00% |  |
| B | 7454 | 6244 | 21 | 21 | 0.28% | 0.34% | 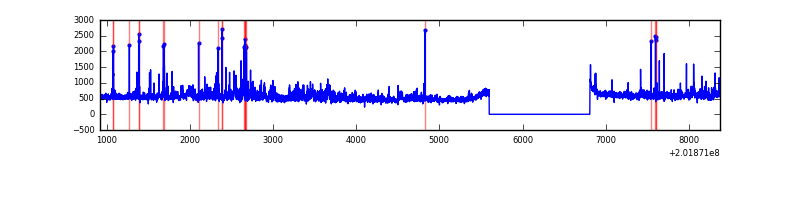 |
| C | 7454 | 6244 | 75 | 75 | 1.01% | 1.20% | 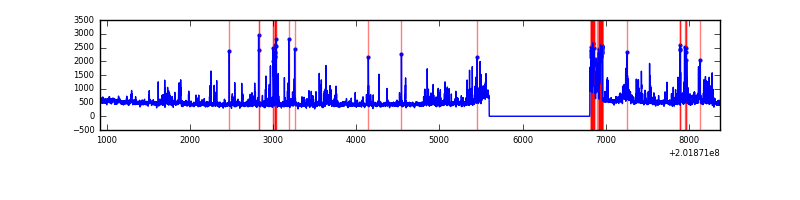 |
| D | 7454 | 6244 | 70 | 70 | 0.94% | 1.12% |  |
Top three noisy pixels from each quadrant. If the there are fewer than three noisy pixels in the level2.evt file, extra rows are filled as -1
| Pixel properties | Quadrant properties | ||||||
|---|---|---|---|---|---|---|---|
| Quadrant | DetID | PixID | Counts | Sigma | Mean | Median | Sigma |
| A | 3 | 1 | 23468 | 148.33 | 752 | 734 | 153.3 |
| A | 0 | 118 | 17315 | 108.19 | 752 | 734 | 153.3 |
| A | 0 | 50 | 16170 | 100.72 | 752 | 734 | 153.3 |
| B | 15 | 204 | 502580 | 3516.41 | 751 | 735 | 142.7 |
| B | 4 | 81 | 56475 | 390.57 | 751 | 735 | 142.7 |
| B | 0 | 244 | 27165 | 185.19 | 751 | 735 | 142.7 |
| C | 15 | 208 | 555540 | 3346.49 | 719 | 723 | 165.8 |
| C | 2 | 53 | 181580 | 1090.88 | 719 | 723 | 165.8 |
| C | 1 | 16 | 18886 | 109.55 | 719 | 723 | 165.8 |
| D | 7 | 39 | 96394 | 545.18 | 728 | 708 | 175.5 |
| D | 4 | 160 | 92274 | 521.71 | 728 | 708 | 175.5 |
| D | 13 | 239 | 31921 | 177.84 | 728 | 708 | 175.5 |
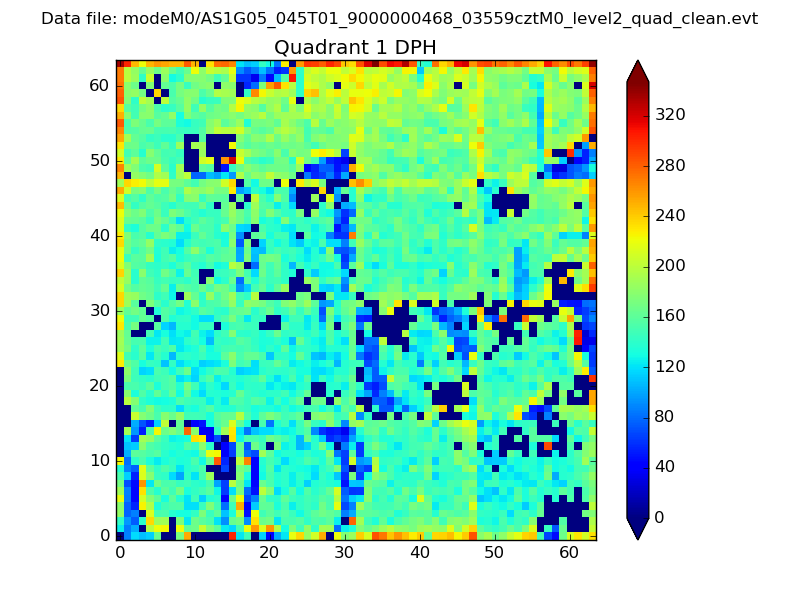
Histogram calculated using DETX and DETY for each event in the final _common_clean file
| Quadrant A |  |
 |
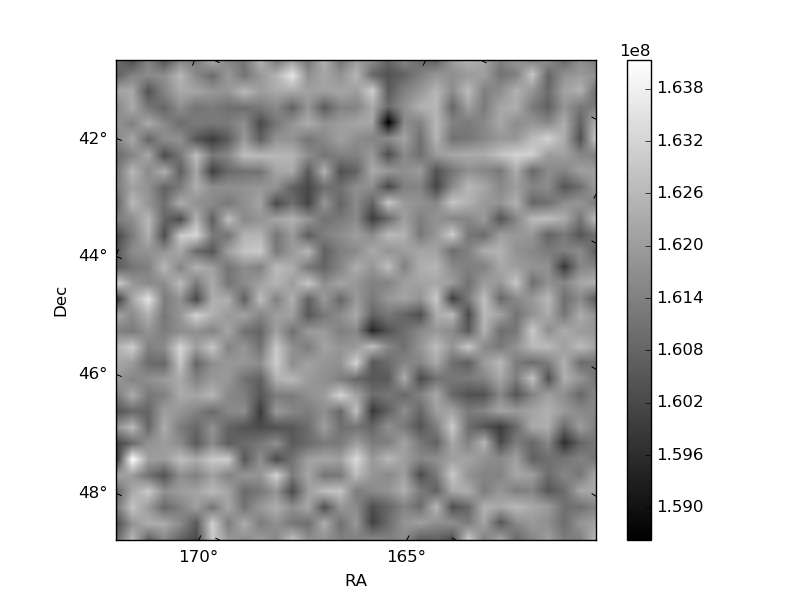
Quadrant B |
|---|---|---|---|
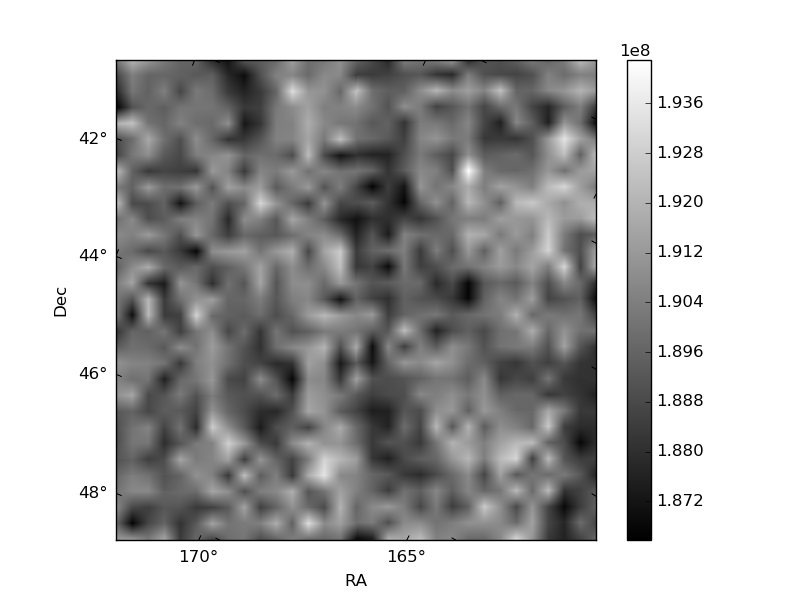
| Quadrant D | 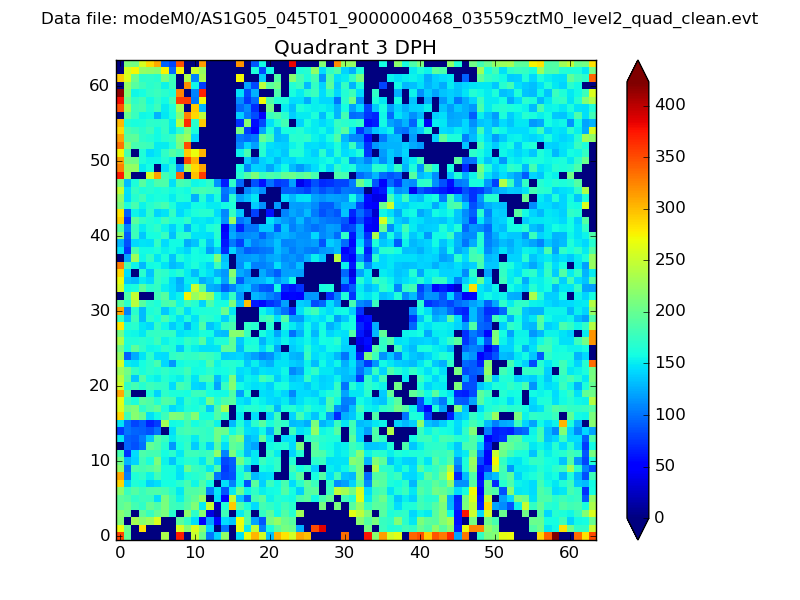 |
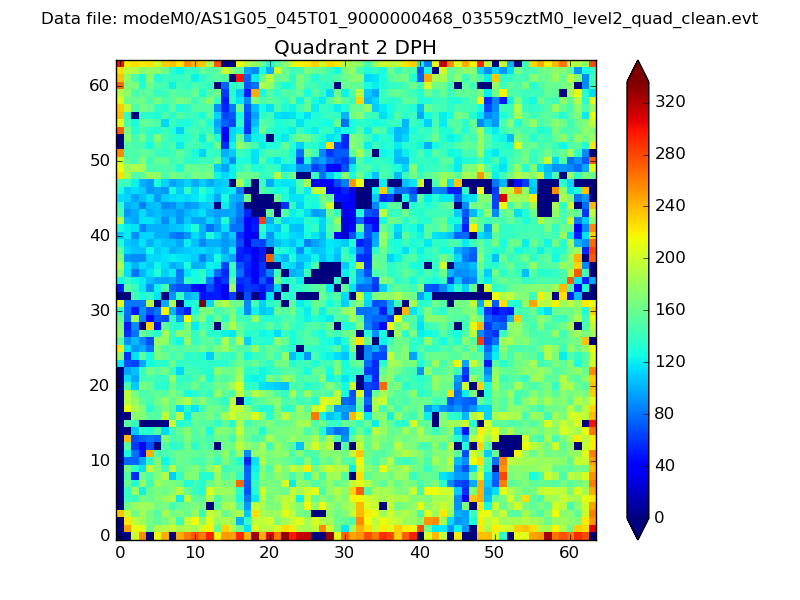 |
Quadrant C |
| Plot type | Count rate plots | Images |
|---|---|---|
| Comparison with Poisson distribution Blue bars denote a histogram of data divided into 1 sec bins. Red curve is a Poisson curve with rate = median count rate of data. |
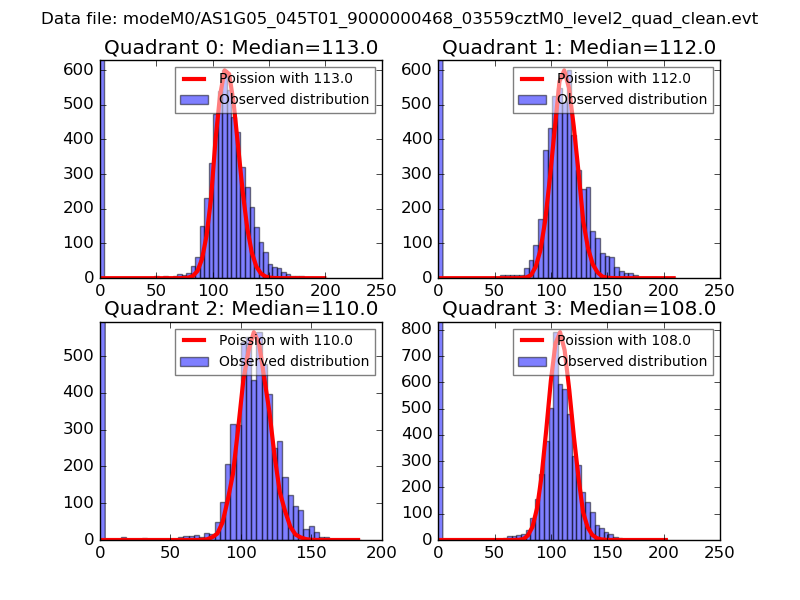 |
 |
| Quadrant-wise count rates Data is divided into 100 sec bins |
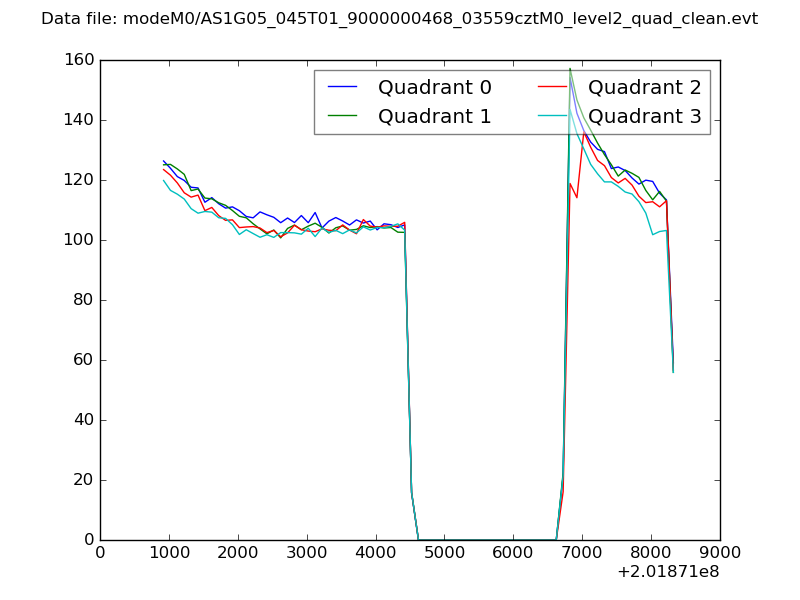 |
|
| Module-wise count rates for Quadrant A Data is divided into 100 sec bins |
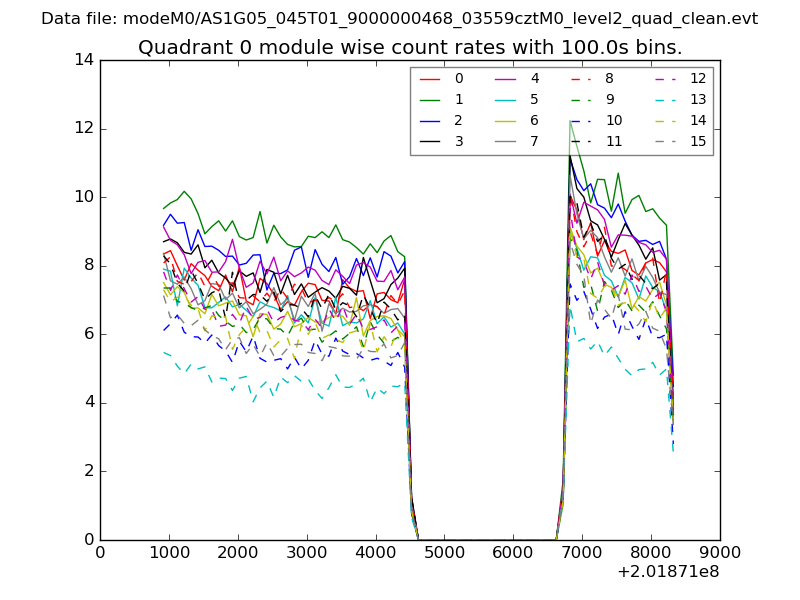 |
 |
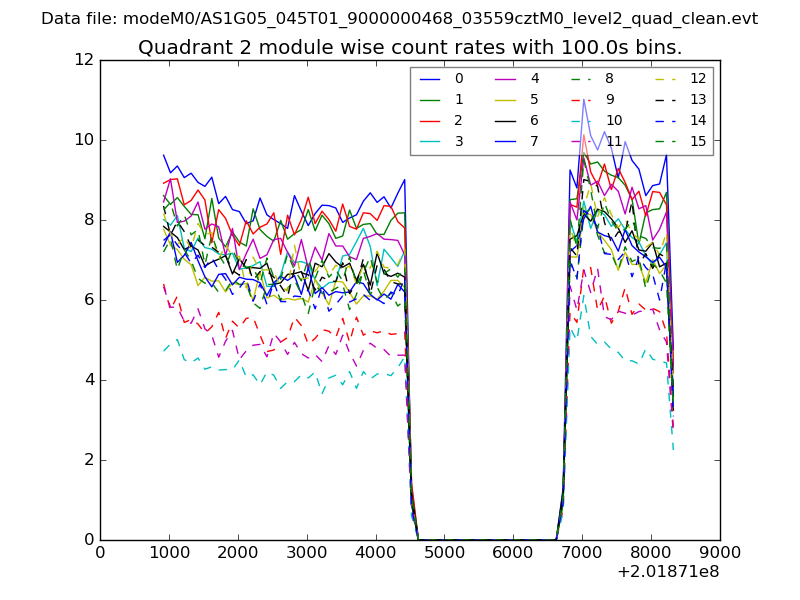
| Module-wise count rates for Quadrant B Data is divided into 100 sec bins |
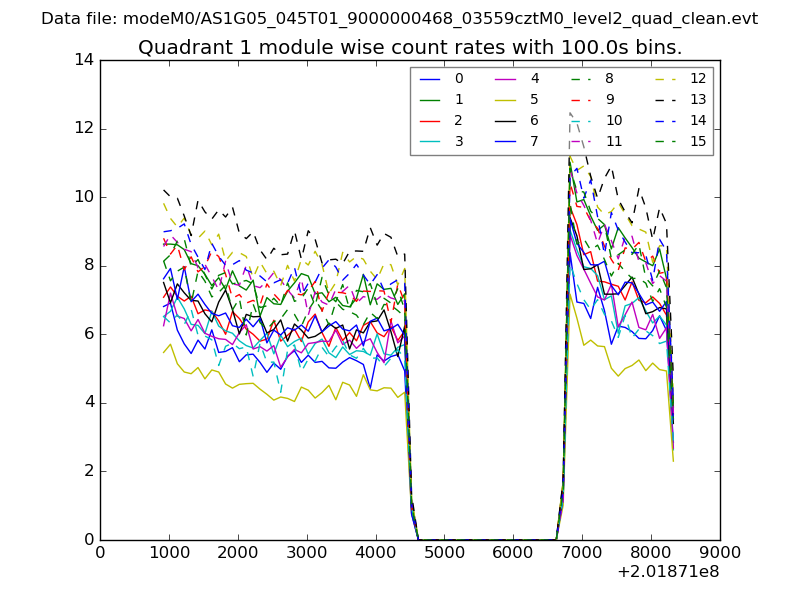 |
 |
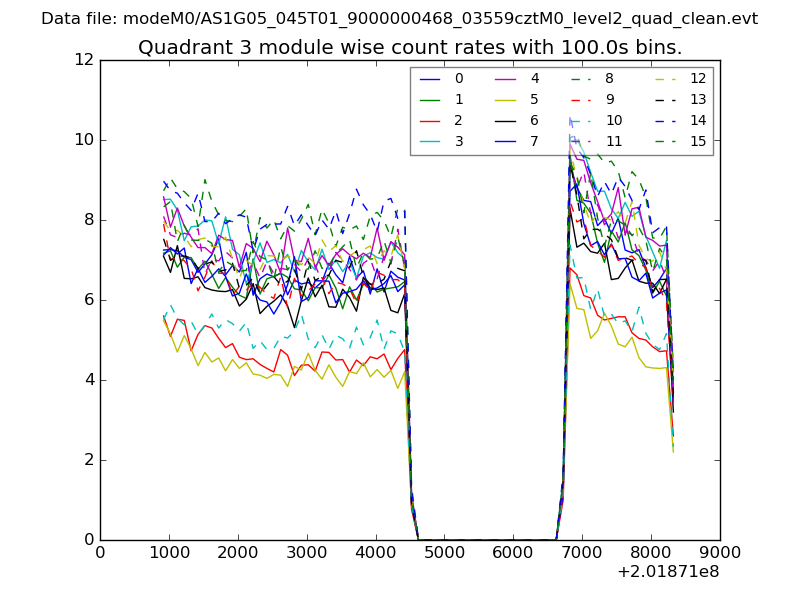
| Module-wise count rates for Quadrant C Data is divided into 100 sec bins |
 |
 |
| Module-wise count rates for Quadrant D Data is divided into 100 sec bins |
 |
 |
| Parameter | Plot |
|---|---|
| CZT HV Monitor | 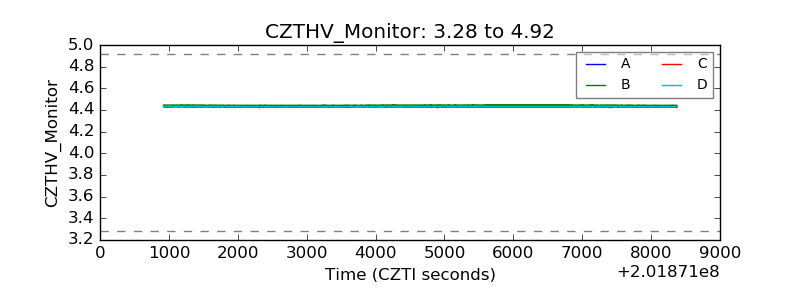 |
| D_VDD | 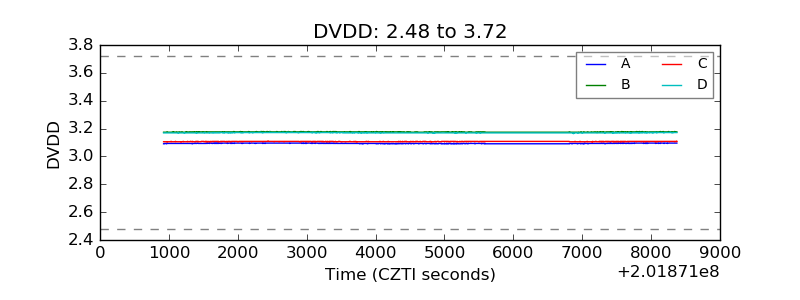 |
| Temperature 1 | 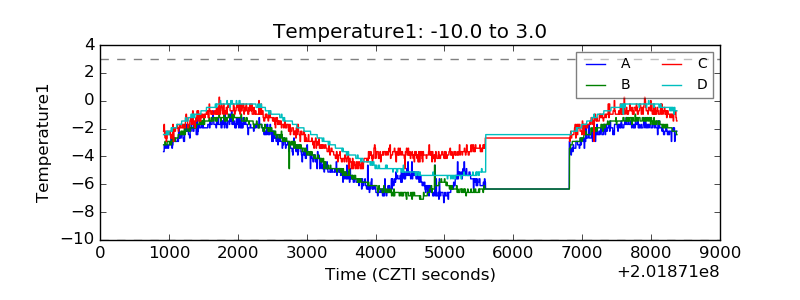 |
| Veto HV Monitor | 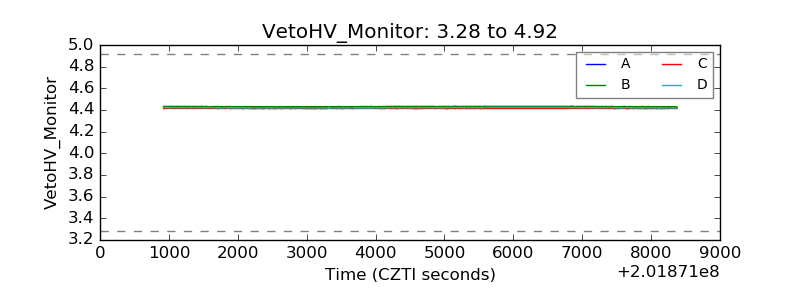 |
| Veto LLD |  |
| Alpha Counter | 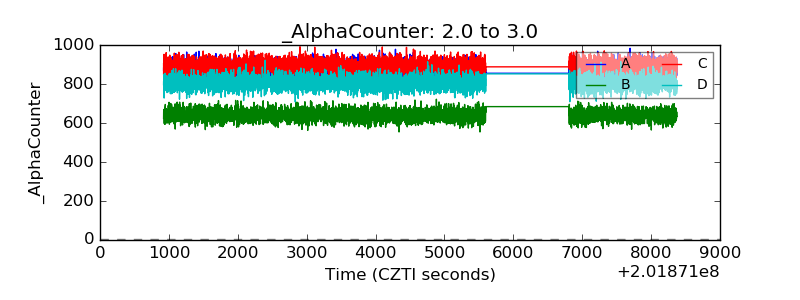 |
| _CPM_Rate | 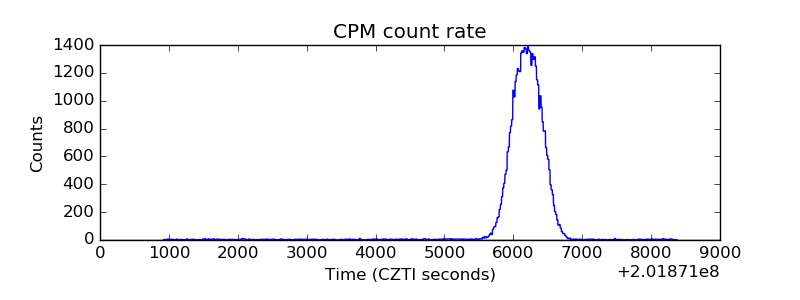 |
| CZT Counter | 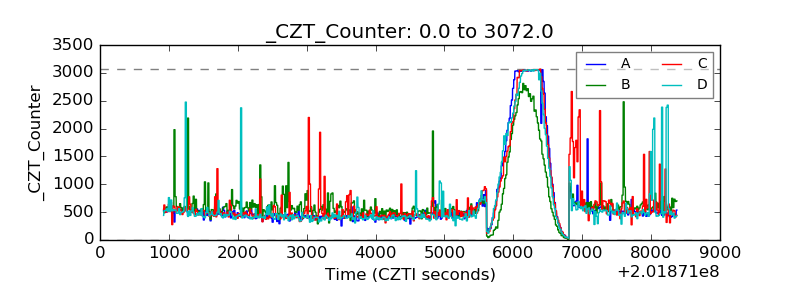 |
| +2.5 Volts monitor |  |
| +5 Volts monitor |  |
| _ROLL_ROT | 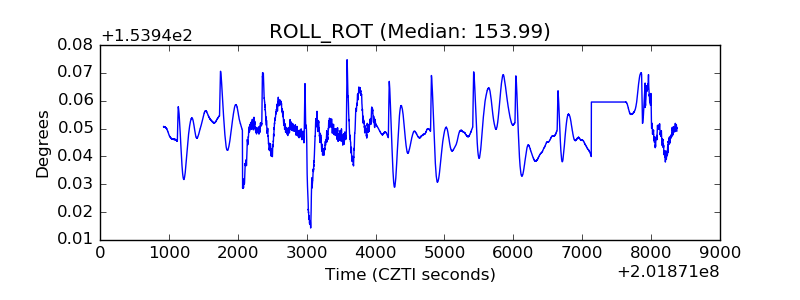 |
| _Roll_DEC | 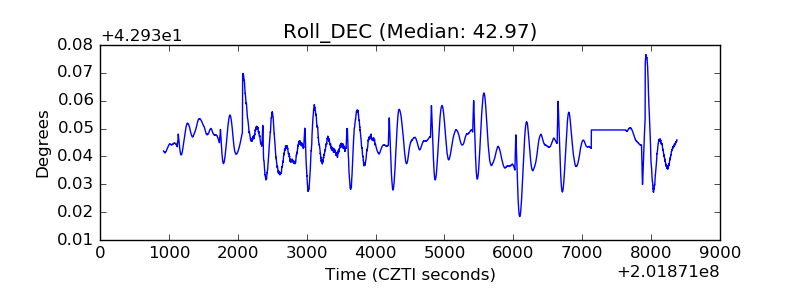 |
| _Roll_RA | 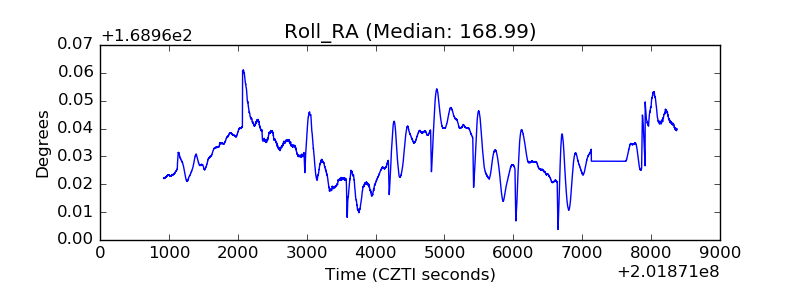 |
| Veto Counter | 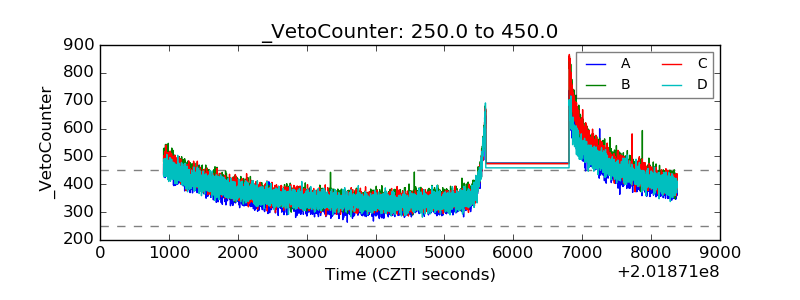 |